 Slashdot Mirror
Domain: woodfortrees.org
Stories and comments across the archive that link to woodfortrees.org.
Comments · 409
-
Re:Projections
What's interesting is that if I move your start points around, I get a different graph on with different results. It's dangerous to put too much emphasis on cherry-picked time lines.
except that warming occurred without the benefit of significant CO_2 forcing and was much more uniform.
So... According to you the industrial revolution started in 1945, and there were no large scale events going on between say 1938 and 1945 which could have influenced the global climate?
-
Re:Projections
So Box 9.2 of AR5 in which they attempt to explain the 15 year (a year ago) "hiatus" is just describing just weather, not climate, because the general circulation models predicted 0.5 to 0.6 C warming over the same interval and they couldn't possibly be wrong, could they?
Also, if you are going to ignore the cooling/flattening associated with La Nina, perhaps we should ignore the one single solid burst of global warming in the latter 20th century in association with the 1997-1998 super El Nino as well. If you are going to assert that 15 years isn't statistically significant, perhaps we should ignore the single 15 year interval with significant warming in the latter half of the 20th century, especially since this 15 year stretch is surrounded by flat to descending stretches all the way back to 1944 on the left and flat to very weakly ascending stretches from 1998 to the present. All of which can easily be seen with your own eyes here:
http://www.woodfortrees.org/pl...
That's what, 0.5 C of total warming over 75 years, almost all occurring in one single burst? Sort of like the 0.7 C of warming visible here:
http://www.woodfortrees.org/pl...
except that warming occurred without the benefit of significant CO_2 forcing and was much more uniform.
rgb
-
Re:Freebreeze to the rescue
You can't get the raw data, at least not all of it. Even if you did get it it a nightmare of to get it into anything like a useful format it's filled missing and malformed data. You can get the produced and adjusted data, Wood For Trees is probably the best place. You can make all kinds of interactive graphs of with boat loads of different datasets and processing filters.
-
Re:good
To deny SS isn't a pro-AGW/Mann-supporting site is pretty bold... But perhaps you can point to data that shows we're not stalled (not "slowing down - stalled)? Because every dataset shows we're either stalled or dropping in temperature. Mann does have his solitary tree (Yamal-06), but the dozens, even hundreds of other trees in the dataset, and the ground and satellite records show the opposite.
-
Re:good
What data series do you use to make such claims? Because HadCRUT, GIS, WTI, UAH, and RSS all show completely flat (or negative) trends over the last 14+ years.
-
Re:An ode to wankery
Finally, I'll leave you with the words of a noted global warming proponent and researcher:
"Pauses as long as 15 years are rare in the simulations, and âwe expect that [real-world] warming will resume in the next few years,â(TM) the Hadley Centre group writes. Researchers agree that no sort of natural variability can hold off greenhouse warming much longer." - Richard Kerr, Science (2009)
So, we'll see...2009 is already five long years in the past, and the pause shows no sign of stopping at this point...What pause? The one you've been hearing about on denialist websites? How about instead of hearsay, we actually look at the data?
Green is the mean global temp for the last 15 years, red is the 15 year trend line
That's why you should get your information from legitimate scientists. The 15 year trend is warmer, as you can see from the global mean temperature data.
An additional point, legitimate scientists know that yearly variations make a 15 year sample unreasonably small. Real scientists examine all available data, not merely anomalous fragment-of-the-day that happens to fit the story they want to tell. Real scientists look at 50 or 100 year trend lines, and all other available evidence.
And most importantly, real scientists obey THE LAWS OF PHYSICS. Sunlight comes in through the atmosphere, hits the ground, turns into infrared thermal radiation, and that infrared thermal radiation is blocked from escaping by CO2. Only crackpots deny basic laws of physics, only a crackpot could deny the effect is real. There is currently about 3,000 gigatonnes of CO2 in the entire Earth's atmosphere, and and humans are adding 30-odd gigatonnes per year. CO2 levels are up 42% since the beginning of the industrial revolution, and at our current rate CO2 levels will have doubled around 2050.
The natural levels of CO2 and other greenhouse gases already generate a 50 degree F warming effect. (That's what generally keeps us out of an ice-age.) Most of that effect is due to water vapor, but gases like CO2 and methane have an independent warming effect because they block different infrared frequencies.
First of all, volcanic activity has been low for a couple of decades now. The last VEI 6 or larger eruption was Mt. Pinatubo in 1991.
There has been exactly ONE VEI event above 5 in the last hundred years. The fact that it was in 1991 would, if anything, make it recent and "above normal". Not that it really matters, because it only affects temperatures for a year or two. All you've really done is point out that the warming trend over the last 15 years *isn't* distorted by any volcanic activity in that period.
Furthermore, it's conspiracy-theory logic to suggest either (A) the global scientific community is deliberately excluding volcanic activity from their their analysis, or (B) the entire global scientific community is utterly brain-damaged-stupid that none of them ever bothered to consider volcanic activity in their analysis.
So, it is in fact quite surprising if you're a devotee of climate alarmism to see temperatures stabilize like this.
There's absolutely nothing surprising. Temperatures haven't stabilized. There is no pause. There has been a warming trend of the last 15 years. And as I demonstrated in my last post, it's trivially easy for a crank to cherry pick data points and manufacture totally fake "pauses" or "cooling periods". You did look at and understand the graph I posted before, right?
I understand there are theories regarding this heat hiding in the deep ocean somehow (rather in violation of entropy it seems)
They aren't "theories". They are measurements.
You know, legitimate climate scientists going out with scientific instruments and collecting real-world sea-temperature -
Re:Ocean Heat
The first IPCC report from 1990 predicted a temperature rise of 0.15 to 0.3C/decade. Since then we have seen a temperature rise of 0.21C per decade: http://woodfortrees.org/data/g... [woodfortrees.org]
For that prediction to be shown false the trend would need to drop below 0.15/decade.
-
Re:Ocean Heat
Incidentally, if you look at the trend from 1993 to 2003 you get 0.43C/decade. Way outside the bounds of what the IPCC had predicted. You won't find any newspaper articles in 2003 saying that the IPCC has underestimated warming by half because that would have been really misleading. - http://woodfortrees.org/data/g...
-
Re:Ocean Heat
For comparison:
2000-2010: 0.130342/decade - http://woodfortrees.org/data/g...
1990-2000 0.282782/decade - http://woodfortrees.org/data/g...
1980-1990 0.064646/decade - http://woodfortrees.org/data/g...
1970-1980 0.1437014/decade - http://woodfortrees.org/data/g...
So when the prediction was made in 1990, the last decade had a trend MUCH lower than what we have seen in the most recent decade. You are better off looking at the big picture rather than focusing on any one decade. The ENSO
The first IPCC report from 1990 predicted a temperature rise of 0.15 to 0.3C/decade. Since then we have seen a temperature rise of 0.21C per decade: http://woodfortrees.org/data/g...
-
Re:Ocean Heat
There is internal variability, so some decades are going to be well over and some well under, but on average the warming has been of 0.21C per decade since 1990 as can be seen here: http://woodfortrees.org/data/g...
-
Re:Show me a climate model for the past 16 years
If the climate scientists have a model that accurately predicted the past 16 years then we can talk about the future.
There are no models that did prediction 16 years ago. The Hadley Centre's had DePreSys predicts a decade, but that only came online in 2007, not 1997.
So your requirement for talking about the future is set at impossible.
That is stupid and dangerous. Talking about the future is both sensible and important.Until then the predictions of gloom and doom are about as believable as the heavens-gate cult.
0.8C temperature rise over the past 100 years, all in a spatial and temporal distribution that matches the CO2 greenhouse effect.
Measured energy imbalance at the top of the atmosphere, demonstrating warming.
Continued sea level rise, demonstrating energy absorbance, either my melting ice sheets or my warming oceans, and thermal expansion.
Extinction pressure on many ecosystems because of changing rainfall, temperature, and phenological changes.
And you claim these observations are from predictions as believable as heavens-gate cult, because the last 16 years, the warming trend has only been about 0.05C per decade.
Much like the "pauses" in warming in 1978, 1987, 1997 and 2003?
I don't think you've thought this through. -
Re:An ode to wankery
Yes, denialist.
And here's a graph showing exactly how your denialism works, and exactly how laughably wrong it is:
The wiggly red-orange line is global mean temperatures for the last 50 years.
The pale blue straight line on the right, that's the fictitious cooling period we've had for the last 12 years. The straight purple line is the preceding 5 years of fictional global cooling. And before that is the blue line in the middle, 8 years of fictitious global cooling. And the decade before that is the green line, another fictitious period of global cooling. And the straight red line on the left is the preceding 12 year period of fictional global cooling.That graph shows that we've had nothing but (fictional) cooling periods or "leveling off periods" essentially EVERY YEAR FOR THE LAST FIFTY YEARS.
The series of straight lines.... average declining temperatures lines... is a blatant staircase going up. And it illustrates just how absurd and wrong it is when denialists trot out your claim that warming has stopped or flattened. It is blatantly fraudulent to claim any of the straight lines in the posted graph represent any halt or even slowing in the rate of temperature rise.
There has been no halt in the temperature rise. There has been no slowing in the temperature rise. You're just grabbing at cherry-picked random fluctuations to draw a fictional staircase composed of fictional horizontal (or declining) steps.
-
-
Re:Ocean Heat
The first IPCC report from 1990 predicted a temperature rise of 0.15 to 0.3C/decade. Since then we have seen a temperature rise of 0.21C per decade: http://woodfortrees.org/data/gistemp-dts/from:1990/trend
Seems like they're doing ok so far.
-
Re:But I heard
The IPCC report from 1990 predicted a temperature rise of 0.15 to 0.3C/decade. Since then we have seen a temperature rise of 0.23C per decade: http://woodfortrees.org/data/gistemp-dts/from:1990/to:2010/trend
That doesn't sound like a failed prediction...
http://clivebest.com/blog/wp-content/uploads/2011/06/plotcomp1.png
Have there been any attempts at litigation over these clear and present impacts? If so, how have they fared? (Honest question). If this has not been successful then do you still think that litigation is a solution for the trickier problem of greenhouse gasses?
Results have been largely positive for those suing for local contamination. Lawsuits have hit energy companies for illegal discharges from coal slurry 'ponds', heavy metal contamination of waterways, etc. Various suits for coal ash and coal dust pollution have also resulted in either very large victories or in agreements under which energy companies operating dirty plants have made large scale, substantive changes to fix the problems. Yet I'd like to see more; a lot more. I'd like to see states jumping in to help organize and motivate citizens to go after those who do things destructive to the local environment and to the health of local citizens.
As for the "problem of greenhouse gasses", I think that's a bridge to cross when we come to it. I've never stated that it's impossible human activities are affecting the global climate (in fact, any activity will invariably affect a system, though not necessarily in any measurable way). What I've said is that the evidence we have thus far is very unconvincing and our understanding of the global climate extremely incomplete. We've only just scratched the surface of how our global climate operates and we have a heck of a lot of work to do before we can start reaching any serious conclusions about it. Certainly the climate is changing (and it always has; this idea of a "stable climate" is a myth completely countered by all available evidence even just from recorded human history) and we should be preparing ourselves for those changes. However, that does not mean we should jump to unsupported conclusions and it certainly doesn't mean we should start actively trying to affect the global climate (e.g. these suicidally stupid climate engineering proposals coming out lately).
Let's work on preparing ourselves for the climate changes we're observing today, stopping the obviously destructive activities we're doing today, and expanding our understanding of the global climate so we can one day understand our role. Those all seem like perfectly reasonable actions which would get broad-base support, generate little controversy among anyone, and would accomplish 95% of the stated goals of the AGW crowd. However, since those actions don't praise the Truth(TM) of the AGW faith, the true believers will act like typical religious zealots and reject the whole thing. It's not enough to do the right thing for other reasons, one must fully accept the righteous path of the AGW faith as leading to salvation or one is just as damned as the polluters themselves.
And that fact right there - easily observed in every single discussion on global climate change - should tell you quite a bit about what's really happening here. It's been quite an eye opener for me.
-
Re:But I heard
Looking at the IPCC reports from the 1990s, all the major predictions have failed. The warming has been consistently, massively overestimated
The IPCC report from 1990 predicted a temperature rise of 0.15 to 0.3C/decade. Since then we have seen a temperature rise of 0.23C per decade: http://woodfortrees.org/data/gistemp-dts/from:1990/to:2010/trend
That doesn't sound like a failed prediction...
Any yet, again, none of this alters the fact that we know certain things to be destructive to the environment; at least locally. Coal fire power plants and large scale burning of other fossil fuels produce tons of air particles that cause respiratory problems in animals including humans. That problem is so obvious you can actually see it in places like China and Los Angeles. Coal slurry is another huge problem and has destroyed entire towns in places like West Virginia and Kentucky. Mountains - yes mountains - are destroyed during the mining process.
Have there been any attempts at litigation over these clear and present impacts? If so, how have they fared? (Honest question). If this has not been successful then do you still think that litigation is a solution for the trickier problem of greenhouse gasses?
-
Re:Ironic
Sea ice has been steadily increasing, despite the Intergovernmental Panel on Climate Change's gloomy forecasts.
And that, folks is why only an idiot would read the Australian. (Or any other Murdoch rag).
Hint - total sea ice extent is decreasing. Antartic sea ice extent is increasing, but not as fast as Artic sea ice extent is decreasing.
http://www.woodfortrees.org/plot/nsidc-seaice-s/mean:12/plot/nsidc-seaice-n/mean:12
-
Re:There is no uncertainty
A lot of the problem with the stories on global warming is that they respond immediately when warming indicators occur but rarely when cooling indicators do, they also rarely if ever publish the later corrections when mistakes are made.
The image that got me thinking the most is this comparison of climate models to reality; the dots and squares are reality: http://wattsupwiththat.files.wordpress.com/2013/06/cmip5-73-models-vs-obs-20n-20s-mt-5-yr-means11.png?w=640&h=480
Another good example is page 102 of: http://www.climatechange2013.org/images/uploads/WGIAR5_WGI-12Doc2b_FinalDraft_Chapter11.pdf where recent observations are less than the majority of the models that are predicting extreme rise in temperature. That document is from the IPCC.
There are quotes from a climate scientist (sorry I'm not sure which) specifically stating that 17 years without a change in global temperature anomaly would indicate that the models are wrong. We've had 17 years of no change: http://www.woodfortrees.org/plot/hadcrut4gl/from:1997/plot/gistemp/from:1997 -
Re:IPCC AGW predictions FAILED
He seems to have it wrong. "Since IPCC’s first report in 1990, assessed projections have suggested global average temperature increases between about 0.15C and 0.3C per decade" (http://www.ipcc.ch/publications_and_data/ar4/wg1/en/spmsspm-projections-of.html).
We have seen 0.23C per decade since the report was published: http://woodfortrees.org/data/gistemp-dts/from:1990/to:2010/trend.
-
Re:Models vs models
Above post is wrong... We have seen 0.23C per decade since the report was published: http://woodfortrees.org/data/gistemp-dts/from:1990/to:2010/trend.
-
Re:Human Based Climate Change vs Climate Change Ti
"Since IPCC’s first report in 1990, assessed projections have suggested global average temperature increases between about 0.15C and 0.3C per decade" (http://www.ipcc.ch/publications_and_data/ar4/wg1/en/spmsspm-projections-of.html). We have seen 0.23C per decade since the report was published: http://woodfortrees.org/data/gistemp-dts/from:1990/to:2010/trend.
-
Re:Without the sun there is no climate change at a
Solar output was relatively high from 1950 until about 1985, but has been falling ever since. The following link plots solar output vs temperatures: http://woodfortrees.org/plot/gistemp-dts/mean:12/offset:1.40/plot/sidc-ssn/mean:136/scale:0.024/plot/pmod/offset:-1365.35/mean:136/scale:3
-
Re:Double down
Here are 17 years of the current measurements: NASA GISS VS CRUTemp. NASA GISS uses the nearest available station to fill in gaps. CRUTemp just drops any region not covered. It doesn't look like "no warming" on either of them. Not sure where you got that.
-
Re:Headline - by half?
But the figures from these closest one's were already used in previous estimates?
yes - the NASA reconstruction that uses closest available data to fill in the gaps already shows much more warming than the UK data that just drops missing regions. Here is the difference between the two: NASA GISS VS. CRUTemp
However, if you leverage satellite data to fill in the gaps you get a much more precise result.
-
Re:You think that government is apolitical?
And if we add in some sun for the variation from the co2 line
-
Re:You think that government is apolitical?
First let's normalize both graphs
Lets remove some of the noise and look at a longer term graph
-
Re:You think that government is apolitical?
First let's normalize both graphs
Lets remove some of the noise and look at a longer term graph
-
Re:You think that government is apolitical?
Omg, you're going to cherry pick *four* points, and try and deny that CO2 continues to rise while temperatures have had no statistically significant warming?
Try looking at all the data:
http://www.woodfortrees.org/plot/wti/from:1995/to:2013/plot/esrl-co2/from:1995/to:2013/normalise
Nice try
-
Re:You think that government is apolitical?
One observation would be nearly every trend except CO2 indicating cooling and it actually cooling instead of just reaming stable.
And both 18 and 16 years show an upward trend.
http://www.woodfortrees.org/plot/wti/from:1995/to:2013/trend
http://www.woodfortrees.org/plot/wti/from:1997/to:2013/trend -
Re:Meh
Absolute Rubbish this Global Warming or CC whatever. Where has the warming been for the last 15 or more years?
Right here (and despite your cherry picking): http://woodfortrees.org/plot/wti/from:1998/to:2013/plot/wti/from:1998/to:2013/trend
-
Re:Sour grapes
Climate scientists can predict what warming we're likely to get, but why would you expect them to properly judge the economic effects?
Fair enough. We can predict warming (if for no other reason than rebound from the little ice age), and we have no idea whether this will be a net benefit or a net detriment. Unfortunately, prediction isn't what makes something science - astrologists make predictions, and heck, some of them even come true!
What we need is falsifiability - some set of observations, past, present or future, that would cause the true believers to give up the idea that human CO2 contributions are going to cause warming that will be catastrophic in any sense of the word. If we look *really* hard for those observations, and try our best to tear down our hypothesis, and *fail*, then maybe, just maybe, we're on the right path.
A warmer world may be better for us, or it may not be, and it will certainly disrupt things.
How would it be any more disruptive than any other climate change? Climate *always* changes, and to think we could *stop* it in its tracks, that somehow, by limiting ourselves we could appease the gods of chaos and weather, is hubris.
Also, what pause?
The pause that has meant that the world is neither significantly warmer or colder on the day of my childrens' birth than today:
http://www.woodfortrees.org/plot/wti/from:1998/plot/wti/from:1998/trend
It's like mother nature has a sense of humor - here I am, talking about how the climate always changes, and yet for both of my children, the temperature today isn't significantly different than the days they were born
-
Re:Freeman Dyson
There is no pause. Please inform yourself - it's embarrassing.
Some information for you: Scientific American: Is the Pacific Ocean Responsible for a Pause in Global Warming?
NPR: A Cooler Pacific May Be Behind Recent Pause In Global Warming
USA Today: Pacific Ocean cools, flattening global warming
But maybe the UK Met Office admitting it's been flat for 16 years, or just looking at the HADCRUT4 data would be a better source?
-
Re: Uhg, not Cass Sunstein
Skeptical Science, please lets be serious. The truth is that the data sets shows a definate downtrend, its not statisticaly significant but its there;
RSS: -0.04K,
GISS: shows a -0.06 trend,
HadCRUt4: -0.07K
NCDC: -0.04K,
UAH: +0.00K.
All data sets show the current temperature are below well model predictions. If the climate is going to get back on the predicted warming trend line, its going to take some spectacular temperaure increases. -
Re:Dog and cats! Living together! Mass hysteria!!!
Have you not been paying attention for the last six months? The AGW establishment has admitted the pause and are scrambling to find the reason.
Wonder why you are so interested in 1998? Like the taste of cherries?
-
Re:Honesty?
The Intergovernmental Panel on Climate Change (IPCC) was formed in 1988, so where do you get the idea that what it's called has changed?
The indisputable increase in global average temperature due to human CO2 emissions is called global warming. The response of the global climate system to that increase is called climate change. The climate changes vary by locale. That distinction has been there for quite some time.
-
Re:How is this "contrary"?
Looking at the current trends, not only has there been no statistically demonstratable temperature increase for the past 16 years, there is a decline over the last 5 years.
If you use only the last 16 years you can't reject the idea it's just short term noise, but there's obviously more data than that. Claiming the last 16 years is not enough to show there's warming in the same sentence as you claim the last five years is enough to show cooling is just absurd.
If you look at the data it's easy to see the amount of years have been cherrypicked to coincide with a peak in temps anyway. -
Re:Spark notes
Woodfortrees.org is a great resource when claims like these set off your BS detector. Here is the monthly sunspot number with a 138 month mean to smooth out the 11.5 year cycle. It shows rapid decline since 1985 - exactly the period when temperatures have shot up. I'd say you were right to be skeptical: http://woodfortrees.org/plot/sidc-ssn/mean:138/from:1900/plot/sidc-ssn/from:1900
Here is solar irradiance. The red line shows the 11.5 year running average. Again the direction is down while the temperatures go up: http://woodfortrees.org/plot/pmod/mean:138/plot/pmod
You can even plot temperatures against sunspots and see how they correlate. (spoiler - not well since the 80's): http://woodfortrees.org/plot/sidc-ssn/mean:138/plot/hadcrut4gl/mean:12/scale:90/offset:80
-
Re:Why even bother involving this study ?
Here is a graph of global temperatures using skeptic Roy Spencer's satellite reconstruction: http://woodfortrees.org/plot/uah/plot/uah-land/trend Temperatures have gone from -0.25 to 0.25 since 1980. That is 0.5C in 30 years or 0.16C/decade. [Layzej]
Here is a classic case of cherry-picking your data in order to try to prove your point. You are comparing the low temperature from one year to the high temperature of another. [Jane Q. Public]
That's nonsense, Jane. Click on "raw data" then scroll down:
#Time series (uah-land) from 1978.92 to 2013
#Least squares trend line; slope = 0.0175687 per year
1978.92 -0.295807
2013 0.302992
So Layzej actually understated the warming trend, which his link calculates (not cherry-picks!) based on all the UAH satellite data to be 0.175C/decade.
Note that the supposed average starts at that low point on the left. In a curve that accounted for prior data, the line would start somewhat further up. [Jane Q. Public]
The supposed average? Do you mean the trend line fit to the UAH data with ordinary least squares? Also: what prior data? Again, there is no prior UAH data.
Also, look at the years chosen: if you choose instead 1998 to present, you end up with (roughly) 0.4 to 0.3, or a change of -0.4. [Jane Q. Public]
Again, this is nonsense. Layzej didn't choose any years, as anyone who glances at the URL can tell. He loaded the entire UAH dataset.
Ironically, right after baselessly accusing Layzej of cherry-picking data to show that the Earth is warming, you once again endorse cherry-picking a shorter timespan, despite the fact that shorter timespans have larger error bars.
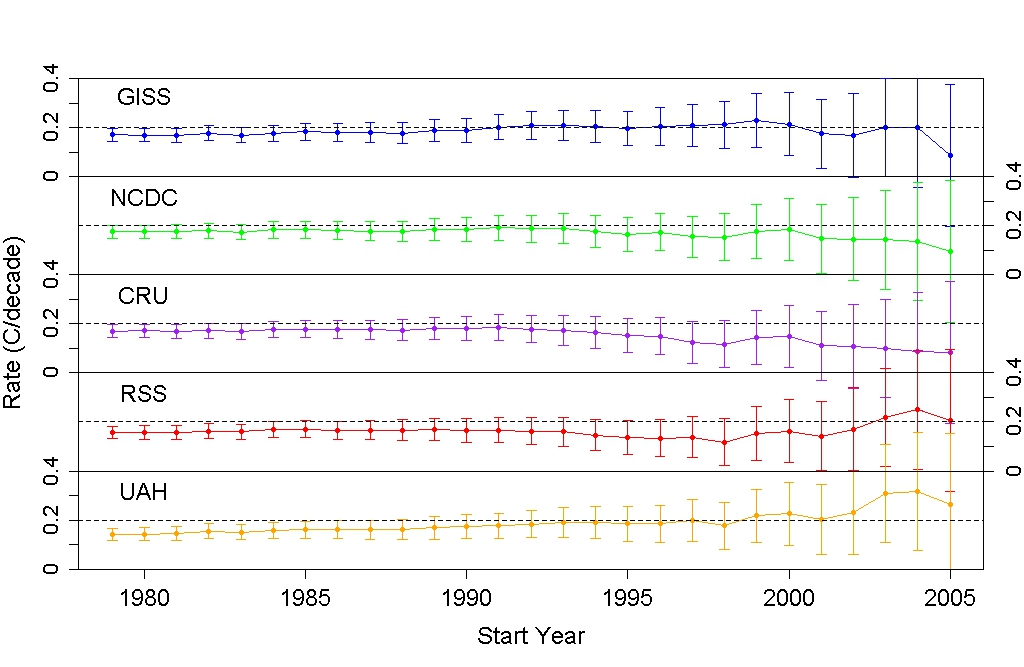
These error bars can be shrunk by accounting for natural variability. I've recently discussed warming trends and uncertainties over the last 16 years. This graph removes natural variations like solar activity, ENSO, volcanos, etc. Notice that the warming trends since 1998 for all 5 adjusted datasets are statistically significant at the 95% confidence level, and they're all statistically indistinguishable from the IPCC's projection.
I'm not arguing with you about AGW. I'm just saying that the evidence you have used to support your point is almost laughably weak. [Jane Q. Public]
No, you're not arguing about anthropogenic global warming; you're baselessly (and ironically) accusing Layzej of cherry-picking data to "try" to prove the obvious point that the world is warming as scientists predicted.
Jane, please stop spamming humanity with all this misinformation. It's staining your legacy and threatening the future of our civilization.