 Slashdot Mirror
Domain: noaa.gov
Stories and comments across the archive that link to noaa.gov.
Comments · 2,602
-
Re:Skeptcisim vs Propoganda
You can find links to NOAA's data here. If you want links to the historical raw data I believe you can find it here or here but you may have to apply corrections to the data yourself.
-
Re:Skeptcisim vs Propoganda
You can find links to NOAA's data here. If you want links to the historical raw data I believe you can find it here or here but you may have to apply corrections to the data yourself.
-
Once more
The cumulative effect of all adjustments is approximately a one-half degree Fahrenheit warming in the annual time series over a 50-year period from the 1940's until the last decade of the century.
link.
.5C is the AGW signal over that time span. Their adjustments are the cause for alarm.
This document used to be linked from their climate page only two weeks ago. Now it's not. I wonder why. I'm sure it has nothing to do with what's going on in Copenhagen.
Of course I expect you to reply that this is regional data (it isn't) or that NOAA isn't reliable. I don't expect you to get your head around the idea that if your corrections to the underlying data are the indica that are your report, you have scientifical issues. Maybe there's something good on TV.
-
Skeptcisim vs Propoganda
Ah yes, it doesn't take long for someone to post a link to the fully qualified blogger Anthony Watts whenever the word skeptic appers in conjunction with climate, but if you call yourself a skeptic then consider the following...
Well before Watt's stared his website scientists had already explained how adjustments are made to compensate for the urban heat island effect but that didn't stop our pluckly little weatherman from building a website to show those ivory tower dwellers where they were sorely mistaken. As Watts fame (and income) grew, NOAA thought it might be a good idea to try and add some clarity so they took 70 weather stations that Watt's himself had rated as the best. They re-ran their analysis with just those stations and compared the result to the original analyisis using all 1200+ stations. Lo and behold the two curves were virtually identical as can be seen on the first graph in NOAA's response to Watts. Why? - Because the trend does not rely on the abolute temprature, it relies on the changes in temprature. Such systematic errors in measurement have long been known and handled by mathematicians and scientists alike.
Observant readers may note that a fully qualified political scientist by the name of McIntyre did manage to get a paper on the subject published in an obscure journal which was subsequently hyped so much that the US senate held an inqusition (err, inquiry) into Mann's 1997 hockey stick paper.
The inquisition called on the US National Acedemies of Science to proffer an opinion on McIntyre's claims. Their testimony came down heavily in favour of Mann's conclusions but also made some minor crticisims of his confidence levels. Mann being the leading scientists he is took those critcisims seriously and subsequently published an extended study in the journal Science, yes that's right, the world renowned journal published by the very same organisation who critcised his confidence levels.
McIntyre's paper failed to stand the test of time but rather than having another crack at science he went off to become yet another fully qualified blogger and created the popular front site "climate Audit", I say front site because both Watt's are McIntyre are stongly associated with the anti-science lobbyists at the CEI and the Heartland Institute (now there's a couple of targets for an email hack if I ever saw one).
McIntyre used his site to continue pushing the claim that Mann had hidden his data (where have we heard that before?). To put it politely, I am highly skeptical of that claim. If it was true then how did NAS come to it's conclusions in their testimony, and how is it that many others have also replicated Mann's work? Why is it that both Watts and McIntrye take selective quotes from the testimony to loudly declare that they "discredited Mann's hockey stick"? - You would think that if the testimony actually came to that conclusion then they would want you to read it. Yet nowhere on either site will you find an link to the testimony because...well...skeptical people might actually go and read it.
Considering the above farcical chain of events I don't blame Mann for expressing his desire to keep McIntyre's discredited paper out of the IPCC reports, I would have said the same thing. However this does not change the fact that the paper was subsequently included and discussed.
For those who don't like to read scientific papers and abhore pdf's there is an excellent summary on the youtube channel Climate crock of the week, unsurprisingly Watt's abused the DCMA in an attempt to have the video removed.
The skill of genuine skepticisim starts by learning to be skeptical of ones own ideas and beliefs. It's siad that a great scientist starts every day by -
Re:These "scientists" weren't
Uhh, please check your facts. There are several proxy records available, such as stalactites, bore holes, ice cores and lake sediments. Tree rings are just one part of paleoclimate observational data. Global temperature records are available from 1850 onwards (from 1880 if you only include NOAA and GISS).
Between 1850 and 1960, all proxy reconstructions fully agree with the direct temperature readings. The only problematic one is the tree rings after 1960. Before 1960, all proxy reconstructions agree with each other, within experimental uncertainty. All proxy reconstructions except for tree rings show a dramatic increase in global temperatures.
It's also well-known and well-documented, and well-published, that some tree rings show a fall in temperature after 1960. This is not a new problem, and you are not the first person to suggest there may be a problem. Mind you, even if we had to scrap all tree ring data, or even all proxy reconstructions, it's still only a drop in the ocean of evidence.
Where is the fraud?
-
Data sources
They've also refused to disclose their raw data, or even a list of what data they used.
Let's pick on GISTEMP since they've open-sourced their analysis code. From their site:
The current analysis uses surface air temperatures measurements from the following data sets: the unadjusted data of the Global Historical Climatology Network (Peterson and Vose, 1997 and 1998), United States Historical Climatology Network (USHCN) data, and SCAR (Scientific Committee on Antarctic Research) data from Antarctic stations.
Links to these data sources are provided in the documentation of their freely available analysis software:
Basic data set: GHCN - ftp://ftp.ncdc.noaa.gov/pub/data/ghcn/v2
v2.mean.Z (data file)
v2.temperature.inv.Z (station information file)For US: USHCN - ftp://ftp.ncdc.noaa.gov/pub/data/ushcn/v2/monthly
9641C_200907_F52.avg.gz
ushcn-v2-stations.txtFor Antarctica: SCAR - http://www.antarctica.ac.uk/met/READER/surface/stationpt.html
http://www.antarctica.ac.uk/met/READER/temperature.html
http://www.antarctica.ac.uk/met/READER/aws/awspt.htmlFor Hohenpeissenberg - http://members.lycos.nl/ErrenWijlens/co2/t_hohenpeissenberg_200306.txt
complete record for this rural station
(thanks to Hans Erren who reported it to GISS on July 16, 2003)They've gone as far as ignoring FOIA requests to the point where NASA will soon be facing litigation.
The FOIA requests do not request data or data sources. CEI is asking for documentation, such as memos or e-mail, of discussions related to several topics including RealClimate.org and the error McIntyre discovered. Read it in their own words.
They can open-source all the algorithms they want, but without showing their data, it's completely useless.
Now that you have the data as well, we look forward to your analysis.
-
Re:Scientists are human.
One picture tells it all:
(graph of the difference in degrees between raw and "final" data sets)
http://www.ncdc.noaa.gov/img/climate/research/ushcn/ts.ushcn_anom25_diffs_urb-raw_pg.gifWait, you mean they have posted their secret fudge factor on a public webpage and it has just been found out? Amazing!
-
Re:Complete nonsense.
I'd settle for 500 years of accurate, precise (with an error no greater than 0.05C) temperature measurements from at least 5000 sites scattered reasonably uniformly over the globe.
Considering that CO2 levels will continue to rise for 1000 years afterwards -- we really will have missed a chance to build a sustainable economy. By analogy, you won't save the building from fire, because you want to measure exactly how hot the flame is, to within 0.5C, to prove that the house is really in danger.
In assessing certainty, one cannot simply pull number like 500, 5000 and 0.05C out of thin air. There is a confidence interval that goes with the measurement. Do you know what that confidence interval is? Didn't think so.
On the other hand, climate scientists *do* know what their confidence interval is. It is all in the ipcc reports. Ever read one? Didn't think so.
No, tree rings won't do. Nor will ice cores. Because we have less than 100 years of temperature measurements to calibrate them with.
I'd trust statistical techniques to assess the error range of proxies, over rules of thumb.
Oh, and I'd like to be able to see the raw data, the massaged data, and the formulae used to do the massaging. Note that the CRU people can't or won't provide the raw data - either of which is a big warning sign in my book.
The CRU people provide almost all of the data, except for date they cannot provide because it is not theirs to provide. That is hardly a conspiracy. In fact, they are simply obeying the law. The vast majority of the data is here. You can also find tonnes of raw data and source code here
I say all of this with no expectation of having convinced you of anything. Try to find a "top 10" skeptic arguments. No such resource exists, because wild charges of conspiracy is the best evidence that skeptics have. If you fail to find a top 10, that actually contains sound arguments -- would that be sufficient to cast doubt on your AGW opinion, or will the burden of proof just shift further away? -
About That Data
Interesting thing about the NASA Data. Check this graph from NASA
This shows that virtually all of the warming seems to come from their "corrections".
Seems this would have a difficult time passing the smell test.
-
Re:Calling Pons and Fleischmann...
With the global warming 'scandal', you have a few scientists who are the only ones with access to the raw temperature data.
-
Re:Scientists are human.
Really?
Answer this: http://www.ncdc.noaa.gov/img/climate/research/ushcn/ts.ushcn_anom25_diffs_urb-raw_pg.gif
Answer this:
yrloc=[1400,findgen(19)*5.+1904]
valadj=[0.,0.,0.,0.,0.,-0.1,-0.25,-0.3,0.,-0.1,0.3,0.8,1.2,1.7,2.5,2.6,2.6,$
2.6,2.6,2.6]*0.75 ; fudge factor
if n_elements(yrloc) ne n_elements(valadj) then message,'Oooops!'
---Some code removed here for brevity.
; Now normalise w.r.t. 1881-1960
mknormal,densadj,x,refperiod=[1881,1960],refmean=refmean,refsd=refsd
---Some code removed here for brevity.
; APPLY ARTIFICIAL CORRECTIONThis is not a trifling matter. There are serious consequences to accepting the AGW theory.
I eagerly await your answers...
-
Re:Scientists are human.
One picture tells it all:
(graph of the difference in degrees between raw and "final" data sets)
http://www.ncdc.noaa.gov/img/climate/research/ushcn/ts.ushcn_anom25_diffs_urb-raw_pg.gifPeople aren't doubting SCIENCE.
People are understanding that SCIENTISTS are as likely as anyone to be venal, petty, biased, partisan, and above all the previous 8 year administration showed us: political.When someone shows a graph of temperature data, that's interesting science.
When I (thanks to the internet) can pull up the raw paleoclimatological data from NOAA, and ask "hey, Mr. Scientist, why is it that your data doesn't match what I see?" and I get a lot of bullshit, handwaving, and a cavalcade of smoke and mirrors - I become somewhat skeptical.http://wattsupwiththat.com/2009/12/08/the-smoking-gun-at-darwin-zero/
I understand, it's much easier to just call your critics "stupid" than to acknowledge that the dogma you've been parroting is falling apart.
-
Data and algorithms
Other research centers also collect similar data, and some have open-sourced their algorithms.
And yes, their conclusions are similar to those of the CRU. That's what the GP means by saying that criticisms have been answered.
-
Re:Nice try
Yes and yes (yes, Realclimate again, but try clicking the links and reading this time).
I click on them, and then I actually read them.
#1 cites Mann. Thats right, its cites Mann. Do you even comprehend the stupidity of using Mann to validate Mann? Why do you keep doing it.
#2 shows a graph, with something similar to Mann's stick produced by Oerlemans, Moberg, and Esper. Before I roast your citation, I am going to point out that Moberg has co-authored at least 8 papers with Jones. Now on with the show.
This is the RealClimate version of Oerlemans graph.
But this is NASA's version of the graph. AND THEY PROVIDE THE ACTUAL DATA
Why doesnt Mann's version of the graph (hosted by Mann and used in defense of Mann) look anything like NASA's version(hosted by NASA and used to illustrate whats in the paper?)
You really are a sucker. -
Re:Data thrown awayHere's a small portion of the data which is opensource: (see http://www.realclimate.org/index.php/data-sources/#Climate_data_raw)
- GHCN v.2 (Global Historical Climate Network: weather station records from around the world, temperature and precipitation)
- USHCN US. Historical Climate Network (v.1 and v.2)
- Antarctic weather stations
- European weather stations (ECA)
- Satellite feeds (AMSU, SORCE (Solar irradiance), NASA A-train)
- Tide Gauges (Proudman Oceanographic Lab)
- World Glacier Monitoring Service
- Argo float data
- International Comprehensive Ocean/Atmosphere Data Set (ICOADS) (Oceanic in situ observations)
- AERONET Aerosol information
You can follow the original link to realclimate.org to find many other links to data sources. I have posted the data sources above only because many critics of AGW won't even bother with realclimate.org as they are thought to be part of the conspiracy. The data exists and is public as is the source code.
-
Re:Politics
The data is all there (especially from US sources). Here's a very non-comprehensive list:
Data:
NOAA NCDC: http://www.ncdc.noaa.gov/oa/ncdc.html
NOAA sattelite data: http://www.class.noaa.gov/
ARM data: http://www.archive.arm.gov/armlogin/login.jsp
NASA GISS data: http://data.giss.nasa.gov/
NCAR data: http://www.ncar.ucar.edu/tools/datasets/Models:
NASA GISS GCMs: http://www.giss.nasa.gov/tools/
NCAR models: http://www.ncar.ucar.edu/tools/models/ -
Re:Politics
Extremely non-comprehensive list based on sources I've used:
Raw Data:
All of NOAA's satellite data http://www.class.noaa.gov/
NCAR's Data http://cdp.ucar.edu/home/home.htm
ARM data http://www.archive.arm.gov/armlogin/login.jsp
NASA data http://data.giss.nasa.gov/Models:
NASA GISS GCMs http://www.giss.nasa.gov/tools/
NCAR models http://www.ncar.ucar.edu/tools/models/ -
Re:Oh really, what about the code then?
You just posted a graph.One graph. And getting to the page that embedded that graph was circuitous-- it was not a matter of just chopping the url properly. No matter.
This plot shows that most of the discrepancy comes from the Station History Adjustment Program detailed in Karl and Williams 1987. I don't have a subscription to the Journal of Climate and Applied Meteorology though.
The problem is that stations were moved, often from city centers to airports. The corrections are an attempt to reconcile the microclimate of the first site with the microclimate of the second in order to produce a continuous climate record. This sort of datasplicing is what drove Ian Harris up the wall. Are you sure you want the raw data?
-
Re:Found it - with links
ESR is a conspiracy nut. Has been for a while, actually. His comments on this are about as accurate as would be expected - i.e. a bunch of sensationalist BS:
ESR is a bright guy. When you've done as much to improve my life, maybe I'll respect your opinion as much. That's a tall hill to climb.
* The code in question is fudging temperature measurements from tree cores at high northern latitudes post-1960 in order to match actual temperatures. These aren't used in the reported global temperature figures, because they're known to be wrong.
The tree samples are from Bristlecone Pines. I know this tree, I grew up around them. They're an endangered species. It's a strip bark tree. They were told to not use strip bark trees. The bark of the tree happens to wander around the perimeter over time, sometime covering areas that haven't seen bark in centuries or a millenium. It's the oldest living individual organism on the planet. One study has different samples from the same tree differing on individual rings by six or seven sigmas. You might as well roll dice. You have to see the environment these trees are in to understand that a passing elk can influence their growth for a decade or more.
* The fudged numbers aren't actually used anywhere - the code that would use them is commented out.
I direct your attention to this graph from NOAA that mirrors these corrections. That's a polite way of saying you're full of shit.
* If the code in question was uncommented, it would plot the fudged and uncorrected data against each other, complete with an appropriate title and different colours for each line - hardly something you'd do if hiding the fact you were fudging the figures
The models themselves when substituting red noise for the temperature data give the hockey stick graph 99% of the time.
* In actual fact, as far as anyone can tell, none of this code was final. It appears to have been a temporary hack that was superseded by later code that calculated its own correction.
It was superceded by code that operated on data that was pre-corrected, the original source data for which is now "lost" but which can be reconstructed by removing the "correction".
* Even the corrected figures from the newer code don't seem to have been used anywhere. The only version of the MXR tree-core data anyone's been able to find in published papers is the uncorrected one.
See above.
* Oh, and not only was the issue with this data reported in a high-profile paper, it looks like the main author of the paper was the guy behind this code.
Counting as credibility the reputations fooled is a fool's game. We're talking about science. Science is observation, measurement, analysis and prediction. AGW is not science. AGW predicted a spike that didn't come a decade now. It's a show, and the show is over.
-
Re:Oh really, what about the code then?
That's just a graph. The science behind the graph is detailed here. Well, you'll probably have to dig into the references to understand all the science, but it's summarized nicely on that page.
The data is corrected for time of day, urban heat island effects, and changes in measuring technique.
-
Re:Oh really, what about the code then?
If you look at these correction factors they're virtually identical to the one NOAA uses. These are the only two terrestrial datasets that link us back using proxies to times before reliable measurements. The other datasets calibrate on this adjusted data. In many cases the adjustments are more than five times as large as the observed change present in the raw data. Using these correction factors you can show a 1997 temperature spike using gaussian noise as your temperature input. If you invert the corrections you can almost visualize glaciation returning to Florida by the end of the millenium, which oddly enough was the big climatic change we were worried about when I was a kid - on just as sound evidence.
-
Re:Oh, hey,
If carbon dioxide increases global temperature, did carbon dioxide stop increasing since 1998?
No, the CO2 level continues to rise. The issue is that there is significant year-to-year variation in the global temperature. The climate question is whether or not CO2 will (and has) over the long term affect the climate, and how, and how much. The consensus is that the overall trend is that the temperatures are going up significantly over the long term and will continue to go up.
So, why is 1998 higher than the years since? Because of the statistical variation along with a very strong El Nino (see: El Nino). An analogy, since they are popular on Slashdot: If the stock price of a company has been going up for the past 10 years with significant fluctuations, had a spike because someone tried to buy the company, but went down in the last week, it is not evidence that the stock has lost value over the longer term, or that the stock will continue to lose value. It _might_ go down in the future of course, but you can't tell from a short term fluctuation. Similarly, the global temperature has rising for the past 100 years or so, and a single year spike in 1998 doesn't change that.
The temperature data is fundamentally noisy. That's the nature of weather data. Take a look at the data that NASA produces. There's lots of noise. See the big spike in 1998? Well, that doesn't mean the "globe is cooling". The trend is definitely up. The deniers will claim that the data in that plot is 'cooked', or 'manipulated', or 'corrected' to show a politically-desired outcome. The scientists who produced it will say that they are handling huge volumes of data, from different data sources, and have to be combined, and they are doing it the correct way. And that's the fundamental argument in this entire page. Are they, or are they not, cooking the long term data? The "whole globe is cooling because 1998 was hottest" is a complete red herring. What the data really says about the long term is the question. -
Science is a process
Have you ever tried to have a rational discussion about climate change with someone who's either unaware of willfully ignorant of the science?
Have you ever tried to have a rational discussion about science with someone who's unaware of statistical analysis or the importance of reproducibility? It's like talking to a wall.
Take for example the raw climate data. It's level noise. Unless you add in adjustments like this and this it's completely boring annual measurements that vary but don't trend.
Adjust them, and they're sexy. They are alarming. They're a cause for action that makes the science interesting and important. We all like to be important, don't we?
-
Re:RC != CRU
Here's NOAA's "adjustment" graph: graph.
Compare and contrast to UEA's "Adjustment" graph.
The diff on these two graphs is negligible. These two graphs constitute the entire alarm about AGW. Without these adjustments the source data is level noise whether you read it forward or backward, or substitute for it any random noise of your choosing.
These adjustment graphs have serious credibility issues involving the determinism of increasing error.
It's neither flamebait nor trolling to insist that these adjustments be explained before we scuttle the entire world economy to manually adjust the global ecosystem to fit a model that corrects problems found only in these "adjustments" of uncertain provenance.
-
Not a chance. Not just one university.
Here's a nice graph of the NOAA's "adjustments". If you subtract these "adjustments" (their term, not mine) from every OMG Global Warming Will Kill Us ALL graph you've ever seen, you get noise. It doesn't matter whether you add the noise back in forward or backward, or substitute it with properly scaled level data from your favorite MP3: the result is the same alarming graph. But if you reverse the timeline on this "adjustment" and feed in your favorite source of noise you get a chart that looks like a precipitous drop in temperature in 1900-1909 that levelled off. Why did they make these adjustments? Was it because their raw data didn't agree with someone else's observations? I find it difficult to believe that NOAA's measurements became increasingly inaccurate over time with a determinable bias and that at the precise moment their instruments became reliable, the temperature increases stopped. That doesn't jive with my understanding of modern technology and error measurement, nor with my understanding of thermodynamics.
In short since the adjustments are the cause for alarm it would be best if they were examined closely. Most especially since several of the presumably credible sources use such similar "adjustments". The cause for alarm does not appear to be in the raw data. If you know of some credible source of uncooked raw data that does show this cause for alarm continuing to the present day (not ending in 1999), I'd love to see it. Be careful though - adding in these "adjustments" and throwing away the raw data appears to be the order of the day. If that raw data isn't out there, this is just the most amazing piece of pseudo-scientific groupthink I've ever seen.
The story now is that they've only lost 5% of the data, and the rest is good - trust us. This situation is fluid and there will be much more back-and-forth before the truth is finally heard. With the basic facts this dynamic, now is not the time to take bold action on questionable information.
-
Found it - with links
Ah, there it is. ESR is a respected member of the community and I'll take his word for it absent definitive proof.
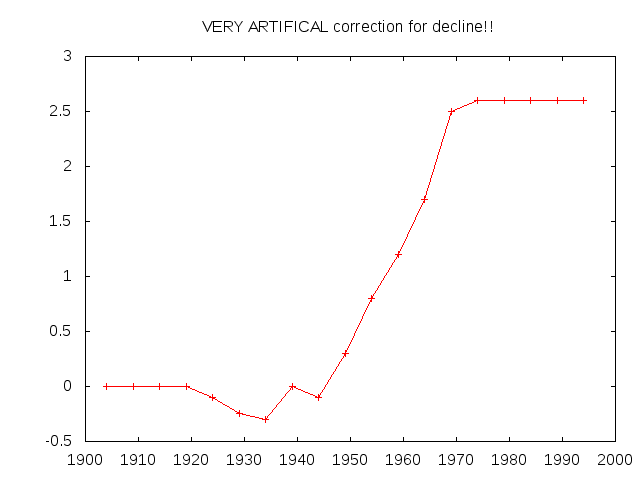
You can quite clearly see the "fudge factor" (actual code comment) where it was calculated to produce the desired result. Presumably this factor was computed, then munged into the raw data and the code commented out. Here you can see the hockey stick being built in the factory.
There are nice graphs where the "no trend" raw data is added to "a VERY ARTIFICAL correction for decline!!" to create the results graph we have all seen that has no relation to the raw data but does show what would be an alarming trend if it were not for the fact that it's entirely made up. Since you clearly won't believe me, here's The NOAA's own fudge-factor chart by dataset and in total. They're from this page, and here's an official quote on that page from the NOAA:
The cumulative effect of all adjustments is approximately a one-half degree Fahrenheit warming in the annual time series over a 50-year period from the 1940's until the last decade of the century.
Here's another nice link. Enjoy.
This is not science, to my understanding of that symbol.
-
Found it - with links
Ah, there it is. ESR is a respected member of the community and I'll take his word for it absent definitive proof.
You can quite clearly see the "fudge factor" (actual code comment) where it was calculated to produce the desired result. Presumably this factor was computed, then munged into the raw data and the code commented out. Here you can see the hockey stick being built in the factory.
There are nice graphs where the "no trend" raw data is added to "a VERY ARTIFICAL correction for decline!!" to create the results graph we have all seen that has no relation to the raw data but does show what would be an alarming trend if it were not for the fact that it's entirely made up. Since you clearly won't believe me, here's The NOAA's own fudge-factor chart by dataset and in total. They're from this page, and here's an official quote on that page from the NOAA:
The cumulative effect of all adjustments is approximately a one-half degree Fahrenheit warming in the annual time series over a 50-year period from the 1940's until the last decade of the century.
Here's another nice link. Enjoy.
This is not science, to my understanding of that symbol.
-
Re:Why are people getting so worked up
Kilimanjaro has been retreating since the 1800s.
C02 in the atmosphere has only been shooting up since the 1950s. Pre-industrial C02 levels were about 2.8 parts per 10 000. As opposed to 4 or so now.
If these things pre-date C02's big increase this indicates a large role for natural climate variations.
This is what many skeptic say.
-
Re:Great...
>>>How do you know any of what you say is true if can't see or trust the raw data?
This is a false argument. How can you ever be sure about the integrity of anything unless you are the one doing it? How can you trust the raw data if you are not collecting it? How can you trust the analysis if you are not the one analyzing it? How can you trust the satellite data if you didn't build the satellite?
So you would rather that we just take the scientists at their word that their findings are 100% accurate? Is that what you are suggesting?
And are you saying that this is the way science ought to function?
There are well known methods of determining if the sensors are completely off. We have temperature data from satellites as well as from ground stations. Also, there are ways of determining if the data returned by the sensors is wrong - that can happen if the sensor malfunctions.
Go here for the data. Please read up the documentation on how specific rows are flagged as possibly incorrect data.
http://www.ncdc.noaa.gov/oa/climate/ghcn-monthly/index.phpPlease don't pass off your "belief" as science and don't expect the rest of the world to have "faith" in your beloved scientists. The "Mad dog" behaviour that you are pointing out isn't coming from the sceptics right now but rather from your friends at CRU.
Also, while you are at it - please read up on this as well to determine how the so-called scientists at CRU were dealing with FOI requests.
http://omniclimate.wordpress.com/2009/11/24/willis-vs-the-cru-a-history-of-foi-evasion/ -
Re:But it goes beyond the computer models.
I've already discussed this issue:
Surfacestations.org is saying that the surface temperature record is contaminated by the "urban heat island" effect-- that temperatures are only rising around cities because of economic growth. One example he shows is that exhaust vents have been placed closer and closer to the sensors over the years.
This is a superficially compelling argument, but it's also one that scientists have considered and rejected. One test is that the urban heat island effect should be less pronounced on windy days than calm days. That's because if this warming is just caused by local exhaust vents, wind should carry that heat away whereas calm weather won't. This doesn't happen: calm and windy days have the same warming trend. This conclusion is from an article published in Nature by Dr. Parker in 2004; here's a BBC article quoting it. Other studies have confirmed this result using different methods and data in 2003, 2006, and 2008.
NOAA recently published an answer to that specific website. They took the 70 stations that surfacestations.org designated "best" or "good" and created a time series based on them. Then they used all 1218 stations to create another time series. Both of those time series are plotted on page 3. They're practically identical.
Also, scientists don't have to blindly trust these sensors because surface temperature measurements are also confirmed by satellite measurements and proxies such as ice cores, boreholes, coral growth, tree rings, stalactites, fossil beds, ocean sediments and glacial deposits.
-
Re:But it goes beyond the computer models.
Since you can't be bothered to look, here is some reading material:
Scientific study on NOAA instrumentation in response to the linked article.
The "credentials" of the author of that book and the website you linked to.
Look, as a scientist, I'm all for ripping the shit out of bad science. That's how scientists make a name for themselves. That's also why I trust scientists to get it right. Stop posting shit from some random yahoo like it's gospel. There are plenty of serious, peer reviewed publications to choose from. Pick something with some sort of legitimacy to argue. -
Re:Only pedantic comments here
I am not afraid of another terrorist attack.
Why?
It is 100X more likely to die from smoking
http://thescooponsmoking.org/xhtml/faq.phpIt is 10X more likely to die in a car accident
http://www.washingtonpost.com/wp-dyn/content/article/2006/08/22/AR2006082201152.htmlAnd 9/11 was a single event. There others happen every year.
By the way, about 500 people a year are hit by lightening
http://www.nssl.noaa.gov/users/holle/public_html/phx6.htmlI'm not worried about that either
-
Re:Falsibility.
You do realize that a comparison of the record from the 70 weather stations that surfacestations.org marked good or best to the complete weather station network record revealed the urban heat island effect has little or no effect on the measurements. Read about the study here (PDF).
When you're measuring trends it doesn't matter so much what the absolute temperature is but how it's changing over time.
-
Re:Wake me when a prediction comes true
The models were coded using assumptions, and we are talking about a chaotic system that is difficult to predict 7 days in advance let alone 70 years. In fact many of these models are based on models of ocean currents recently shown to be wrong. Not that anyone seems to care.
Then, of course, is the question of other factors that might be understated. Solar activity increased in the past 50 years too, but now we have had 18 months and that activity has vanished. Temperatures have historically increased and decreased with the increase and decrease of solar activity. It is an accepted factor in global warming, but looking at Mars and Jupiter it is strange how much extraterrestrial climate change is happening at exactly the same time. Maybe they have underestimated the Sun's importance.
My problem is this: "Climate change" is no longer a real science. The one thing that the hacked emails proved is that Climate Change has become far too political to be called a science. You don't need stolen emails to prove that proponents of the current climate change theory are doing what they can to stifle debate. When the debate is gone, there is no science.
I am willing to admit when I am wrong, but it is not time for that yet. Solar activity may be approaching a minimum, and if it does, it will prove me right or wrong. But I am sure-- damned sure --that if global temperatures fall with the solar activity, a good many of the current scientists echoing the conventional wisdom will adjust their models to prove that they were right all along.
-
Re:re Increase or decline?
"why is it that so many people are so eager to believe global warming skeptics? Methinks it is because they do not want to believe that something as innocent as driving a car could be a problem."
Because when you've just had the third coldest October in 115 years of organized records -- 4 degrees below average -- as part of a year which so far is ranking 43rd in that 115, the thermometers are looking pretty darn skeptical?
http://www.ncdc.noaa.gov/sotc/?report=national&year=2009&month=10&submitted=Get+Report
-
Re:Scepticism is universal
You don't find it a tad bit odd that a decade of cooling
A decade of cooling? Whichever decade that is, it's certainly not the 2000s!
The decadal trend is pretty much flat, perhaps slightly upwards but at a very slight rate of change overall.
ftp://ftp.ncdc.noaa.gov/pub/data/anomalies/monthly.land_ocean.90S.90N.df_1901-2000mean.dat NOAA has all the data if you fancy plotting it youself.
It's actually vaguely worrying. The lack of solar activity (the recent boost won't do anything yet) and the flip to a generally negative PDO and the La Nina in recent years should all, on paper at least, have resulted in a strong cooling effect. Yet if we've only levelled off, it makes me wonder what happens when things inevitably flip back to a pattern that encourages warmth!