 Slashdot Mirror
Domain: palo-alto.ca.us
Stories and comments across the archive that link to palo-alto.ca.us.
Comments · 18
-
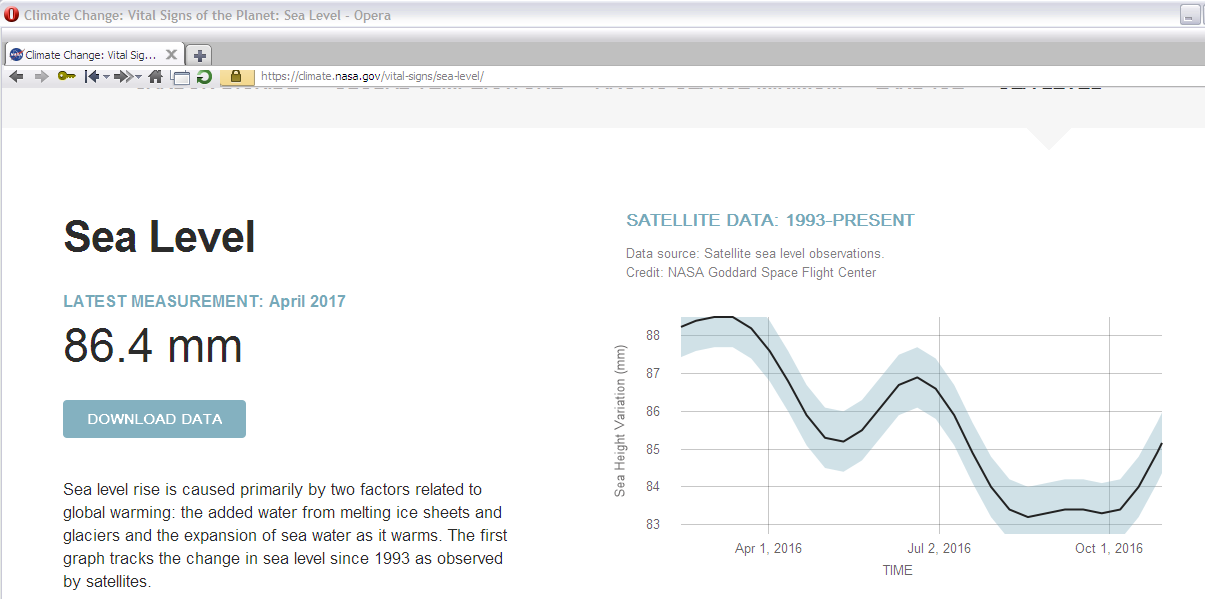
Why doesn't this ice loss show up on a graph?
http://rs79.vrx.palo-alto.ca.u...
Huh? Why? Where is it?
-
It's not just that
Why are so many people trying to ban Neonics?
Look up when the patent expires on them: 2019.
What if I told you they have not been found to cause colony collapse disorder (CCD) but antifungals are that also take out the immune system leaving to the host prone to infection it could normally fend off.
It's not just the bees, this is happening to amphibians, bats, coral and in some cases man. Next time somebody tells you a gas or heat is killing corals... go look up the necropsy. No it is not, it's the damn antifungals.
http://www.plosone.org/article...
https://qz.com/107970/scientis...
http://rs79.vrx.palo-alto.ca.u...
http://www.gbr.qld.gov.au/docu... (July 2016)
http://www.gbr.qld.gov.au/docu... (May 2016)Compare this with Cuba.
-
Re:Oh boy, so much fail in one post.
So you don't dispute sea rise has been negative for about six years?
That's a start I guess.
The rest of your argument pretty much doesn't matter after that now does it? You haven't found fault with either the data or the logic here, and merely sought clarification of one part you don't understand.
So in case you don't resistant quite what what you're looking at, here goes.
Because nominal sea was was unchanged for about 8000 years, never went up, that was an error, and six years ago flipped when ice began growing again.
Perhaps I explained that badly in my post. Please allow me to try again.
If you look at the longer term map you can see the sea rise for the past 8000 years was pretty constant. Then, six years ago it began falling. I did not try to make a graph like that with only six years but if you were t try the tool at nasa to get just the last 10 years it gives you this, at least it did with my browser, why don't you try it?
Now, there were spurious reports of "sea rise" in Miami but not, only 50 miles away, in the Florida Keys it was not rising. This was found out to be because Miami was sinking, as was Beijing, by about four inches a year because the silly fucks pumped all the groundwater out. You know how nature abhors a vacuum.
Here's the long history of sea rise:
http://rs79.vrx.palo-alto.ca.u...
Look around 8000 years back. See that? That's the 33,3 century nominal sea rise.That stopped a few years ago.
Now, if you look at the same time period in the NSIDC graph is ice, you'll see there's a corresponding uptick in sea ice:
http://rs79.vrx.palo-alto.ca.u...Ok? So uptick in ice, seas fall. Got that now?
Nore that carbon dioxide also flarlines 6 years ago.Here's the stuff on the error in sea rise measurement in Miami:
Here's a picture of it:
http://geologylearn.blogspot.c...
Here's thr article in Nature about Florida.
http://www.nature.com/news/sou...
Here's the article about Beijing.
http://www.theweek.co.uk/73907...Here's the Co2 flatline stuff:
2015 CO2 has flatlined.
13 March 2015 Data from the International Energy Agency (IEA) indicate that global emissions of carbon dioxide from the energy sector stalled in 2014, marking the first time in 40 years in which there was a halt or reduction in emissions of the greenhouse gas that was not tied to an economic downturn.
http://www.iea.org/newsroomand...2016 CO2 flatlined for a second year in a row.
"The IEA reports that for the second year in a row, the world economy has grown while energy-related CO2 emissionsremained flat."
http://thinkprogress.org/clima...2017 CO2 emissions remain flat for a third year.
IEA finds CO2 emissions flat for third straight year even as global economy grew in 2016 17 March 2017.
https://www.iea.org/newsroom/n...MIT Technology Review also reported the fact CO2 stopped rising as well.
https://www.iea.org/newsroom/n...It doesn't matter what you "believe". The facts are, seas a falling, ice is growing and coe
-
Oh boy, so much fail in one post.
I call bullshit.
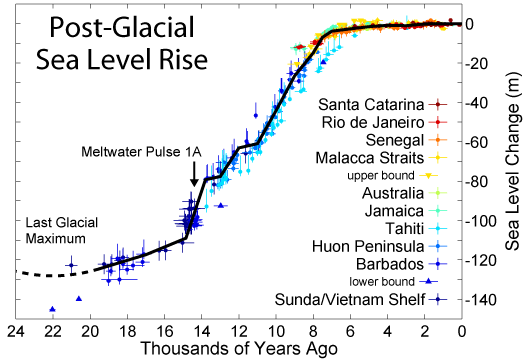
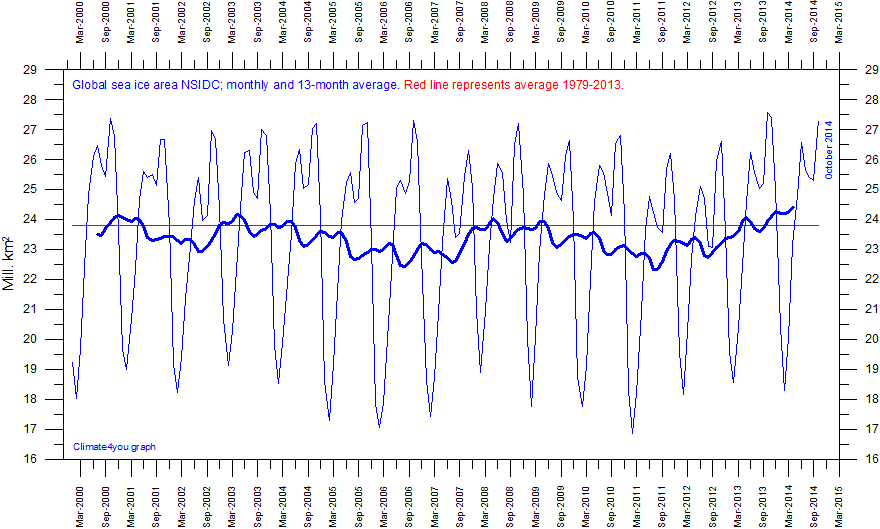
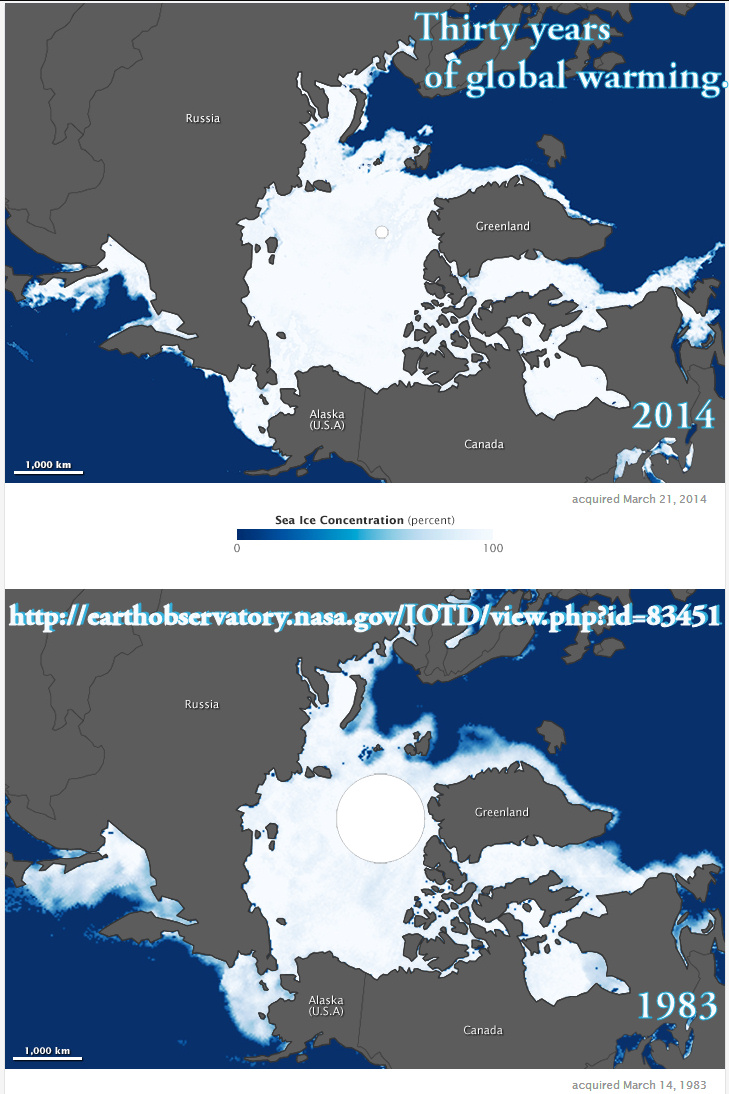
Ice is up, not down at both poles, while the Arctic goes up and down a but the Antarctic only increases much to the amazement of the the alarmists. Total sea ice has never gone down and is increasing presently to the point the seas are falling while the media claims or sometimes hints they're rising. Sea level was actually never rising abnormally, it's been 33,3cm/century for about 15,000 years. The gasses are methane and food for the microflora of the new tundra. We are coming out of an ice age and of course you can find thawing bits, it's just that there's more freezing bits than thawing bits by a large margin.
Sea ice.
Screenshot of the US National Snow and Ice Data Center graph of aggregate sea ice.
http://rs79.vrx.palo-alto.ca.u...South Sea Ice.
http://rs79.vrx.palo-alto.ca.u...So, the claims the "ice could be gone as early as 2015" (Gore 2009) are utterly specious; this really devalues the Nobel prize in my mind or his half of it anyway which is when he said this.
Anyway, the ice melt doesn't show up any graph. So let's look at the sat imagery NASA has at the pole.
http://rs79.vrx.palo-alto.ca.u...
Ok so it doesn't show up in NASA sat imagery either. What about maps?
Isn't it cool how you can get the story from a piece of the url? "arctic-sea-ice-gains-can-be-seen-on-new-government-map-of-canada"Anyway, Canada added ice to the marine navigation maps. The US doesn't have much arctic, Greenland has more I suspect, the rest Canada and Russia have. The Russians added ice to their maps too.
http://www.cbc.ca/news/technol...
So I dunno about this "melt" it doesn't show up maps, test instruments or sat imagery.
As I said, the sea levels are falling not rising if you believe NASA.
http://rs79.vrx.palo-alto.ca.u...Looks like sea level was pretty constant for th last 8000 years. Now seas have been falling for about 6 years. If they were supposed to rise abnormally I can't see where.
http://rs79.vrx.palo-alto.ca.u...
Here's the article in Nature from a few years ago. They figured if all this methane was coming up there would be an increase in carbon in the soil but there wasn't and they wrote up why they found out why: it's food for the emergent fora and fungi. Which makes sense, the plans and carbon all frozen together, why WOULD you have one wuthoutthe other. You freaky, nature.
"Fungi pull carbon into northern forest soils Organisms living on tree roots do lion’s share of sequestering carbon
"But scientists have not understood where exactly trees put their carbon. The issue becomes important when researchers build computer simulations that track carbon cycling."
https://www.sciencenews.org/ar..."Small 'hot spot' responsible for producing the largest concentration of the greenhouse gas methane seen over the United States"
"Nasa set to investigate unexplained hotspot over the 'four corners' intersection in Southwest
Small 'hot spot' responsible for producing the largest concentration of the greenhouse gas methane seen over the United States
Area near the Four Corners intersection of Arizona, Colorado, New Mexico and Utah covers 2,500 square miles
Hotspot predates widespread fracking in the area " -
Oh boy, so much fail in one post.
I call bullshit.
Ice is up, not down at both poles, while the Arctic goes up and down a but the Antarctic only increases much to the amazement of the the alarmists. Total sea ice has never gone down and is increasing presently to the point the seas are falling while the media claims or sometimes hints they're rising. Sea level was actually never rising abnormally, it's been 33,3cm/century for about 15,000 years. The gasses are methane and food for the microflora of the new tundra. We are coming out of an ice age and of course you can find thawing bits, it's just that there's more freezing bits than thawing bits by a large margin.
Sea ice.
Screenshot of the US National Snow and Ice Data Center graph of aggregate sea ice.
http://rs79.vrx.palo-alto.ca.u...South Sea Ice.
http://rs79.vrx.palo-alto.ca.u...So, the claims the "ice could be gone as early as 2015" (Gore 2009) are utterly specious; this really devalues the Nobel prize in my mind or his half of it anyway which is when he said this.
Anyway, the ice melt doesn't show up any graph. So let's look at the sat imagery NASA has at the pole.
http://rs79.vrx.palo-alto.ca.u...
Ok so it doesn't show up in NASA sat imagery either. What about maps?
Isn't it cool how you can get the story from a piece of the url? "arctic-sea-ice-gains-can-be-seen-on-new-government-map-of-canada"Anyway, Canada added ice to the marine navigation maps. The US doesn't have much arctic, Greenland has more I suspect, the rest Canada and Russia have. The Russians added ice to their maps too.
http://www.cbc.ca/news/technol...
So I dunno about this "melt" it doesn't show up maps, test instruments or sat imagery.
As I said, the sea levels are falling not rising if you believe NASA.
http://rs79.vrx.palo-alto.ca.u...Looks like sea level was pretty constant for th last 8000 years. Now seas have been falling for about 6 years. If they were supposed to rise abnormally I can't see where.
http://rs79.vrx.palo-alto.ca.u...
Here's the article in Nature from a few years ago. They figured if all this methane was coming up there would be an increase in carbon in the soil but there wasn't and they wrote up why they found out why: it's food for the emergent fora and fungi. Which makes sense, the plans and carbon all frozen together, why WOULD you have one wuthoutthe other. You freaky, nature.
"Fungi pull carbon into northern forest soils Organisms living on tree roots do lion’s share of sequestering carbon
"But scientists have not understood where exactly trees put their carbon. The issue becomes important when researchers build computer simulations that track carbon cycling."
https://www.sciencenews.org/ar..."Small 'hot spot' responsible for producing the largest concentration of the greenhouse gas methane seen over the United States"
"Nasa set to investigate unexplained hotspot over the 'four corners' intersection in Southwest
Small 'hot spot' responsible for producing the largest concentration of the greenhouse gas methane seen over the United States
Area near the Four Corners intersection of Arizona, Colorado, New Mexico and Utah covers 2,500 square miles
Hotspot predates widespread fracking in the area " -
Re:As a graduate of Addison Elementary..
Ah! Correction, the link to the Addison Elementary Parent Teacher Association should've been http://www.addison.palo-alto.ca.us/. My mistake.
-
The paranoia page
I was just thinking yesterday of doing a paranoia web page, aggregating warnings from various sources.
- US DHS terrorism threat level. ("Code Yellow, or Elevated." today.)
- DoD InfoCon threat level. ("INFOCON level 4, "Increased Vigilance in Preparation for Operations or Exercises." today.)
- California Office of Emergency Services warnings ("...FLASH FLOOD WATCH IN EFFECT FROM TUESDAY MORNING THROUGH LATE TUESDAY NIGHT FOR THE NORTHERN AND CENTRAL PORTIONS OF THE SAN FRANCISCO BAY AREA..." yesterday.)
- California Earthquake Monitor Not much happening today.
- NOAA Tropical Storm Prediction Center. Slow day, not hurricane season.
- California Independent System Operator power grid status. Warns of power shortages and incipient blackouts. No problems today.
- Our local threat monitor, the Palo Alto Creek Level Monitor. Water level low right now.
A web page with a good-looking version of this info, suitable for display on large screen displays, would be useful.
-
Re:How are narrow-angle traffic-signals done?
These lights use a Fresnel Lens to direct the light from the bulb or LED cluster to only the lane for which it is intended.
wikipedia link -
Consider yourself facilitated
"PAUSD Technology Training"
"The Information Services/Technology Department supports teaching and learning by facilitating communication and productivity. IST keeps the computers and other technology used by students, teachers, administration, and support staff up and running; maintains the student information (SASIxp) and Human Resources systems; and monitors the network infrastructure."
I'd say they got the part about 'facilitating communcation' right, at least
Expect SASIxp to be gelded soon, if not already...ouch! -
A Demonstration of How It's Done
In Stockholm, Sweden, the city ran fibre everywhere in rings around the city, and then set up Stokab A/B to run the infrastructure, and sell access to it on a non-discriminatory basis. It is important to note that this is in no way related to the Swedish telephone company, Telia which can buy transit across this fibre, but also has to compete with other telecomm companies that use this fibre.
That's how it is supposed to be done: a separate, disinterested company running and selling acess to the infrastructure, with service companies competing with each other on top of that.
The frustrating thing for me is watching the City of Palo Alto, California (a neighboring city), which also has a fibre infrastructure, but they keep arguing over what to do with it, and thus do nothing!
-
Fiber to the home in Palo Alto (Somewhat OT)
I've been day-dreaming about bandwidth ever since I received a letter from the city of Palo Alto that I could participate in a trail, called Fiber To The Home.
Can you imagine receiving a letter which says you can get a 100Mbit/sec Fiber link straight to your house for $190,-?
You can read more about it here: http://www.city.palo-alto.ca.us/u til ities/fth/
However unfortunately my area was not selected for the trail, and the project seems to be delayed (what a surprise). -
You think Pac*Bell is bad? Well, lemme tell ya...
I hate to break it to you, but Pac*Bell is the best of the RBOC's (the baby bells), nationwide, according to my friends who run national ISPs. Be glad you don't live in NYNEX or GTE territory.
The real problem is that legacy telephone companies are so invested in voice telephony and circuit switching that packet switching is a mystery to them. They Don't "Get It." They can generally be trusted to run wires or give you a point-to-point bit-pipe (i.e. a dedicated leased line), but never ask them for a switched data service (e.g. frame relay, ATM, SMDS) because they'll always fuck it up. ISDN is a borderline case, because it looks and smells like voice to them, but it has never been tariffed (priced) correctly: ISDN calls should have the same price as voice calls.
There was an article in Wired a while ago called, The NetHeads versus The BellHeads which described some of this cluelessness, and how Internet companies are eating the RBOCs and other LECs alive.
If you're looking for xDSL service, best to go with one of the Competitive LECs, e.g. Covad, or NorthPoint, because it's a lead-pipe cinch that your RBOC will hose up the Internet part of xDSL, even if they get the basic bit-pipe right.
The City of Stockholm, Sweden got it right - they laid down dark fibre all over the city, and then set up a city-owned corporation to lease it out to all comers. This makes it easy to get really high speed data service at low prices. Right on the edge of the Silicon Valley, the City of Palo Alto, California has the same opportunity (i.e. they've laid down the dark fibre) but they're hesitating to actually use it! (idiots)