 Slashdot Mirror
Domain: remss.com
Stories and comments across the archive that link to remss.com.
Comments · 22
-
Re:Deniers?
It is hardly a secret. If you don't know something, then you should not hesitate to ask. That is always a better option than being obnoxious. (you catch more flies with honey than with vinegar don'tcha know.) A quick look at woodfortrees can verify: Look at the divergence at about the year 2000. Look at the difference in the trends: http://woodfortrees.org/plot/r...
Here is Carl Mears who developed the RSS Satellite reconstruction: "...surface temperature datasets, which I consider to be more reliable than satellite datasets (they certainly agree with each other better than the various satellite datasets do!)." - http://www.remss.com/blog/rece...
The guy who developed one of the two satellite reconstructions says that the surface station record is more reliable. So no, we shouldn't disregard the surface station data in favour of the satellite data. The satellite records do not agree with the raw surface station data as the GGP had asserted (but the corrected surface station records DO), in fact, the satellite data do not even agree with each other.
-
Re:NASA ignoring satellite measurements...
That's amazing! Especially, given the complete lack of correlation with the satellite datasets:
The satellite datasets directly integrate temperature over almost the entire globe, with no interpolation and no revisionist "adjustments".
Bwahaha, that's a good one. First of all, they don't even measure temperature.
-
Re:Climate has never not been changing.
People who believe that satellite data is the gold standard for temperatures don't understand all the manipulations and adjustments required to produce a temperature from the microwave emissions of O2 molecules in the atmosphere. They require far more adjustments then surface temperature measurements with thermometers. Even one of the principle scientists for RSS, Carl Mears says he trusts the surface temperature records more than the satellite records.
A similar, but stronger case can be made using surface temperature datasets, which I consider to be more reliable than satellite datasets (they certainly agree with each other better than the various satellite datasets do!). Link
-
Re:NASA ignoring satellite measurements...
That's amazing! Especially, given the complete lack of correlation with the satellite datasets:
The satellite datasets directly integrate temperature over almost the entire globe, with no interpolation and no revisionist "adjustments". They use laboratory grade instruments, and are frequently calibrated against balloon soundings. And no, there is nothing magic as far as detecting temperature trends gained by measuring at ground level only.
It's beyond ironic that NASA is trumpeting ground-based measurements while ignoring better data gathered from space.
And the first satelite was launched when?
Ohhh certainly not in the late 1800's.
Certainly. However, since the last adjustments, the surface datasets of record have been diverging from the satellite measurements:
The Diverging Surface Thermometer and Satellite Temperature Records
The Diverging Surface Thermometer and Satellite Temperature Records AgainInteresting that this is taking place going into another big climate conference complete with demands for "climate justice", and also while we're on the eve of a solar Grand Minimum...
A quote from that last linked article:
Scientists at the Climate and Environmental Physics and Oeschger Centre for Climate Change Research at the University of Berne in Switzerland have recently backed up theories that support the sun's importance in determining the climate on Earth. A paper published last year by the American Meteorological Society contradicts claims by IPCC scientists that the sun couldn't be responsible for major shifts in climate. Judith Curry, chair of the School of Earth and Atmospheric Sciences at the Georgia Institute of Technology, rejected IPCC assertions that solar variations don't matter. Among the many studies and authorities she cited was the National Research Council's recent report "The Effects of Solar Variability on Earth's Climate".
Other researchers and organisations are also predicting global cooling - the Russian Academy of Science, the Astronomical Institute of the Slovak Academy of Scientists, the Institute of Terrestrial Magnetism Russia, Victor Manuel Velesco Herrera at the National University of Mexico, the Bulgarian Institute of Astronomy, Dr Tim Patterson at Carleton University in Canada, Drs Lin Zhen at Nanjing University in China, just to name a few.
-
Re:NASA ignoring satellite measurements...
That's amazing! Especially, given the complete lack of correlation with the satellite datasets:
The satellite datasets directly integrate temperature over almost the entire globe, with no interpolation and no revisionist "adjustments". They use laboratory grade instruments, and are frequently calibrated against balloon soundings. And no, there is nothing magic as far as detecting temperature trends gained by measuring at ground level only.
It's beyond ironic that NASA is trumpeting ground-based measurements while ignoring better data gathered from space.
And the first satelite was launched when?
Ohhh certainly not in the late 1800's.
-
NASA ignoring satellite measurements...
That's amazing! Especially, given the complete lack of correlation with the satellite datasets:
The satellite datasets directly integrate temperature over almost the entire globe, with no interpolation and no revisionist "adjustments". They use laboratory grade instruments, and are frequently calibrated against balloon soundings. And no, there is nothing magic as far as detecting temperature trends gained by measuring at ground level only.
It's beyond ironic that NASA is trumpeting ground-based measurements while ignoring better data gathered from space.
-
Re: there is no
For chrissake, step out of the basement and READ.
I went one better than that - I actually looked at the data. Global satellite-based microwave sounding measurements, which provide an unbiased measurement of the temperature of the atmosphere, show a clear long-term warming trend, but almost all of the increase is in the first half of the epoch since measurements began in 1979. (I actually downloaded the raw data to play around with it, but you can do the basics with their online tool.)
The news story you linked is about this paper in Science. It involves reanalysis of surface temperature measurements, which provide a more complete, but more biased, temperature record. (The biases arise because of the distribution of the temperature-measuring stations, changes in the way ships gather water samples that might cause them to receive engine heat before being measured, that sort of thing
Which researchers are right? That isn't clear. This is merely the most recent in a series of papers on the subject, and is unlikely to be definitive. Science (the magazine, not the process) is typically reserved for high-impact bleeding-edge results - but, as a result, it tends to have a higher-than-average retraction rate (of papers that later turn out to be incorrect). I'd wait for a matter like this to be hashed out in a more specialised journal, rather than latching onto the most widely-publicised result.
On a theoretical basis, we expect heat to get added to the system by the greenhouse effect, but there's room for uncertainty in exactly where it will go, and what mechanisms determine it. Apparently it isn't going into the atmosphere just recently; it may or may not be going into the surface layer; other researchers are looking into whether it's going into the deeper layers of the ocean.
Global warming has, unfortunately, become a political issue, with people - and media outlets - picking a side and promoting it to demonstrate their allegiance. That's a bad thing, even if their side is generally in the right: they refuse to concede on any nuance, because admitting to even the slightest uncertainty in their position means giving ground to the enemy. My impression, for what it's worth, as a scientist in a different field who's read a bit of the literature, is that there's a clear consensus that global warming is happening, but honest disagreement about its extent and consequences. A real climatologist would, I suspect, be somewhat embarrassed by the parent poster's confident declarations of certainty.
-
Re: Coral dies all the time
The records were showing a cooling trend until they were recalibrate
Please cite data that shows that.
even the corrected datasheets don't show warming if you look from 1998 to today
What was that you were saying about cherry-picking trends?
In any case, surface temperatures are only one symptom of climate change - and we know they're quite variable over decadal periods. Others, like ocean heat content, ice melt, and sea level rise, are still rising. And that table you cited looks to me like mostly negative anomalies in the 70s, and mostly positive anomalies in the current time - how is that not a warming trend? Perhaps a graph would make it clearer?
The sea rise is linear.
No, it isn't. The difference in trend from the first couple of decades to the last couple looks clearly visible to me, and Vermeer's graph of the derivative rate of change makes the accelerating sea rise crystal clear.
I think a large volcanic erruption might create such a rise...
The Mount Pinatubo eruption emitted 42 million tonnes of CO2. Human emissions in 1991 were 23 billion tonnes of CO2. Don't expect to see much of a blip.
The IPCC figure you're citing is 120 years... that seems obviously impossible
Why do you assume they're wrong, instead of assuming you're missing something?
As I said (and my citations tried to explain), it's not as simple as a fixed number. CO2 uptake depends on numerous processes, some of which are feedback loops. Some CO2 is re-absorbed quickly, some slowly, and some of it takes centuries to be removed from the atmosphere. That's why I mentioned the CO2 lifetime graphs - it's not a linear process.
But you only have to look at the rising atmospheric CO2 levels to see that, clearly, our CO2 emissions are currently exceeding the uptake.
I'm utterly indifferent to how many people agree with you.
It's got nothing to do with how many people agree with me. It's got everything to do with how many experts agree with each other.
you're skipping over my request for a longer trend line on pH values in the ocean.
Did you look at the graph page 4 of the presentation link I gave? Is 25 million years not long enough?
If you can find other data from 1900, please do feel free to cite it.
don't like having to validate your positions
Still waiting for you to validate yours. You've made a lot of claims, but cited very little data - and the data you've cited so far has contradicted your claims, not backed them.
-
Re: Coral dies all the time
The records were showing a cooling trend until they were recalibrate.
Some of the recalibration were obviously valid. Others are not as clear cut. For example, the orbital decay correction was entirely valid.
Regardless, even the corrected datasheets don't show warming if you look from 1998 to today
http://data.remss.com/msu/mont...The whole "pause" thing which is argued started in 1998 and what caused people to start looking for where the heat went. You're saying into the ocean... because it isn't in the air.
70.0 - 82.5 is the global table. The other columns address different regions.
As to sea level... from church:
http://static-content.springer...
From the EPA
http://www.epa.gov/climatechan...
the actual graph:
http://www.epa.gov/climatechan...Do you see the problem?
The sea rise is linear. Our rate of emissions have not been exponential. Explain how the CO2 even correlates with that when the trend lines don't match?
The rate of change in emissions should be reflected in the rate of change in the environment assuming these systems respond quickly to these changes.
What we're seeing is LINEAR changes to exponential inputs. That implies the two variables don't even correlate much less one being caused by the other.
Also sort of interesting is this data on on the CO2 concentrations:
http://co2now.org/images/stori...I find it interesting that basically was flat from 58-64... as you can see it ramps up going faster and faster towards the present.
Anyway, I'd like to see if we can get a single point emission of CO2... something large enough to be detectable globally for some period of time. I think a large volcanic erruption might create such a rise... and then I'd like to see how long it takes for the trend line to return to normal.
Your IPCC citation assumes 120 years. I don't understand how that is possible. We're emitting 1 percent of total atmospheric carbon every year and the rate of actual change in our environment is about 1/3rd of our emissions.
That implies that 2/3rds of our emissions are being taken out of the atmosphere and not re-emitted ANNUALLY. If 2/3rds of our emissions are being removed and not re-emitted annually... then what does that do to the life expectancy of emitted CO2?
The IPCC figure you're citing is 120 years... that seems obviously impossible. And your other figures you were cited were ranging from 100-30 years... which means we have range of 30 to 120 years just from your citations.
We're talking about the 6 foot tall man give or take 30 feet again. As to serious debate, you're in one right now to the extent that any such thing can happen on the internet. I'm not interested in your political references. Stop making them. I'm utterly indifferent to how many people agree with you.
As to your data on increases in carbon... I didn't say carbon wasn't increasing. I said that the rate of increase in the carbon doesn't match the increase in our emissions. If the time it stays in the atmosphere is 120 years as the IPCC says or around the 100 year range that wikipedia says... then we should see a closer match between emissions and atmospheric concentration. The discrepancy can only be explained by the biosphere sinking the carbon... possibly in the oceans if you like but still out of the air. And even the 30 year figure seems dubious to turn an exponential curve into a linear one.
As to Turley et al 2006, you're skipping over my request for a longer trend line on pH valu
-
Re:How do you know it would affect warming?
I keep seeing this argument, but no one ever tells me where they get the "no warming" from. It's just not true.
-
Satellite data shows at least some warming
Here's the RSS at 0.122K/decade:
-
Re:Stop trying to win this politically
As to 2014 being the warmest year on record, apparently that is in direct opposition to what the satellites say about it.
Yes, 2014 won't be the warmest in the satellites records but it's hyperbole to say it's in direct opposition to the surface records. The two are complimentary. They are two different approaches to Earthly temperatures. But satellites don't measure surface temperatures like thermometers do so they're not quite the same thing. Satellites measure temperatures in different zones of the atmosphere. The lower troposphere channel measures the atmosphere up to 4-5 km.
You shouldn't think satellite measurements are some pristine thing. Like the surface temperature measurements they have their issues that have to be dealt with. Satellites actually measure a proxy for temperature, the microwave emissions of oxygen molecules. Those are processed to produce a temperature with adjustments for sensor deterioration, orbital drift and decay, and every 10 years or so a new satellite replacing the old ones. A couple of those satellite replacements had little temporal overlap making inter-calibration difficult. Also, clouds and precipitation affect the satellite measurements.
In a blog on "The Recent Slowing in the Rise of Global Temperatures", Carl Mears of the RSS team said " A similar, but stronger case can be made using surface temperature datasets, which I consider to be more reliable than satellite datasets (they certainly agree with each other better than the various satellite datasets do!)."
A final thought on comparing satellite and surface temperature measurements, since they are all within the uncertainty ranges of each other I don't think it's scientifically possible to say they disagree with each other. Maybe RSS is outside of that range but it's also the obvious outlier among all of them. What's more likely, RSS is right or all of the others are right?
As to how any climate model is supposed to account for the data... you're just giving an argument for not being able to model the climate which means you can't make predictions.
That's why they call the model output projections instead of predictions. The projections are what would happen if the real world followed what the model had. That Shaping Tomorrows World article that you are apparently ignoring shows what happens when you cherry pick model runs that just happened to match the real world more closely. The output matches the real world better.
2014 is just another year in the long run picture but it is also a way to tweak people who's short term thinking leads them to thing the "pause" is significant.
As to the constant warming, I think there was a long pause in the 70s and the 80s didn't go up much. The big jump was in the 90s and without that your numbers don't look as good.
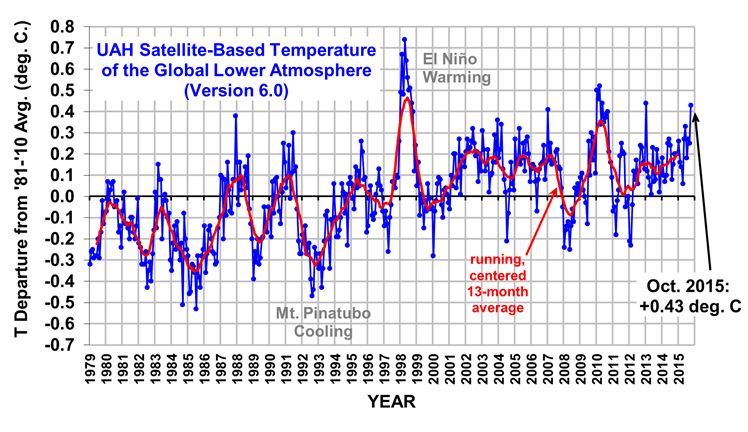
Here is the graph of Global Land-Ocean Temperature Index from 1880 to 2013. 1964 was the coldest year since 1933 (although 1950 and 1556 came close). The only year after that that even comes close is 1976. Since then there have been occasional pauses but the long term trend is warming. In the 1980's there was a drop in temperatures after the eruption of El Chichon in 1982 and in the 1990's a drop after the eruption of Pinatubo in 1991 and the models do rather well in modeling that drop in temperature after a major eruption. I think it's a reasonable statement to say it's been warming since the 1960s.
Keep in mind, they're trying to boil temperature differences of a tenth to a hundred of a degree over the whole surface of the planet over at least a year. That is a LOT of averaging. And they don't average the numbers together the same way every year.
Whenever someone brings precision up I point out baseball batting avera
-
Re:My mama told me, you better shop around.
Satellites are also ground truthed via independent radiosonde data collected throughout the air column.
-
Re: Obviously.
Remote Sensing Systems (which uses satellite data) shows that there's been 0.123K of warming per decade since 1980.
-
Re:Nostradamus
Yup. RSS is the minority report. BP is to disregard the minority report in favour of the corroborating reports, not pick the report that best supports your position. Even the RSS team has concerns about their data set. Here are GISTEMP,CRU,UAH, and RSS compared. http://woodfortrees.org/plot/g...
-
Re:How do you solve a problem that doesn't exist?
Some temperature records are constantly adjusted in the past. Given that the history is constantly being revised - how do we know what the actual trends are?
The RSS data set is about the most accurate we have, given it has a constant reference background (deep space), and covers the entire globe equally with the same set of instruments, and has done so for the last 35 years. And that record shows no warming for nearly 18 years.
One scientist, Don Easterbrook got it right. His model - based upon the cycles of the oceans - appears to fit the current pause quite nicely as well as matches the past. Perhaps he's on to something, in that his model more accurately tracks historical records AND the current situation than the IPCC/CO2 driven models.
-
Re:What does it matter?
Look at the RSS Data. The satellite data fits the null hypothesis well enough. It's only with the "adjustments" to the land stations that you get pronounced warming over the past 100 years. (You can cherry pick your own data set for entertainment, but it's far less alarming than the BS land data in any case.)
But the interesting point isn't really is the Earth warming - certainly at some time scale it is. The interesting point isn't how much is human activity affecting this, vs the normal climate cycle (which I'm not believing anyone on till the models accurately predict divergence form the null hypothesis). The interesting question is do we want it warmer or colder. Funny how the left mostly lives on the coasts, where warming is more threatening (well, I'm in Seattle, and so I'm screwed either way - the glaciers were quite a bit south of here last time around IIRC).
On top of that you can't ignore the heat stored in the oceans and that hasn't slowed down at all.
Is that heat we can't measure, but must be stored in the oceans otherwise we'd be wrong?
-
Falsibility.
At least we now have some falsifiability in this.
IF the forecast temperature rise is 6C per century, then it is
http://www.remss.com/msu/msu_data_description.html#msu_decadal_trends
Unlike Hadley, RSS uses satellite data, is consistent, and is open. They DO report a current trend of
-
NoThe scare over global warming... carefully ignores the latest US satellite figures showing temperatures having fallen since 1998, declining in 2007 to a 1983 level. That's not true. For the latest satellite figures, see this figure (from the RSS/MSU data set). Surface temperatures are given in the first panel (channel TLT, lower troposphere).
Skeptics like to cherry pick the year 1998, because it had an exceptionally strong El Nino which raised global temperatures that year; compare to it, the following years don't look as warm. But if you look at the overall trend, the pre-1998 trend has largely continued post-1998. It certainly has not turned negative.
The whole "declining in 2007 to a 1983 level" means that there was some month in 2007 which was the same temperature as some month in 1983. What is relevant, however, is that the temperature trend was positive from 1999-2007.
Even Anthony Watts, the surface temperature skeptic, has contradicted the Telegraph's claims; he said, "On the TLT graph [note: he means the TLS graph], for the years 1998 to present, there appears to be a slight downward trend in lower stratospheric temperature [note: we don't live in the stratosphere; note also that greenhouse warming predicts stratospheric cooling along with tropospheric warming], and this is what I believe Christopher Booker is referencing in his article in the Telegraph. Note that there have been other downward trends in the nearly 30 year measurement history, but the overall trend in the TLT, TMT, and TTS channels has been positive, so a short downward trend doesn't necessarily prove anything." not to mention the newly revised figures for US surface temperatures showing that the 1930s had four of the 10 warmest years of the past century, with the hottest year of all being not 1998, as was previously claimed, but 1934 1998 and 1934 were a statistical tie both before and after the revised figures; the revision is not significant in that regard. We always knew that U.S. temperatures in the 1930s were comparable to the 1990s. This has nothing to do with global warming, however; globally, temperatures in the 1990s were significantly higher than the 1930s. As another poster said, it's become PC to tack on "global warming" to proposals in hopes of getting funding. Oh come on. If you think that you can sneak a shoddy proposal past a grant committee by tacking on an irrelevant reference to global warming, you're incredibly naive. -
NoThe scare over global warming... carefully ignores the latest US satellite figures showing temperatures having fallen since 1998, declining in 2007 to a 1983 level. That's not true. For the latest satellite figures, see this figure (from the RSS/MSU data set). Surface temperatures are given in the first panel (channel TLT, lower troposphere).
Skeptics like to cherry pick the year 1998, because it had an exceptionally strong El Nino which raised global temperatures that year; compare to it, the following years don't look as warm. But if you look at the overall trend, the pre-1998 trend has largely continued post-1998. It certainly has not turned negative.
The whole "declining in 2007 to a 1983 level" means that there was some month in 2007 which was the same temperature as some month in 1983. What is relevant, however, is that the temperature trend was positive from 1999-2007.
Even Anthony Watts, the surface temperature skeptic, has contradicted the Telegraph's claims; he said, "On the TLT graph [note: he means the TLS graph], for the years 1998 to present, there appears to be a slight downward trend in lower stratospheric temperature [note: we don't live in the stratosphere; note also that greenhouse warming predicts stratospheric cooling along with tropospheric warming], and this is what I believe Christopher Booker is referencing in his article in the Telegraph. Note that there have been other downward trends in the nearly 30 year measurement history, but the overall trend in the TLT, TMT, and TTS channels has been positive, so a short downward trend doesn't necessarily prove anything." not to mention the newly revised figures for US surface temperatures showing that the 1930s had four of the 10 warmest years of the past century, with the hottest year of all being not 1998, as was previously claimed, but 1934 1998 and 1934 were a statistical tie both before and after the revised figures; the revision is not significant in that regard. We always knew that U.S. temperatures in the 1930s were comparable to the 1990s. This has nothing to do with global warming, however; globally, temperatures in the 1990s were significantly higher than the 1930s. As another poster said, it's become PC to tack on "global warming" to proposals in hopes of getting funding. Oh come on. If you think that you can sneak a shoddy proposal past a grant committee by tacking on an irrelevant reference to global warming, you're incredibly naive.