 Slashdot Mirror
Domain: nasa.gov
Stories and comments across the archive that link to nasa.gov.
Comments · 16,365
-
Re:LMAO, more fake man made global warming news
Wrong. Wrong. Wrong. Wrong. Wrong. I was just looking over all your assertions, and they are almost 100% wrong. "They" are most of the world's scientists, not some shady organization backed by Al Gore. https://climate.nasa.gov/ https://europeanclimate.org/
-
Never read peer reviewed pubs
The first link was to a Goddard press conference.
The first link was this one. I said "That link I posted had a reference section with eight peer-reviewed publications; did you read them?".
Here, copied cut-and-past from that link, are those references listed in the link.
References
Budyko, M.I., 1969: The effect of solar radiation variations on the climate of the Earth, Tellus, 21, 611-619, doi:10.1111/j.2153-3490.1969.tb00466.x.
Callendar, G.S., 1938: The artificial production of carbon dioxide and its influence on temperature, Q. J. Roy. Meteorol. Soc., 64, 223-240, doi: 10.1002/qj.49706427503.
Hansen, J., D. Johnson, A. Lacis, S. Lebedeff, P. Lee, D. Rind, and G. Russell, 1981: Climate impact of increasing atmospheric carbon dioxide. Science, 213, 957-966, doi:10.1126/science.213.4511.957.
Hansen, J.E., and S. Lebedeff, 1987: Global trends of measured surface air temperature. J. Geophys. Res., 92, 13345-13372, doi:10.1029/JD092iD11p13345.
Hansen, J., R. Ruedy, M. Sato and R. Reynolds, 1996: Global surface air temperature in 1995: Return to pre-Pinatubo level. Geophys. Res. Lett. 23, 1665-1668.
Hansen, J., R. Ruedy, J. Glascoe, and M. Sato, 1999: GISS analysis of surface temperature change. J. Geophys. Res., 104, 30997-31022, doi:10.1029/1999JD900835.
Hansen, J.E., R. Ruedy, M. Sato, M. Imhoff, W. Lawrence, D. Easterling, T. Peterson, and T. Karl, 2001: A closer look at United States and global surface temperature change. J. Geophys. Res., 106, 23947-23963, doi:10.1029/2001JD000354.
Hansen, J., R. Ruedy, M. Sato, and K. Lo, 2010: Global surface temperature change. Rev. Geophys., 48, RG4004, doi:10.1029/2010RG000345.
Mitchell, J. M., 1961: Recent secular changes of global temperature, Ann. N.Y. Acad. Sci., 95, 235-250, doi:10.1111/j.1749-6632.1961.tb50036.x.You said you only read peer-reviewed papers. I told you that the link I had posted had a reference list of peer reviewed papers. So: read them.
The next four links were to the list of all publications that Goddard published in each of the last 4 years.
Yes, that's right. You wanted peer-reviewed papers, there's a list of several hundred.
The last link was to the Berkley site pointing to no papers because the link was to their home page.
You asked about climate science funded y government grants, so I posted a link to the BEST group, which is independently funded.
What you seem to be doing is coming up with any possible excuse to dismiss the science. First you dismiss science because you "only accept peer reviewed papers", but when I send links to peer reviewed papers you come up with other excuses. It's pretty clear that your only actual objective is to avoid actually learning anything about the science.
-
Only read peer reviewed pubs [Re:history is here]
As I said in a previous post, I only accept data presented in peer-reviewed papers.
Really. That link I posted had a reference section with eight peer-reviewed publications; did you read them? Did you even look at the link?
Even some NASA data has not been reviewed.
Really. Let's start with GISS: 2018: https://pubs.giss.nasa.gov/yea...
2017: https://pubs.giss.nasa.gov/yea...
2016: https://pubs.giss.nasa.gov/yea...
2015: https://pubs.giss.nasa.gov/yea...That's just four years.
I wonder also how many of these scientists are climatologists and of the climatologists what percentage are dependant on government grants.
So, you won't read papers about climate that are written by climatologists. You are working very hard to avoid reading any data at all, I see. So, you must like the data from the Berkeley Earth project, which is independent: http://berkeleyearth.org/
-
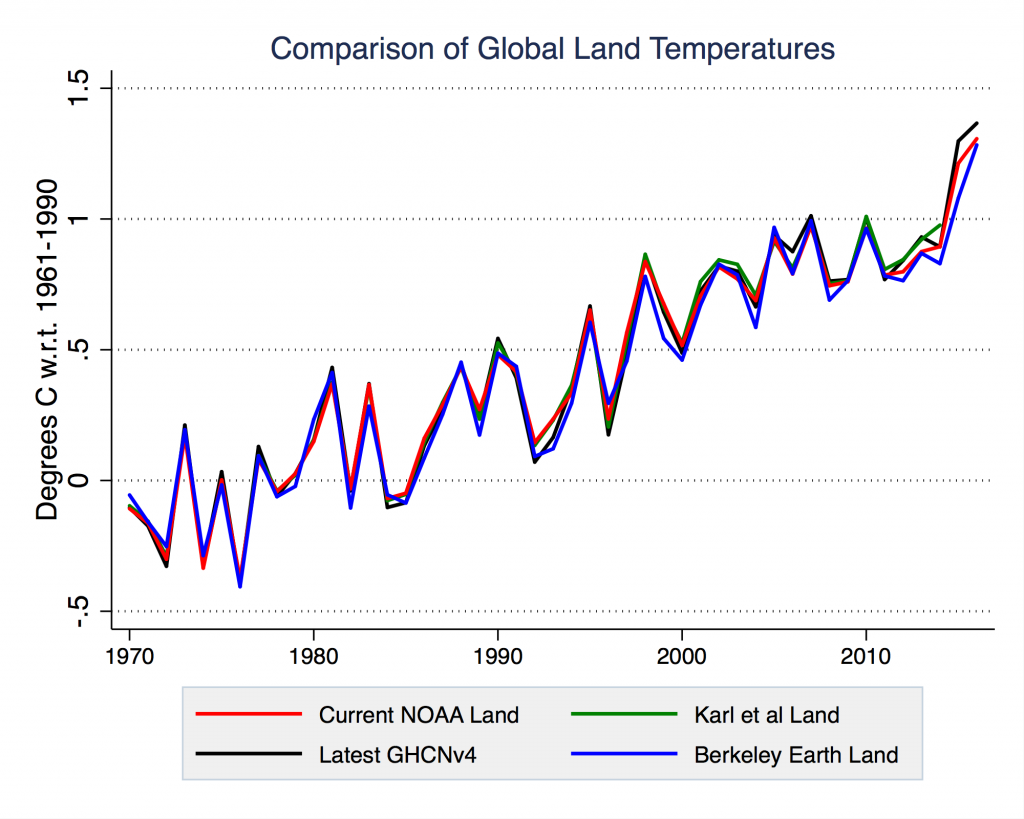
Re:Many different groups analyzing the data
How can it be taken seriously when they are constantly changing the historical temperature data to match their hypothesis?
"They" are not "changing the historical temperature data to match their hypothesis". That is a made-up alternate-fact being promulgated by the deniers.
You are referring, I assume to the Goddard Institute for Space Studies historical temperature record. The analysis of the data is exhaustively documented , including a FAQ giving an overview for popular audiences that are too bored to read the actual documentation. And the original data set, and all of previous historical analyses, are available on the web, showing that the changes in analysis technique don't alter the conclusion that the climate is warming. Here, for example, are the graphs showing the results of every different correction to the analysis, dating back to 1981.
In any case, you do know that several other groups, such at BEST, also analyze historical climate data, and come out with rates of warming that are essentially the same. So your conspiracy theory that scientists are altering their data in order to hoax the public is going to be a conspiracy of hundreds, and probably thousands, of scientists in independent groups on three different continents.
What about the climate gate emails, what do you think of those?
-
history is here
The GISS temperature history, with the graphs showing the results of every to their analysis dating back to 1981, is here.
-
Many different groups analyzing the data
How can it be taken seriously when they are constantly changing the historical temperature data to match their hypothesis?
"They" are not "changing the historical temperature data to match their hypothesis". That is a made-up alternate-fact being promulgated by the deniers.
You are referring, I assume to the Goddard Institute for Space Studies historical temperature record. The analysis of the data is exhaustively documented , including a FAQ giving an overview for popular audiences that are too bored to read the actual documentation. And the original data set, and all of previous historical analyses, are available on the web, showing that the changes in analysis technique don't alter the conclusion that the climate is warming. Here, for example, are the graphs showing the results of every different correction to the analysis, dating back to 1981.
In any case, you do know that several other groups, such at BEST, also analyze historical climate data, and come out with rates of warming that are essentially the same. So your conspiracy theory that scientists are altering their data in order to hoax the public is going to be a conspiracy of hundreds, and probably thousands, of scientists in independent groups on three different continents.
-
CO2 isn't the problem, it is the solution
First, CO2 is NOT a pollutant, it is plant food and it is fertilizing the greening of the earth:
https://www.nasa.gov/feature/g...
Most biologists will admit that if they haven't sold their soul for federally funded research grants.Second, it is the best and most economically and readily available energy source, even when it is recycled.
So, recycle it.
-
Re:TFA Is Hot Aie
Do you want some proof? I'll just copy a previous post I made and you can verify it yourself.
2015-2017 are the hottest years on record on Earth. Citation: https://public.wmo.int/en/medi... and multiple countries and weather stations confirmed this
2018 is looking to be #4, but we can't actually say that without actually going through the whole year obviously; but last April was the third warmest on record: https://climate.nasa.gov/news/...
The higher temperatures are affecting all crops, but their effects are most pronounced under Middle East and African Desert countries currently, but their effects should be closely examined to find ways to stop them in general. Citation: https://www.ncbi.nlm.nih.gov/p...
-
Re:Broadband Push by the Luminati
two words: "Geostationary orbit"
https://solarsystem.nasa.gov/b... -
Re:What a gigantic lie
I got some numbers for you to chew on.
2015-2017 are the hottest years on record on Earth. Citation: https://public.wmo.int/en/medi...
2018 is looking to be #4, but we can't actually say that without actually going through the whole year obviously; but last April was the third warmest on record: https://climate.nasa.gov/news/...
The higher temperatures are affecting all crops, but their effects are most pronounced under Middle East and African Desert countries currently, but their effects should be closely examined to find ways to stop them in general. Citation: https://www.ncbi.nlm.nih.gov/p...
-
Astronomy Picture of the Day
Lunar Eclipse over Rio: https://apod.nasa.gov/apod/ap1...
-
Re: Welp
Mars' atmosphere is being continuously stripped by solar wind too due to lack of magnetic fields.
-
Think about the distance
What's really cool is that this star passes about as close to a black hole as the Voyager probes are from Earth right now. Can you imaging what it would look like if it were that close to our own solar system? What effect would its mass have on our solar system?
https://voyager.jpl.nasa.gov/m... -
Re:Now they need to shame us into buying it
Well we know that global warming has a detrimental effect on the planet.
We also know that livestock contribute around 14% of emissions that cause global warming
Reducing live stock consumption would therefore reduce climate change.
Individuals cannot be trusted to do the right thing for the greater good - we've seen again and again that people will do what they want.
Additionally, there is a government body that knows what is good and harmful. It's called the FDA. The FDA has been very effective at stopping food borne illnesses and helping people have safe eating habits. -
Info Page
Here's the NASA info page about it, including all of the times in UTC (as they should be!): https://eclipse.gsfc.nasa.gov/...
And NASA's details on Saros 129: https://eclipse.gsfc.nasa.gov/...
-
Info Page
Here's the NASA info page about it, including all of the times in UTC (as they should be!): https://eclipse.gsfc.nasa.gov/...
And NASA's details on Saros 129: https://eclipse.gsfc.nasa.gov/...
-
Re:One quibbleYou missed the part where NASA calls it flawed. I'll boow out of your pedantry exercise now, you need to call NASA righht away and let them know they are also wrong. Here's the link again - you must have missed it the first time bacause it appears to be the only part of my post you didn't reply on.
-
Re:Aim it at the moon...
We already have pictures of the Apollo landing sites that are far better than what this telescope can make. The Lunar Reconnaissance Orbiter has imaged all of the Apollo sites.
-
Re:One quibble
Err the comparison is in the article.
Also the Hubble isn't a flawed instrument. It was a flawed instrument but after the optics were corrected it is very much an instrument that matches the spec that was originally supposed to be built to, and more given how the process of trying to correct the images while waiting for optics produced new breakthroughs in image processing.
I guess you would say that my eyes are as close to perfect as possible because my glasses give me 20/20 plus vision?
It's usless pedantry to say the Hubble isn't a flawed device. It was polished incorrectly, and sadly, I could have determined that fact with a Foucault tester I could make in my garage in 20 minutes. There is another mirror sitting in a warehouse in Rochester, IIRC, that is ground and polished to as close to perfection as could be done.
If that back up mirror had been the one sent to space, the Hubble would have performed on spec with no mirror tricks.
And no one would ever design a telescope with the system they ended up with in Hubble.
NASA calls it a flaw: https://www.nasa.gov/content/h...
That it was fixed is not in doubt. The fix allowed them to get good images while using the flawed mirror. But the mirror has spherical aberration. The fix was an amazing feat.
But it was still a kludge - http://cbsnews1.cbsistatic.com...
-
Re:Aim it at the moon...
Is this what you're looking for: https://www.nasa.gov/sites/def...
-
Re:Yeah no
In 2013, the IPCC estimated the current rate of sea level rise as 3.2 mm/year. If we assume that rate, we get 48 mm in the next 15 years, or about 1.9 inches. But that's an underestimate, because sea level rise is accelerating. It has increased substantially in the last 20 years, and that 2013 number is already out of date. The current rate is estimated at 3.4 mm/year. That gives 51 mm or 2 inches. But of course it's still accelerating, so the actual rise over the next 15 years will be a bit more than that.
That's the global average rate, but it isn't the same everywhere. It's faster in some places and slower in others. On most of the US east coast sea level is rising faster than the global average, and on the gulf coast it's rising even faster. So a lot of the coastal US will get bigger increases than that.
no additional conduit will be submerged if the average ocean depth increases 45mm more.
You just made that up. Maybe you should talk to the people who've actually looked at the data.
waves are higher than 45mm! tides are more than 45mm
Totally irrelevant. We're talking about buried cables. The water table doesn't go up and down with every wave that hits the beach.
-
Re:So 2 inches will flood out the Internet?
let's be REALLY generous and say that the extrapolated next two inches happen in 50 years rather than 100.
It's currently rising at 3.2 mm/year, so even at the current rate we'll see another 2 inches in less than 15 years. Not 100. Not even 50. 15.
But it's the second order derivative that you need to worry about. Sea level rose about 0.5 feet over the last century. Half of that occurred in the last quarter century. Sea level rise will be measured in feet over the next century.
Many of the conduits at risk are already close to sea level and only a slight rise in ocean levels due to melting polar ice and thermal expansion as climate warms will be needed to expose buried fiber optic cables to sea water.
-
Re:China to America
That is a lie, and you are a liar [newscientist.com].
Being able to count "nuclear fatalities" on one's fingers is hyperbole at best! As you source establishes, we can be fairly certain that there have been at least 43 deaths from the Chernobyl accident:
Two decades ago, John Gittus of the Royal Academy of Engineering told the UK government there could eventually be around 10,000 fatalities. Today, some – notably environmental groups – put the death toll well into six figures.
But that’s the extreme end of the estimates. “The only deaths that have been firmly established, either individually or statistically, are the 28 victims of acute radiation syndrome and 15 cases of fatal child thyroid cancer,” says Wade Allison of the University of Oxford.
Agreement is unlikely any time soon.That's more fingers than I have in any case, I don't know about OP.
Chernobyl killed/is killing at least 4,000 people [ourworldindata.org]
Against OP's more reasonable claim, that "[n]uclear is orders of magnitude safer than fossil fuels," this figure of 4,000, or indeed any other number, of potential deaths is fairly meaningless unless we also quantify deaths due to fossil fuel usage. The source you quote offers this assessment:
The potential risks of nuclear energy are real: in both Chernobyl and Fukushima, deaths occurred as a result of direct nuclear impacts, radiation exposure and psychological stress. Nonetheless, of the two largest nuclear disasters, the death toll was of the order of thousands to tens of thousands in one, and thousands in the latest. Arguably still too many, but far fewer than the millions who die every year from impacts of other conventional energy sources.
Fukushima will have killed at least 400 people due to radiation exposure
Careful here! Your source reads: "The WHO project the number of deaths from low-level exposure to be close to zero, and up to 400 in upper estimates. It is not beyond possibility, and indeed looks increasingly likely, that there will be "close to zero" deaths due to radiation exposure. Paradoxically, the evacuated Fukushima residents will probably enjoy far lower mortality, especially from thyroid cancer, than normal, due to the extremely thorough screening (and relatively high treatability) to which this cohort is subject.
Well
Finally in terms of relative safety we need to take into account Kharecha and Hansen's study which suggests that "that despite the three major nuclear accidents the world has experienced, nuclear power prevented an average of over 1.8 million net [i.e. taking into account estimates of potential nuclear fatalities] deaths worldwide between 1971-2009."
You're also engaging in the logical fallacy of false dichotomy. Fossil fuels are also da
-
Re: Ouargla, Algeria
That's not quite the case. He was on board with AGW, but then when Climategate hit he saw some shoddy science that gave him pause for concern.
I was initially hopeful when he started his project, but I became soured when it became a giant fund-raising effort as well as involving nepotism (his daughter).
Also, glancing at the paper, is there an explanation that explains the temperature rise from the 1750-1850 temperature average to the higher temps in 1850-1950? Is that from carbon dioxide? If not, what is the explanation?
What caused the Earth to warm and sea levels to rise about 400 feet in the last 10,000 years?
Something else to consider: the predicted rise in temperature due to the direct effects of carbon dioxide is modest. Most of the rise is from hypothesized cloud formation, which is uncertain.
You're arguing over semantics. He was skeptical in the years prior to completing the Berkeley Earth analysis and was not upon completion. He has stated this himself in numerous interviews. I personally know multiple colleagues of his so I feel quite confident in my assertion that he was skeptical about AGW and now is not.
I'm not sure that whether or not his daughter worked for him has anything to do with the empirical evidence concerning AGW.
Warming during the first half of the 20th century is likely due to a combination of natural climatic variability (namely solar irradiance and volcanism) and anthropogenic factors (burning of fossil fuels that began ramping up during the industrial revolution). Gradual warming since the dawn of the Holocene is pretty well understood as being a function of the Milankovitch cycles. Are you suggesting that because climate has changed due to natural variation in the past, it's therefore impossible that humans are causing a meaningful change in the planetary energy budget? I'm not really following your line of reasoning so just checking.
The models have generally under-estimated temperature rise rather than the reverse. Recent research suggests cloud feedback may be stronger than anticipated and in fact result in greater warming. It's also important to point out that the CH4 hydrate feedback in the East Siberian Arctic Shelf is not incorporated into models and will possibly exacerbate warming in ways that the models don't account for. So, while it's true that there is variability in processes, scientists (especially the IPCC synthetis) has tended to be demonstrably conservative in the RCP projections. Given that the 1.5C/2C RCP are already pushing the limits of what may be "safe" upper limits for human civilization, it probably makes sense to be pragmatic and take them seriously -- especially if there's even a 5% chance that warming may actually exceed those numbers given other feedbacks. -
Re: Ouargla, Algeria
What caused the Earth to warm and sea levels to rise about 400 feet in the last 10,000 years?
From your own FA, the end of an ice age. The peak of the ice age had sea levels dropping well below 'average', so as the ice age ended the sea levels rose.
-
Re: Ouargla, Algeria
Dr. Muller began the instrument record reconstruction project as a climate skeptic and as a result of his own research, changed his mind about AGW.
That's not quite the case. He was on board with AGW, but then when Climategate hit he saw some shoddy science that gave him pause for concern.
I was initially hopeful when he started his project, but I became soured when it became a giant fund-raising effort as well as involving nepotism (his daughter).
Also, glancing at the paper, is there an explanation that explains the temperature rise from the 1750-1850 temperature average to the higher temps in 1850-1950? Is that from carbon dioxide? If not, what is the explanation?
What caused the Earth to warm and sea levels to rise about 400 feet in the last 10,000 years?
Something else to consider: the predicted rise in temperature due to the direct effects of carbon dioxide is modest. Most of the rise is from hypothesized cloud formation, which is uncertain.
-
Re:NO NUKES
2AU lol, that's still pretty close kiddo. Try Pluto, or deep space.
Why bother? Mars is 21,344 km in circumference. At an average walking pace of 5 km/h, if you walk 12 hours per day, it would require nearly a year to walk all the way around Mars. 355 days, to be exact. With no oceans in the way, this is physically possible. And that's without stopping to look at the rocks on the way. There's plenty to do at 2AU.
There are just five human artifacts beyond Pluto's orbit right now, and that number is unlikely to change appreciably in decades, if it even changes this century. (Lovely visualization, somewhat outdated, from NASA here.) Reactor design for deep space isn't relevant.
-
Re: NO NUKES
Since cold is the absence of heat, yes, space is very cold indeed. I did not mean to infer otherwise.
"Space has a background temperature. You will not cool to below it."
I believe otherwise. CMB has a thermal black body spectrum at a temperature over 2.7 K. Back in 2003 MIT was able to lower the temperature of sodium gaz below 1 nanokelvin.
http://news.mit.edu/2003/cooli...
Gravity Probe B (2004-2005) was using gyroscopes housed within superfluid helium, maintaining a required temperature of under 2 kelvins.
https://en.wikipedia.org/wiki/...
There has also just been a launch of the Cold Atom Lab on May 21'st this year, which may allow temperatures as low as 1 pK.
https://coldatomlab.jpl.nasa.g...
https://science.nasa.gov/scien... -
Re:CO2 is not "climate pollution"
Yes, sure, you know more than NASA: https://climate.nasa.gov/vital...
But we have weather station all over the globe and many of then have public info... just go look and take the numbers, do the math and then come back to us if there isn't a small and persistent global temperature increase
-
Re:Headline Wrong - Apollo Launched First
You do realize that "AS" is an acronym for "Apollo Saturn" don't you?
Anyways, if you're going to follow that train of thought, the name "Proton" wasn't used explicitly for the booster until September 1967 (https://en.wikipedia.org/wiki/List_of_Proton_launches_(1965%E2%80%9369)).
Regardless, "Apollo" was used for the name for the large US boosters in 1960 with first launches in 1964 - https://www.hq.nasa.gov/alsj/C...
-
Re:Ohio is still rebounding from last ice age
Ohio is still rebounding from the last ice age, this is a process that occurs over thousand year time spans. We are melting the ice magnitudes of order faster than the rebound can occur.
Did you notice the curiosity in your sentence? How do you know that "we" are melting the ice, as opposed to the ice continuing to melt from the last ice age? Sea levels rose about 400 feet in the last 10,000 years.
-
Re:"Review regulations on commercial space flights
Yeah, they did.
https://history.nasa.gov/rogersrep/v1ch5.htmThe decision to launch the Challenger was flawed. Those who made that decision were unaware of the recent history of problems concerning the O-rings and the joint and were unaware of the initial written recommendation of the contractor advising against the launch at temperatures below 53 degrees Fahrenheit and the continuing opposition of the engineers at Thiokol after the management reversed its position. They did not have a clear understanding of Rockwell's concern that it was not safe to launch because of ice on the pad. If the decisionmakers had known all of the facts, it is highly unlikely that they would have decided to launch 51-L on January 28, 1986.
-
Re:"Review regulations on commercial space flights
Sure. NASA learned from that and other accidents/disasters before it, and don't want to see that happen in the private sector. I'm perfectly okay with that; why aren't you?
They did?!?!?!
If NASA had the capability to learn - and to retain that learning - the Challenger never would have happened.
Recognize this:
...
NASA officials argue that the figure is much lower. They point out
that these figures are for unmanned rockets but since the Shuttle is a
manned vehicle "the probability of mission success is necessarily very
close to 1.0." It is not very clear what this phrase means. Does it
mean it is close to 1 or that it ought to be close to 1? They go on to
explain "Historically this extremely high degree of mission success
has given rise to a difference in philosophy between manned space
flight programs and unmanned programs; i.e., numerical probability
usage versus engineering judgment." (These quotations are from "Space
Shuttle Data for Planetary Mission RTG Safety Analysis," Pages 3-1,
3-1, February 15, 1985, NASA, JSC.) It is true that if the probability
of failure was as low as 1 in 100,000 it would take an inordinate
number of tests to determine it ( you would get nothing but a string
of perfect flights from which no precise figure, other than that the
probability is likely less than the number of such flights in the
string so far). But, if the real probability is not so small, flights
would show troubles, near failures, and possible actual failures with
a reasonable number of trials. and standard statistical methods could
give a reasonable estimate. In fact, previous NASA experience had
shown, on occasion, just such difficulties, near accidents, and
accidents, all giving warning that the probability of flight failure
was not so very small. The inconsistency of the argument not to
determine reliability through historical experience, as the range
safety officer did, is that NASA also appeals to history, beginning
"Historically this high degree of mission success..."That was written by someone a lot smarter than all of us combined.
-
Re:Alarmist much?Perhaps you will come to a different conclusion, but it seems unequivocal to me:
According to the new analysis of satellite data, the Antarctic ice sheet showed a net gain of 112 billion tons of ice a year from 1992 to 2001. That net gain slowed to 82 billion tons of ice per year between 2003 and 2008
Every year, from 1992 to 2008, Antarctica added 82 to 112 billion tons of ice. They are completely at odds with each other.
-
Re:Alarmist much?
The NY Times article has this big graph showing an accelerating downward trend starting in 1994. Yet NASA says that Antarctica has been gaining ice from 1979 to 2015. So which is it?
Boy, you're just in love with that Zwally paper, aren't you? Even to the point of ignoring the caveats that Zwally himself put on it.
-
Total Ice Mass Gain/Loss NASA 2015
-
Alarmist much?
The NY Times article has this big graph showing an accelerating downward trend starting in 1994. Yet NASA says that Antarctica has been gaining ice from 1979 to 2015. So which is it?
And when you look at the confidence intervals (2720 +/- 1390 - the window is LARGER than the estimate!) you start to get an idea that this is a "well, we don't know but... FLOODING!". I'm sorry, if any engineer or researcher working on my team came and said "I believe the correct value is 50, with a tolerance range from 0 to 100" I'd send them back to the bench after a good chewing out or they'd be sent out to the street...
-
Re:Now we know.
I predicted:
Once all the coastal cities of the world disappear under 200-300 feet of ocean rise 200-300 feet of ocean rise
Prompting Raenex to respond:
Sea levels rose about 400 feet in the past 10,000 years. It's predicted to rise about 3 feet by 2100. Adjust your expectations of man-made climate change versus natural accordingly.
I neither said nor implied that I expected that much rise in sea levels by the end of his century.
That having been said, I think it's worth noting that every official estimation (i.e. - by the IPCC) of the rate of icecap melting thus far has proven to be wildly over-optimistic within no more than a few years. The goalposts keep moving, in part because the IPCC's reports are subject to political pressure from oil-producing nations, and in part because apparently climate scientists have yet to realize that icecaps, like glaciers, are complex systems (what used to be called "chaotic systems").
Once the base conditions for complex systems change even slightly, they tend to become unstable pretty rapidly, and begin oscillating with logarithmically-increasing intensity.
Ever watched a spinning top lose enough rotational speed to begin to wobble?
Remember what happens next
-
Re:Move along nothing to see here...
This big bump in the 1930s, as documented by Dr. James Hansen, noted global warming advocate, in a peer reviewed journal and posted on NASA's server. Of course, it was later "adjusted away" because it didn't support the proper conclusions, so the record was changed. As so aptly put in 1984, "Who controls the past controls the future. Who controls the present controls the past."
-
Re:Now we know.
Once all the coastal cities of the world disappear under 200-300 feet of ocean rise 200-300 feet of ocean rise
Sea levels rose about 400 feet in the past 10,000 years. It's predicted to rise about 3 feet by 2100. Adjust your expectations of man-made climate change versus natural accordingly.