 Slashdot Mirror
Domain: noaa.gov
Stories and comments across the archive that link to noaa.gov.
Comments · 2,602
-
Re:CAGW is a trojan horse
So, let's be clear. You are saying that if I look, I will not find a methodology for the homogenisation of longitudinal temperature data (i.e. USHCN v2.0 or v2.5 and GHCN) published prior to July 8th 2014?
My time is important. What should be my motivation for spending the time to look: Let's say, if I find a methodology, you will issue the following statement: I made remarks impugning the scientific methodology underpinning datasets published by NOAA which, upon investigation, turned out to be false.
Deal?
Have fun looking for that code.
I take that as a yes.
USHCN methodology Last updated Oct 2013
GHCN methodologyLast updated 2009
Total time less than 5 minutes.
Now, where would be an appropriate place for your retraction? I suggest:
(1) On your blog
(2) That if you ever choose to post here again on a climate related topic, your remarks should start with this disclaimer.
The temperature is always fluctuating. Four hundredths of a single degree over a 10 year period is next to nothing, and is well within the margin of uncertainty. But your logic I could claim it has been cooling since 2001. The models predicted 2 tenths of a degree warming per decade.
Well, thanks for just making stuff up. Are you actually going to attempt to justify your statement There has been no warming for 17 years? Not that I should have to tell you what to do, but you might progress along this path if you cite a scientific paper which says this. (i.e 1996-2013) Don't imagine that you can bedazzle me with figures that you plucked out of your arse, mixed together with flawed methodology and then shaped into a cake for consumption, I'm not eating it. I don't accept assertions and distortions as proof. Cite.
The IPCC report says that AGW is repsonsible for 50%+ of warming since 1950, at 95% certainty. I don't know why Stocker is misrepresenting it, maybe you should ask him. Go read the report for yourself. It's easy to try to change history after predictions fail.
So to summarise: the source you relied upon for your statement: there has been no warming for 17 years is in fact misrepresenting the facts. Got it.
You seem angry btw.
-
Re:Solar activity
http://www.swpc.noaa.gov/alerts/warnings_timeline.html Prepare for increased risk of funny things to happen as the storm strength goes over G2 or G3. The 2003 G5 storm increased my systems internal 12V voltage to 14V, spiking exactly at the time the storm hit the measurement stations nearly the other side of the world.
-
Re:Climate Change on Slashdot? Bring on the fun!
Well, the earth has been warming since the little ice age. With respect to recent warming, the warming has plateaued for the last 17 years. If the warming stops at a high, you are still going to get variations from year to year. Some years will be slightly hotter and some years will be slightly cooler, but on the whole it averages out. And we're talking about differences of a few hundredths of a degree here, well within the margin of error. "2010: Hottest Year in History!" (...beating 2005 by one one-hundredth of a degree.) I guess it makes an exciting news story, but it's essentially meaningless.
Glad you find it interesting, rather than trying to shout me down which is the usual response! -
Re:Solar activity
The guy who runs the website works for NASA, but I'm fairly certain that it's a side project, and not a NASA-funded website. (if it was, they'd have NASA logos on it, and not ads)
Solar Monitor used to be hosted by NASA, but it's currently at Trinity College, Dublin.
NASA funded projects would include Helioviewer (also ESA funded) and ISWA
However
-
Re:I live in Montana. I'm looking forward to it.
Yeah, it really doesn't:
http://www.arctic.noaa.gov/det...At least in Montana and the Yukon
-
Re:I live in Montana. I'm looking forward to it.
Here is the data: http://www.ncdc.noaa.gov/crn/
-
Re:It *isn't* that well understood
Correction 380ppm was crossed in 2005-2006 time frame.
-
Re:It *isn't* that well understood
"Current CO2 concentration is 380 ppm or so."
You're a bit out of date(2010), I see. Atmospheric CO2 has been crossing the 400ppm mark lately, (avr 399 ppm)
Over the last year(june2013-june2014) it climbed by 2.56ppm, and that rate of increase appears to be accelerating, thus humanity is going to be in deep doo-doo real soon if we don't stop burning fossil fuels.
The other facts you seam to be missing, Our star(SOL) was somewhat dimmer in the past, thus requiring much higher CO2 levels to keep the earth from freezing over. And that humanity is totally dependent on the current climate patterns..
-
Re:Not surprising.
The "small percentage" I mentioned was in reference to this. You can argue if you like that a ~ 27.3% increase is large but I disagree, since climate sensitivity to CO2 is widely acknowledged to be based on a geometric progression.
As I've said, we've increased CO2 by ~40% but your link refers to the CO2 rise between 1900 (290 ppm) to 2000 (369 ppm) which is an increase of ~27.24%. But we're actually living in 2014, and CO2 in real life is now at ~400 ppm because we're increasing it so rapidly that even NOAA websites rapidly go out of date. That's a ~37.93% increase even if you take "1900" to be the start of the the Industrial Revolution.
Also, climate sensitivity is logarithmic, not geometric. But it's hard to remember that our CO2 emissions are probably more rapid than any events in the last 300 million years. Even logarithmic climate sensitivity allows for accelerating warming if the CO2 concentration rises faster than exponentially. Since 1960, atmospheric CO2 concentration has risen faster than exponentially. Tamino showed this by taking the logarithm of the Mauna Loa measurements and noting a statistically significant acceleration.
We also need to keep in mind, though, what percentage that is of the overall atmosphere: (CO2 % of all atmosphere [wikimedia.org]. Which is a very small percentage indeed, even though Wikipedia puts it higher than NCDC does in the above page.
Why do we need to keep that in mind, any more than we need to keep in mind the very small percentage of alcohol or LSD in the bloodstream? The same percentage increase of ~40% also occurs when we notice that before 1850 there were ~4 kg of CO2 over each square meter of Earth's surface. Now there are ~6. We did that.
-
Re:Not surprising.
Then you claimed I hadn't notified you after I wrote this article until "much later" when I'd actually notified you within a few hours. Will you retract your claim, or is "much later" actually defined as a few hours in Janeland?
First, as I mentioned to you before elsewhere, it isn't an "article". It doesn't meet any standard definition of "article". It's a rambling, ongoing diatribe that reads like little more than a monument to your ego.
Second, as I have clearly explained to you several times, when I discussed this with you after that time I was also referring to LATER posts of yours, not the first one. Not that it really matters, because afterward is still afterward. You might disagree with my interpretation of "much later" in regard to the original post, but that's your opinion.
After that you gave me no notice at all of most of your distortions, in which you took even more comments of mine out of context, assigned wholly imagined meanings and motivations to them, and "argued" with them all by yourself, where you didn't have any fear of being contradicted. (Why? Because I don't care about you and don't visit your website every day... nor should I be forced to do so in order to incessantly correct your mis-characterizations of my words.)
The rest of your rant is loaded with similar bullshit. Yet again you are trying to mislead people for personal, and apparently rather strange, reasons of your own.
I will repeat what I wrote in another thread: all you are doing by indulging in this obsession is making yourself look foolish. I understand that you don't seem to think so, but that causes me some concern. Others have written about it before here, too.Do you still dismiss flat statements like "the CO2 increase is attributable to human activity" as disingenuous
This is a classic example of your attempts to distort my comments. First, I might have ignorantly denied that C02 increases were due to human activity, years ago. I have not intentionally made any such statement in recent years, since I do not believe any such thing. But more to the point is this:
... and claim that we're only contributing a small percentage despite the fact that ~200% of the CO2 increase is attributable to human activity?
The "small percentage" I mentioned was in reference to this. You can argue if you like that a ~ 27.3% increase is large but I disagree, since climate sensitivity to CO2 is widely acknowledged to be based on a geometric progression.
We also need to keep in mind, though, what percentage that is of the overall atmosphere: (CO2 % of all atmosphere. Which is a very small percentage indeed, even though Wikipedia puts it higher than NCDC does in the above page.
Further, you appear to be claiming that we have contributed about "200% of the CO2 increase" ourselves, when that is simply not logically possible. While we might have produced 200% as much CO2, if so obviously much of it has been absorbed in one way or another by the environment. While you might have a problem with that, it is a completely separate argument. It is not possible for us to have contributed "200% of the increase", because only 100% of the increase actually exists. Once again you demonstrate a bizarrely weak grasp of logic for someone who presents himself as a scientist.Do you still link to "PSI" blog posts accusing scientists of fraud because Dr. Salby said accumulation of human emitted CO2 is somehow unphysical? Do you acknowledge these "PSI" accusations of fraud are baseless, or do you think they're honest, true and correct?
If my memory serves (and it may not), I linked to that page once in the past. A
-
Re: CAGW is a trojan horse
It is a global consensus. Is there a dispute that CO2 traps heat? The runaway greenhouse that is venus is that fake too. Is this fake too?
-
Re:what a waste of money
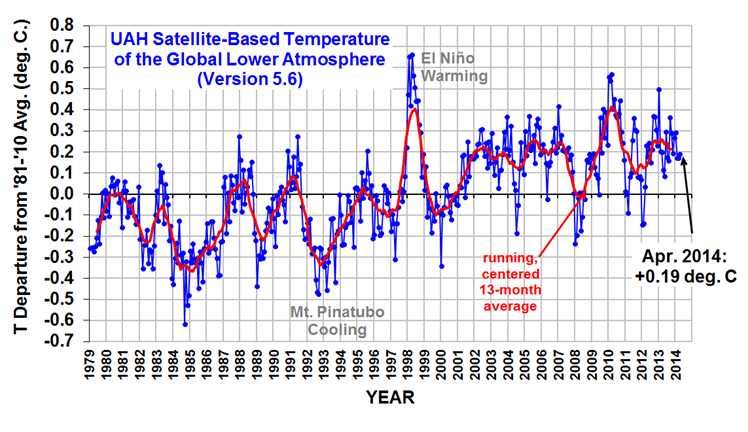
July 1936 was the hottest month in the temperature record, then it wasn't, now it is again; so who is the denialist? RSS temperature data set shows no warming for 17 years and even hunts at a possible cooling, UAH temperature record shows no significant warming for 17 years and the USCRN even shows a 10 year pause in warming; so again who is the denialist?
-
Re:Proper science is falsifiable.
I have no problem acknowledging that CO2 has weekly cycles due to human activity.
Good, we're getting somewhere.
Now, let's review the other items:
2) Mauna Loa CO2 show a weekly cycle - weekends lower by 0.022 ppmv (http://www.researchgate.net/publication/241061722_A_weekly_cycle_in_atmospheric_carbon_dioxide)
3) South Pole CO2 does not show a weekly cycle
(http://www.researchgate.net/publication/241061722_A_weekly_cycle_in_atmospheric_carbon_dioxide)4) 28% US emissions from transportation
(http://climate.dot.gov/about/transportations-role/overview.html)5) 84% transportation emissions from light and heavy duty vehicles (which should show a weekly cycle)
(http://climate.dot.gov/about/transportations-role/overview.html)6) weekly variation for transportation from Salt Lake City
https://www.youtube.com/watch?... (34:56)- looks like weekend coefficient might peak around
- looks like weekday coefficient might peak around7) Annual mean growth rate of CO2 close to 2.0ppm/year for 2000-2010
http://www.esrl.noaa.gov/gmd/c...Are any of those assertions objectionable to you?
That isn't especially useful when the contribution of CO2 on it's own is not that large without feedbacks.
First thing we'll do is look for the anthropogenic signal in the CO2 record - we can move on to what effect CO2 has afterwards.
The time constant for the earth to respond to CO2 is larger than a week.
If there is a uniform delay, then we should still see a weekday/weekend pattern. On the other hand, if you're asserting that human CO2 is buffered by some unknown buffer that smooths out the weekday/weekend pattern, and then that buffer decides to re-release CO2 in an even manner, I'd love to hear your hypothesis as to what that buffer is, what other high frequency cycles it might remove, whether or not the buffer is adaptive, and whether or not the buffer can have an independent secular trend.
You will, as you clearly intend, massively underestimate sensitivity if you do the analysis you are proposing.
Again, we're not doing sensitivity questions yet - we're just trying to establish human CO2 emissions impact on global CO2 levels. Based on the weekend/weekday anthropogenic cycle that you've agreed exists, we should be able to quantify the anthropogenic contribution based on the observed swing in global CO2 levels.
What you are doing is like giving someone a large does of paracetamol and then concluding it isn't harmful because the effects take a while to occur.
No, what we're doing is figuring out if we can detect paracetamol doses after they've been given - we haven't gotten to harms yet.
-
Re:Proper science is falsifiable.
Maybe we can agree on some basic facts:
1) Weekly cycles are anthropogenic - there is no natural distinction between weekdays and weekends
2) Mauna Loa CO2 show a weekly cycle - weekends lower by 0.022 ppmv (http://www.researchgate.net/publication/241061722_A_weekly_cycle_in_atmospheric_carbon_dioxide)
3) South Pole CO2 does not show a weekly cycle
(http://www.researchgate.net/publication/241061722_A_weekly_cycle_in_atmospheric_carbon_dioxide)4) 28% US emissions from transportation
(http://climate.dot.gov/about/transportations-role/overview.html)5) 84% transportation emissions from light and heavy duty vehicles (which should show a weekly cycle)
(http://climate.dot.gov/about/transportations-role/overview.html)6) weekly variation for transportation from Salt Lake City
https://www.youtube.com/watch?... (34:56)- looks like weekend coefficient might peak around
- looks like weekday coefficient might peak around7) Annual mean growth rate of CO2 close to 2.0ppm/year for 2000-2010
http://www.esrl.noaa.gov/gmd/c...Do you disagree with any of those assertions?
-
Re:records go back to 1880, very funny
It hardly seems credible that with all that world record cold virtually everywhere (except for the Pacific El Nino event), that May could have ALSO been a "record warm" month. It just doesn't add up. Just like so many of NOAA's other figures.
The linked NOAA article certainly did provide maps of May temperature anomalies and May temperature percentiles. Far from showing "world record cold virtually everywhere" they show absolutely no "record coldest" grids, and quite a few "record warmest" grids.
The entire continental U.S., even when you factor in the areas in the Pacific that were experiencing El Nino, experienced record cold for the entire first 5 months of 2014. USHCN's own raw data.
Again, no. I've previously told you that we're not experiencing El Nino yet, but obviously you ignored NOAA in favor of your uncited "neighborhood meteorologist". NOAA still states that "ENSO-neutral conditions continue" but forecasts a 70% chance of an El Nino this summer.
And again, May temperature percentiles show that only Louisiana and south Texas were even "cooler than average" (not "much cooler than average" or "record coldest"). The rest of the continental U.S. was either near average, warmer than average, or much warmer than average (especially Alaska).
-
Re:Smash?
To answer my own question, definitely not. But realizing that there's a bit of variability in the data set, this certainly qualifies as an inflammatory description of expected data. https://www.ncdc.noaa.gov/cag/...
-
Re:I don't understand how this is a "record"
Their compression setup makes absolutely no sense to me. The wikipedia article is either wrong, or someone doesn't know what they're doing. When you dive, your body absorbs gasses into your bloodstream. You have to ascend slowly to let the gasses out. Ascend too quickly, and it's like opening a soda bottle in your blood. With a deep dive (say 300 feet), that could take hours. The longer/the deeper you go, the more gasses you absorb, up to a certain point. This is what is meant by a saturation dive. Your body is fully saturated with as much extra gasses as it can hold at whatever depth you're at, working there longer doesn't make you absorb any additional gasses, so the ascent takes the same amount of time, no matter how much additional time you spend at depth.
So, in a saturation dive, you exit the water to a chamber which is at THE SAME pressure as the surrounding water. Which means from a pressure perspective, you don't ascend. You're just getting out of the water. You sit inside the chamber, have some lunch, get some sleep, whatever. You can go back and forth between the chamber and the water without waiting for any decompression.
But with their setup, you exit the water into the moon pool, then go into the Entry lock, where the pressure is adjusted to surface level pressure (ascending). But remember how this can take hours? You're stuck inside the Entry lock, and no one can go in or out of it until you're done.
80 feet isn't horribly deep. You can stay down for 40 minutes and ascend directly, without having to decompress at all. But 8 hours at 80 feet puts you at almost 6 hours of decompression time. seriously. -
Re:Queue the deniers
I agree, we should stick to the science. Here you go:
- The peer-reviewed Journal "Nature Climate Change" includes and references thousands of scientific papers on the subject.
- The IPCC's 1,500-page "Physical Science Basis" report cites hundreds of references and is authored by hundreds of experts. It clearly states what we know, don't know, and how we know it. It reviews its past predictions, notes where its models have errored, and takes into account an incredible wealth and scope of scientific observations over 150 years.
- The IPCC also makes all of its data and models available for review. So you can see for yourself.
- The US Government also recently updated its regularly scheduled report written by over 300 experts.
- The USGS has a Climate Model Browser that lets you try out all the different simulated predictions for Global Warming. You'll notice the specifics vary widely, but they all predict dramatic temperature rises.
- The NOAA has a National Climate Data Center where you can watch the temperature trends. Here's a visualization based on the data.
- The United States Defense department has several reports on the risks posed by Global Warming (see here, here, here, and here).
- The Center for Coastal Resources Management (CCRM) has produced some excellent reports on sea level rise due to Climate Change to inform local communities like Norfolk VA, where flooding is already a major issue, what to expect in the near future due to Global Warming.
- You can also watch the sea levels rise at the NOAA's Sea-Level Trends website.
- If you don't trust the government, then I recommend The Berkely Earth Project. It was funded by the liberal's favorite bad guys, the Koch Brothers, but its results were so compelling that the lead Climatologist, Richard A. Muller, wrote a piece for the New York Times announcing he was no longer a skeptic.
- Of course, it's always good to have a contrarian viewpoint in the mix, and for that, I recommend AGW skeptic Judith Curry, who presents valid challenges to the consensus with her strong scientific background. I don't find her convincing, but her challenges make for good food for thought.
If you dispute this science, then I recommend publishing your own peer-reviewed papers, your own models, and your own alternative hypotheses in the scientific journals. I see a lot of skeptics nit-picking the science, but not many actually taking the effort to publish in the scientific forums.
I eagerly await one of the skeptics out there to please post an equally substantive list of references to "balance" my citations, so everyone can review and compare them.
-
Re:Wind chill on a solar collector
Wind chill does not affect inanimate objects. Yes they might cool down to the ambient temperature faster but they will never go lower than the ambient temperature regardless of the wind speed. Wind chill is what it "feels" like and last I check solar collectors don't feel.
-
Re:Something Smells...
Well, there's an opportunity for you to do the research and find out for yourself if you are right. Until you publish I'll take NOAA's word for it. Here is the main page for the Kwajalein gauge to get you started. If you dig enough the raw data is available.
-
Re:Something Smells...
Here is the tide gauge for Kwajalein in the Marshall Islands since about 1945. There is a definite uptick in the past 15 or 20 years.
-
Re: Faster than the global average?
Well, I was just doing the math. But if you go look at the actual tide gauge for Kwajalein in the Marshalls it show nearly 6 inches of sea level rise since 1990.
-
Whatever.
-
Re:CO2 and climate: my take
> Do you realize that the 700-2000 m depth is nearly twice as deep therefore nearly twice as much water and nearly twice as much potential for storing heat as the 0-700 m depth?
Not only did I realize that, even the author realized it and thus used "energy content" and not temperature. You didn't.
As for the portion of 700-2000m, it's going to stop heating up in due time. Judging from page 2 of the NOAA report that the article was based on, the change in heat content of 700-2000m is delayed by about 15 years vs. 0-700m. The heat content of the 0-700m layer seems to lag by about 6 years behind global temperatures. So you'd expect the heat content of the 700-2000m layer to keep rising for another 5 years and then stop - 21 years after the atmospheric temperatures stopped rising in 1998. And that's that.
-
Bathymetric map of the Hawaiian Islands
http://maps.ngdc.noaa.gov/view...
Zoom in on the Hawaiian archipelago; de-selecting multibeam bathymetry surveys and switching the base map to "Shaded Relief (GEBCO_08) will give
you a nice image of what the chain looks like under water. Kaena Pt is the westermost tip of the island of Oahu. Also note that Maui Nui was once a much
larger island, encompassing Maui, Molokai, Lanai and Kahoolawe. Loihi is visible to the the southeast of the island of Hawaii. -
Re:Does it give you a position on the globe?
Decades ago the US GPS gave wrong coordinates to civilians, a few 10 meters off. That is what I call distortion.
Deliberate distortion, aka "selective availability" was turned off.
There are multiple other sources of distortion.The ionosphere does not distort or hinder GPS signals, why should it? The signals are in the wrong wavelength for that, and: they come from the outside. Again: easy to google.
Yeah, you should really give this google thing a try:
GPS and Ionosphere
The influence of the ionosphere on GPS Operations (contains a nice "Summary of GPS Errors")
Ionospheric Effects on GPS
There even are pretty pictures. -
Re:stable magnetic fieldThe best we have is the IGRF, but this would be no where near accurate enough. From NOAA:
If you measure the magnetic field at a point on the Earth's surface, do not expect to get the value predicted by the IGRF! Quite apart from the errors discussed above, there might be fixed contributions from buildings, parked cars, etc., and the magnetization of crustal rocks will certainly add its own local, small-scale, field, typically of magnitude 200 nT, but often much larger. There are also a large variety of time-varying fields, both man-made (traffic, DC electric trains and trams, etc.) and natural (from electric currents in the ionosphere and magnetosphere), and the associated induced fields from currents induced in the conducting earth. The ionospheric and magnetospheric fields occur at time scales mostly ranging from seconds to hours; in "quiet" conditions they may be as small as 20 nT (though enhanced near the geomagnetic equator and over the polar caps), but up to 1000 nT and more during a magnetic storm. On a longer time scale (days to years), the large-scale magnetic field of the external ring current (approximately represented by the Dst index) will give perhaps 1000 nT during and after a magnetic storm.
-
Re:obsolete
But there is. If it's predicted that the sea level will rise this much by the end of the century, and given how log it's going to take to actually shut down and clear a nuclear power plant site to a level it's safe to let it flood, the time to start is now for those plants we believe to be effected by such a oceanic rise.
The National Oceanic and Atmospheric Administration (NOAA) states clearly that these numbers are not predictions, and are little more than what-if scenarios to get policy makers thinking about what needs to be done. The figures quoted for sea level rise shouldn't be confused with scientific fact.
Quote from the original climate study published by NOAA publication :
This report provides scenarios to help assessment experts and their stakeholders analyze the vulnerabilities and impacts associated with possible, uncertain futures.
Probabilistic projections of future conditions are another form of scenarios not used in this report because this method remains an area of active research. No widely accepted method is currently available for producing probabilistic projections of sea level rise at actionable scales (i.e. regional and local). Coastal management decisions based solely on a most probable or likely outcome can lead to vulnerable assets resulting from inaction or maladaptation. Given the range of uncertainty in future global SLR, using multiple scenarios encourages experts and decision makers to consider multiple future conditions and to develop multiple response options.
-
Re:Energy-matter synthesis
Current thermodynamics works fine enough for what is suggested. Thermodynamics allows for next to ideal conversion.
Gotcha. So, in order to avoid boiling some water to distill it to purity, you're going to be doing a matter/energy/matter conversion. In order to come out ahead of using a simple boiler, your ~9 petawatt (two conversions in the requisite time doubles the power) process is going to need to be 99.99999999% efficient or so.
Even a 99% efficient process would dump 90 terawatts of waste heat. The waste heat of your process would represent approximately 1/10 of the power of an average hurricane. Remember, you're claiming we would do this in order to "save energy" by not distilling a quarter liter of wastewater.
In summary: just because science develops a method that allows something to be done does not imply it will ever be the favored technology. We developed the means to create gold via atomic bombardment a long time ago, and that process will never supplant gold mining.
-
Re:Cities won't be inundatedNOAA? You can go right to the source. Here is what they say: http://oceanservice.noaa.gov/f...
There is strong evidence that global sea level is now rising at an increased rate and will continue to rise during this century.
While studies show that sea levels changed little from AD 0 until 1900, sea levels began to climb in the 20th century.
The two major causes of global sea-level rise are thermal expansion caused by the warming of the oceans (since water expands as it warms) and the loss of land-based ice (such as glaciers and polar ice caps) due to increased melting.
Records and research show that sea level has been steadily rising at a rate of 0.04 to 0.1 inches per year since 1900.
This rate may be increasing. Since 1992, new methods of satellite altimetry (the measurement of elevation or altitude) indicate a rate of rise of 0.12 inches per year.
This is a significantly larger rate than the sea-level rise averaged over the last several thousand years.
-
Re:Translation...
-
Re:Translation...
You mean like the overall long-term increase in Antarctic ice mass, despite breakups in the Western sheet?
False. Antarctic land ice mass is decreasing, and reliable estimates of Antarctic sea ice volume (or mass) aren't available.
Even if you meant to refer to Antarctic sea ice extent (not mass), you already ignored me when I told you that this is consistent with Manabe et al. 1991 page 811: " sea surface temperature hardly changes and sea ice slightly increases near the Antarctic Continent in response to the increase of atmospheric carbon dioxide."
But maybe you'll listen to the National Academy of Sciences, if you honestly don't think the National Academy of Sciences is "alarmist". Again, their recent report is educational. They address Antarctic sea ice in question 12.
The gradual, long-term non-warming that has occurred over the last 15-17 years, depending on who you ask?
Jane and Lonny Eacus have repeatedly ignored me whenever I've told you that there's been no statistically significant change in the surface warming rate. But if you honestly doesn't think the NAS is alarmist, you might learn something from their answers to questions 9 and 10. This point is particularly relevant: "More than 90% of the heat added to Earth is absorbed by the oceans and penetrates only slowly into deep water. A faster rate of heat penetration into the deeper ocean will slow the warming seen at the surface and in the atmosphere, but by itself will not change the long-term warming that will occur from a given amount of CO2."
I agree: science is a wonderful thing. You can appear to "prove" almost anything you want if you restrict your study to relatively isolated phenomena, and ignore the bigger picture.
No, that's not science the way it's practiced by the National Academy of Sciences, the National Center for Atmospheric Research, the American Geophysical Union, the American Institute of Physics, the American Physical Society, the American Meteorological Society, the American Statistical Association, the American Association for the Advancement of Science, the Federation of American Scientists, the American Quaternary Association, the American Society of Agronomy, the
-
Re: Motivated rejection of science
http://www.globalchange.umich.edu/globalchange2/current/lectures/deforest/deforest.html
along with seasonal co2 levels
http://www.esrl.noaa.gov/gmd/ccgg/trends/
the first url shows where active forests are mostly the northern hemisphere. the second shows how winter co2 spikes globally as measured as far away from humanity as you can get. deforestation without replanting is unsustainable since the industrial revolution global forest have been 50% cleared. this is in 200 years of deforestation, another 200 and even the best efforts to replant forests will be irreversible, as charts show this will cause temperature rising and water resources dwindling as freshwater is pumped out of aquifers for human and crop consumption. animals don't use nearly as much water as humans do. so if more and more people are born more and more drought will hit especially as heat rises. which will lead to humans airconditioning more and more, which will raise the temperature.no the 'system' is not perfect and capitalism doesn't 'solve' global warming at best it makes companies greenwash the public and it is clear that unrestricted growth will lead to the extinction of humans, unless something is done, and i don't trust humans to do this on their own. computers need to do it and have the respect for creating a better world through more efficient recognition of real problems and real solutions.
-
Cherry-picking
It's easy to make actual historical data support your view when you quote it so selectively.
* The very first link, for example, not only hides all the warming before his carefully-chosen 1998 cutoff year, but also fails to mention the continued warming in ocean temperatures (where most of the energy ends up).
* The next link doesn't even have a source for his data.
* We are then told about a single data point (2014) in a single metric (arctic sea ice area) as if it's supposed to be particularly significant
* And finally a single paragraph from a single local newspaper from 1974, apparently intended to represent the alleged global scientific viewpoint of the times, and a quote from a single meteorologist admitting he doesn't know how climatologists can predict climate.
I honestly have no idea why you think this is convincing. It's no wonder he's never produced any peer-reviewed papers; the reviewers would tear his methodology to shreds.
-
Re:Frequent hurricanes?I notice you didn't include a source, and I think I know why.
Sea level was rising 12,000 years ago when we entered the current inter-glacial, but it had been stable for the last 8000 years
http://ourchangingclimate.word...
- until now. http://www1.ncdc.noaa.gov/pub/...
-
Re:wait... what???
you're kidding right? RTFA and you'll see that it's about the size of the average weekend hobbyist's RC airplane.
I need to get into the drone business because the profit margins appear to be staggering.
You need to get into the "selling things to the government on a no bid contract buisness". The profit margins are staggering once you have greased the right palms.
-
Re:wait... what???
you're kidding right? RTFA and you'll see that it's about the size of the average weekend hobbyist's RC airplane.
I need to get into the drone business because the profit margins appear to be staggering.
-
Re:Many warmer periods in the past with no AGW
http://i.snag.gy/BztF1.jpg
Ah, yea, that looks like a reliable figure. (sarcasm) How about we go to the original?
And ah, it was so much warmer 1000 years ago? Except, no, that was the medieval warm period, a regional thing, and it shows up because you're staring at regional data, not global temperature.
-
Re:AGW vs Vaccine
Of course AGW can be falsified. If we had not observed warming, it would be falsified. But we observed the predicted warming, so it is confirmed. In fact, we observe no less than ten signs related to the warming.
-
Re:Gasification
http://wwwcf.fhwa.dot.gov/exit... http://wwwcf.fhwa.dot.gov/exit... http://www.polytrauma.va.gov/d... http://www.wdtb.noaa.gov/scrip... http://www.fdrlibrary.marist.e... http://www.nestlegoodfoodgoodl... http://www.gd.gov.cn/jump.htm?... http://sasisa.ru/go_title.php?... http://4ygeca.com/index.php?na... http://www.stereohead.ru/?name... http://www.transtats.bts.gov/e... http://www.roc.noaa.gov/script...
-
Re:Projections
"They make a point now of not sharing the details of the models with people. That would concern you if you had any intellectual curiosity."
Well, that is bullshit of incredible intensity. Just for curiosity, who exactly told you that? You presumably won't have any injection to sharing that data with us.
In return, I will share with you this thing called Google, with which I was able quite rapidly to find:
http://www.gfdl.noaa.gov/fms
http://mitgcm.org/public/sourc...
http://www.giss.nasa.gov/tools...
http://www.nemo-ocean.eu/About...
http://www.metoffice.gov.uk/re...
http://forge.ipsl.jussieu.fr/i...
http://www.giss.nasa.gov/tools...
http://www.cesm.ucar.edu/model...
http://www.cesm.ucar.edu/model...
http://www.cesm.ucar.edu/model...
http://edgcm.columbia.edu/
http://www.mi.uni-hamburg.de/f...
http://www.mi.uni-hamburg.de/H...
There's more but I'm tired of cut and pasting. You would be able to find these also if you have any intellectual curiosity, but them you might have to doubt the sources of your info on how bad the climatology people are, and how they're hiding the code to conceal that out doesn't work, and that maybe the models do run and give outputs, ave before you know it the foundations of you whole world view are shaken. -
Re:Projections
http://www.epic.noaa.gov/epic/...
http://www.giss.nasa.gov/tools...
http://edgcm.columbia.edu/
http://nomads.gfdl.noaa.gov/CM...Some data: http://www2.cesm.ucar.edu/
Some background info:
http://www.ec.gc.ca/ccmac-cccm...
http://www.climateprediction.n...
http://www.climate.uvic.ca/
https://www.ipcc.ch/pdf/techni...This one has videos: http://vimeo.com/user12523377/...
In this age of information, ignorance is a choice.
-
Re:Projections
http://www.epic.noaa.gov/epic/...
http://www.giss.nasa.gov/tools...
http://edgcm.columbia.edu/
http://nomads.gfdl.noaa.gov/CM...Some data: http://www2.cesm.ucar.edu/
Some background info:
http://www.ec.gc.ca/ccmac-cccm...
http://www.climateprediction.n...
http://www.climate.uvic.ca/
https://www.ipcc.ch/pdf/techni...This one has videos: http://vimeo.com/user12523377/...
In this age of information, ignorance is a choice.