 Slashdot Mirror
Domain: noaa.gov
Stories and comments across the archive that link to noaa.gov.
Comments · 2,602
-
Re:Great, now the terrorists are controlling natur
Correct me if I'm wrong, but don't we have systems designed to monitor weather, flooding, seismic activity, volcanism and so on? If they're finding out about natural disasters from social networks, that's beyond pathetic.
True, but sensors can't tell you what impact a tornado is causing; for that, you need "ground truth" information. The National Weather Service still has a network of weather spotters to complement the information given by the sensors, and took storm reports over Twitter a couple of years ago to further augment that info (not sure if they are still doing that, though).
-
Re:Denialism of natural climate change
The locations that ice cores are taken are all well away from any local sources and sinks.
I'm not sure if that's particularly true, but I'd be open to the idea.
My layman's understanding is that we observe gases trapped in ice cores to run through some formula or function to get what we believe is the atmospheric CO2 level that applies to when that gas was trapped (i.e., we don't measure ppm of CO2 in trapped ice core gas - I could be mistaken, but can't find relevant cites - interesting notes here: http://www.john-daly.com/zjiceco2.htm).
In order to assert that ice cores represent areas that have no local sources or sinks, I'd expect that the *exact* same trapped gas data (direct measurement, not calculated), would have to exist in *every* ice core we find. So, if you took, say, two ice cores, 50 ft apart, they should be identical, and if we took, say two ice cores, from opposite poles, they should be identical.
Vostok is generally taken as the gold standard (much as Mauna Kea is today), and it may very well be that it's not just a single ice core, but a cluster of them in Vostok they're talking about - but I'd love to see a graph of them compared to ice cores elsewhere.
Of course, the real problem, apparently, is that ice cores can't be directly compared to modern instrumental records from Mauna Kea, and have been subject to unfounded data manipulation:
"An ad hoc assumption, not supported by any factual evidence[3, 9], solved the problem: the average age of air was arbitrary decreed to be exactly 83 years younger than the ice in which it was trapped. The "corrected" ice data were then smoothly aligned with the Mauna Loa record (Figure 1 B) , and reproduced in countless publications as a famous "Siple curve". Only thirteen years later, in 1993, glaciologists attempted to prove experimentally the "age assumption"[10], but they failed[9]."
At the rate we are currently going we'll hit 590 ppm of CO2 in the atmosphere well before 2100. The warming from doubling of CO2 is more likely to be around 3C when you take feedbacks into account.
Well, let's take a look at the data: http://www.esrl.noaa.gov/gmd/ccgg/trends/
For the 50 year record, we've probably added 70ppm (1960 - 2010). The trend looks linear, not exponential, so straight line it from there. Take today, 390, and add 100 years worth of CO2...say, 140 (round up to 150 if you want).
Now we're at 2112, and we've got a CO2 ppm of 540, tops.
Your jump from 280 - 390 (+40%, over a hundred or so years), caused a change in temp of about 0.8C. Going from 390 to 540ppm is about another 40% bump, so we can expect, probably another 0.8C. Asserting 3C has no basis in reality.
I don't get what you mean by "AFAIK, human CO2 emissions have only been asserted to by > 50% by even the most alarmist people".
I believe the IPCC stands by the thought that *most* of the temperature change is due to human CO2, but nobody has ever said *all* the temperature change is due to human CO2. I'll roughly define "most" as >50%. By that definition, if we've had 0.8C of temperature rise, and we're going to assume human responsibility for say, 50%+1 of it, that's only 0.4C of temperature rise that is "unnatural" and the other 0.4C of temperature rise that is "natural" (i.e., non CO2 based).
So, what this means is that the 0.8C observed increase during the 150 year period when we went from 280 - 390ppm has to be subdivided further - up to 0.4C of that was completely unrelated to CO2, and just part of natural cycles.
However, even if you assume that 100% of the temperature change was due to CO2, you can see by the math that it simply isn't alarming. +0.8C in 2112 isn't anything to worry about.
-
Re:Denialism of natural climate change
But the fact remains that for about 10,000 years, since the end of the last glaciation the level of CO2 remained at about 280 ppm.
That's not a fact, that's a supposition based on the accuracy of a proxy. CO2 levels vary *wildly* on the local scale, so much so that the official CO2 measurements at Mauna Kea have to throw out outlying data to avoid measuring local disturbances:
http://www.esrl.noaa.gov/gmd/ccgg/about/co2_measurements.html
" The upslope air may have CO2 that has been lowered by plants removing CO2 through photosynthesis at lower elevations on the island, although the CO2 decrease arrives later than the change in wind direction, because the observatory is surrounded by miles of bare lava."
It's true that a doubling of CO2 would cause about 1C of warming from the CO2 alone but that ignores the feedbacks it produces.
Actually you're right - it obviously doesn't create 1C of warming because negative feedbacks have kept it to about 0.8C. If these negative feedbacks didn't exist, we should have seen much more warming over the past 100 years...and we haven't.
Again, Lindzen: http://www.telegraph.co.uk/multimedia/archive/02148/RSL-HouseOfCommons_2148505a.pdf
-
Transfer it to NOAA?
Why not transfer it to NOAA's Satellite Service (NESDIS)?
NOAA's Office of Satellite and Product Operations ( http://www.ospo.noaa.gov/ ) in NESDIS is fully capable and staffed for performing 24/7 satellite operations of production systems, or older NASA research satellites. Unlike a private initiative, OSPO is already paid for by the american people, and makes the data available to everyone.
-
Re:Good grief. Religious zealots really annoy me.
Huh?
It's steadily increasing according to these graphs: http://www.nodc.noaa.gov/OC5/3M_HEAT_CONTENT/heat_content55-07.png http://www.nodc.noaa.gov/OC5/3M_HEAT_CONTENT/
-
Re:Good grief. Religious zealots really annoy me.
Huh?
It's steadily increasing according to these graphs: http://www.nodc.noaa.gov/OC5/3M_HEAT_CONTENT/heat_content55-07.png http://www.nodc.noaa.gov/OC5/3M_HEAT_CONTENT/
-
Correction
Oops, HTML got garbled. And I got the timescale wrong (1.5 * 10^22 J of heat accumulation is over about the 10-year period of 1995-2005, not the "latter half of the 20th century".
Here's the intended post:
Your innumerate ranting about needing to do math refused to do any math. And come on, merely mentioning global warming's contribution to the Earth's mass budget makes one a zealot? Sounds like you have an axe to grind. Who's the zealot here?
Let me do the math for you.
Cumulative ocean heat uptake over the 1995-2005 decade, largely due to global warming, is almost 1.5 * 10^23 Joules for the upper 700 meters of the ocean alone (reference). By E = mc^2, this works out to about 1700 tons over about 10 years, or about 170 tons per year, as the article claims.
The mass-equivalent from global warming is not due to the energy released by combustion, but rather to the excess heat trapped by the greenhouse effect. The latter is about 100 times bigger than the former (rough calculation).
You are, at least, correct in saying that the mass equivalent of global warming is probably dwarfed by the error bars on the Earth's net mass budget.
-
Re:Good grief. Religious zealots really annoy me.
Your innumerate ranting about needing to do math refused to do any math. And come on, merely mentioning global warming's contribution to the Earth's mass budget makes one a zealot? Sounds like you have an axe to grind. Who's the zealot here?
Let me do the math for you.
Cumulative ocean heat uptake through the latter half of the 20th century, largely due to global warming, is about 1.5 * 10^23 Joules for the upper 700 meters of the ocean alone (referencerough calculation).
You are, at least, correct in saying that the mass equivalent of global warming is probably dwarfed by the error bars on the Earth's net mass budget.
-
Re:Wait a minute here...
From the article:
About 460 million years ago, the concentration of CO2 in the atmosphere ranged somewhere between 14 and 22 times the current level, and the average global temperature was about 5C higher than it is now.
From www.globalchange.gov:
Based on scenarios that do not assume explicit climate policies to reduce greenhouse gas emissions, global average temperature is projected to rise by 2 to 11.5F by the end of this century
Taking the data on trends in carbon dioxide measured at Mauna Loa, the 1960 concentration of CO2 was 320ppm. Taking an extreme value for annual increase in CO2 from their data of 2 ppm, doubling the CO2 concentration from the 1960 value wuold take 150 years, and increasing it to fourteen times the 1960 value -- a (low estimate) CO2 concentration at which the average global temperature was 5C higher -- would take almost 2000 years. But we're expected to believe the AGW doomcriers that, according to their tight, rigid, and scientifically-accurate climate models, we might see an increase of 6.4C by the end of the century with a tenth the amount of CO2 in the atmosphere?
And everyone running down the AGW skeptics wonders why we find it difficult to believe the reports 'proving' AGW and painting doomsday scenarios if we don't pour trillions of dollars into reducing CO2 emissions. Or even if we do pour trillions of dollars into reducing CO2 emissions, if you believe the reports that say we've already passed a tipping point.
-
Re:Anti-Climate-Change is the Core message
It isn't a problem with theoretical physics. It isn't a problem at all. If having post hoc explanations is a problem for a theory then no theory in existence meets your insane standard. The problem is when people aren't aware that an explanation is essentially post hoc (like say certain cosmologists attitude towards dark matter). There are, admittedly somewhat theoretically ugly, approaches to unifying physics that treat GR as sacrosanct and modify quantum mechanics. So no, it isn't obvious at all that general relativity is in disagreement with experiment. It is obvious that either quantum mechanics, or general relativity or both have problems, but it is not clear where those problems lie.
Last time I looked there were plenty of predictions kicking about regarding local changes in temperatures over the next 100 years, so we can put that one to bed (heck you yourself suggest cyclone frequency is a prediction of global warming). Talking about global average temperature as though it is the only thing these models predict strongly suggests to me that you haven't actually read the literature. Weather only matter to plants or animals on a day to day basis. Climate is what matters over the course of a year or so. You tell me it will be a couple of degrees hotter in some region on average I can go calculate what impact that will have on crop yields. So no, climate science predictions are useful.
CO2 lagging temperature changes in the ice core record is a prediction of climate science, not a problem. The end of this paper does a decent enough job explaining why:
http://icebubbles.ucsd.edu/Publications/CaillonTermIII.pdfOcean heat content has been rising, for an explanation see
ftp://ftp.nodc.noaa.gov/pub/data.nodc/woa/PUBLICATIONS/grlheat08.pdfWhether or not recent trends in global average temperature are wholly consistent with existing models is in dispute. Phil Jones certainly thinks that the existing anomaly is a problem, others disagree. I'm not in a position to comment since I'm not current on that. What I can point out is that suggesting that a dispute about small anomalies in the present data somehow invalidates the entirety of climate science is absurd.
Reductions in cyclone frequency, and increase in intensity, is a prediction not a refutation
http://www.nature.com/ngeo/journal/v3/n3/full/ngeo779.html
Worth keeping in mind that to my knowledge these predictions are still considered a bit questionable, and variability in the cyclone record makes this kind of thing difficult, but I'm not exactly current on that so don't quote me.The impact of the UHI effect is negligible
http://www.ncdc.noaa.gov/oa/climate/research/population/article2abstract.pdfFinding these things papers took all of five minutes. If you had wanted to know what climatologists actually think you could have done the same. I grant you reading these papers took me a while (although I had read two before so it wasn't that big a deal), but why am I doing this for you? Stop parroting denialists websites, read the damn papers and develop an informed opinion. If you want to come back with objections then I will be all ears but repeating some bullshit a meteorologist, lawyer or an economist told as though it was an informed opinion just makes you look like a prat.
-
Re:I am not worried about it
Certainly, as news has become more global we have learned about more extreme weather events, but when you look at the actual statistics, there has not been any increase. There just hasn't. In fact, hurricane and typhoon activity have been at a 40-year low.
That doesn't really match what NOAA is saying.
-
Re:I am not worried about itbullshit.
From extreme drought, heat waves and floods to unprecedented tornado outbreaks, hurricanes, wildfires and winter storms, a record 14 weather and climate disasters in 2011 each caused $1 billion or more in damages — and most regrettably, loss of human lives and property
-
Re:WRONG - "exhaled at high concentrations"
First you are looking at old data. The current mean CO2 in the atmosphere is not 393 parts per million ( http://www.esrl.noaa.gov/gmd/ccgg/trends/ ). Second, the volume of all the lungs in the world is a very tiny percentage of the entire atmosphere and certainly far smaller than the 33,000,000,000 tons of carbon dioxide put out through the burning of fossil fuels. Its basically totally irrelevant to the phenomenon under discussion. As a consequence, your sophism is irrelevant.
-
Re:I am not worried about it
According to the NOAA, 9 of the 10 warmest years since 1880 (the first year we kept records) have been since 2000. And they've all been in the top 13.
But it's the personal anecdotal evidence that people really respond to. And this is the year where Winter skipped the east coast. The past few years have been off, but it's crazy now. Everyone seems to see the weather doing something bonkers.
Last year here in australia was frigging insane. We had in perth, a straight month higher than 40c temperatures everyday in perth, in a city usually renowned for its mild and non-extreme weather, and god damn it, its starting to happen again (summer is december-febuary in aust). Totally excruciating, and utterly unprecedented. Something *very* wierd is happening with the weather.
-
Re:I am not worried about it
Ahem... except... you should look up the actual statistics. We have not been experiencing an increase in extreme weather.
Actual statistics don't seem to agree with you:
http://www.ncdc.noaa.gov/oa/reports/billionz.html
NCDC reports there were 14 billion dollar weather/climate disasters in 2011, compared to 4-5 the previous 15 years, and compared to 1-2 per year before that. The '80s had 4 years with no $billion disasters; the 2000's didn't have any.
-
Re:I am not worried about it
According to the NOAA, 9 of the 10 warmest years since 1880 (the first year we kept records) have been since 2000. And they've all been in the top 13.
But it's the personal anecdotal evidence that people really respond to. And this is the year where Winter skipped the east coast. The past few years have been off, but it's crazy now. Everyone seems to see the weather doing something bonkers.
-
Solar maximum
We are not even yet at the predicted maximum of the solar cycle. Such coronal mass ejections will probably get more and more frequent until we get to the solar maximum. Now do not get me wrong, I like solar flares as much as anybody here, but we shouldn't really report bursts that miss Earth... or else, we are going to hear about them very often in the near future !
-
And I stand corrected ...
It seems that NOAA started classifying events from their Space Weather Prediction Center last cycle, but it's not considered of 'science quality' like the flare classifications, so the community I deal with doesn't care about them.
There are three scales, all from 1 to 5, prefixed by G for Geomagnetic Storms, S for Solar Radiation, and R for Radio Blackouts.
So, high R (eg, R4) would be 'GPS doesn't work', S would be 'could kill people in space' (or satellites), and G would be the stuff that could induce current into electrical systems.
So, to summarize:
- C, M, X : x-ray flare energy level (with numbers 1 to 9.9 for C&M, but no limit on X)
- F, N, B : h-alpha flare 'importance' (numbers going from 0 to 4)
- G, S, R : predicted impact at Earth (numbers 1 to 5)
And NOAA still has 17 letters left to come up with more confusing scales.
-
Re:There is no denying the Earth is getting hotter
Of course the earth has gotten hotter; of course human activity is the major cause; of course we must fix it.
BUT, I cannot abide people who write statistical summaries (even non-false ones) for shock value. Sure, 2011 was "the 9th hottest year out of the past 130", but it's also true that 2011 was cooler than 9 of the past 14 years.
Tired as I am of trying to enlighten fools, I still say we should stick to the heart of the statistics and eschew convenient sophistry. We'll leave that for our opponents.
-
Re:The open question...
moving goalposts every time they are proven wrong
Let me guess, since 2011 was the ninth, hottest since whatever ;
The year 2008 tied with 2001 as the eighth warmest year on record for -
Re:Sampling Size Change
NOAA use to have a site showing a graphic similar to this one (of the decrease in weather stations, no comparison to observations):
http://www.americanthinker.com/DAleo_Station_Dropout.jpg
But they removed it and setup a FAQ explaining away the drop.
http://www.noaa.gov/features/02_monitoring/weather_stations.html
Anyway, as sample size decreases, the confidence interval increases and by power law the mean of a sample will increase as well typically inverse to the general trend. -
Re:Denial.
I don't recall us closing any ozone holes... By contrast, according to the wikis, the ozone layer is thinning in the Arctic now as well. I'm not disagreeing with the majority of what you're stating, simply stating that I don't believe there have been any effective policies put in place to mitigate it.
From the "Scientific Assessment of Ozone Depletion 2006, Executive Summary"
The previous Assessment presented evidence that the tropospheric abundances of most ozone-depleting substances, as well as of stratospheric chlorine, were stable or decreasing due to actions taken under the Montreal Protocol (see schematic Figure 1a, b), with the stratospheric abundances showing a time lag due to the time for surface emissions to reach the stratosphere. Based on these facts, it was stated that "The Montreal Protocol is working, and the ozone-layer depletion from the Protocol's controlled substances is expected to begin to ameliorate within the next decade or so
(My emphasis)
Patience, grasshopper. -
Glancing blow only
From http://www.swpc.noaa.gov/
"2012-01-20 16:35 G1 (Minor) Geomagnetic Storm Possible January 23
SWPC Forecasters have determined that the CME from NOAA Region 1402 near disk center yesterday will likely pass above (north) of Earth. This glancing blow will cause just G1 (Minor) Geomagnetic Storm activity. Look for the first signs of it around 1800Z (1:00 pm EST) on Sunday, January 22, with the bulk of the disturbance to occur Monday, January 23."
-
Re:Aurora
Probably not, unless you live at a pretty high latitude. If it's not cloudy and doesn't cool off from the current balmy temperature of -35F, then I'll be out taking pictures on Sunday.
-
It is likely to miss
If you are interested in such matters, you will follow the Space Weather Prediction Center site. Here is their latest advisory:
SWPC Forecasters have determined that the CME from NOAA Region 1402 near disk center yesterday will likely pass above (north) of Earth. This glancing blow will cause just G1 (Minor) Geomagnetic Storm activity. Look for the first signs of it around 1800Z (1:00 pm EST) on Sunday, January 22, with the bulk of the disturbance to occur Monday, January 23. Watch here for updates. -
Re:It's much bigger than you think.
Sorry you are correct, I was confusing that paper with Menne et al's On the reliability of the U.S. surface temperature record, submitted Aug 2009, which credits Watts not co-authors him.
Yup, Watts bitched about Menne et al.
Then co-authored a paper that shows the same result.
Odd.
I do believe that Judith Curry was in the position of having objections to one or more of the BEST papers that she was listed as a co-author on.
Come on, you've fucked up once, don't do it again. I've shown that your "beliefs" don't always correspond to reality. (You may be right - Curry is such a hack it's possible she does object to one of her own papers, but lets have a link).
-
Re:It's much bigger than you think.
Sorry you are correct, I was confusing that paper with Menne et al's On the reliability of the U.S. surface temperature record, submitted Aug 2009, which credits Watts not co-authors him. I do believe that Judith Curry was in the position of having objections to one or more of the BEST papers that she was listed as a co-author on.
-
Re:Isn't that anti-science?
-
Re:Isn't that anti-science?
The vast majority isn't collected by a "researcher", biased or otherwise;
The National Weather Service (NWS) Cooperative Observer Program (COOP) is truly the Nation's weather and climate observing network of, by and for the people. More than 11,000 volunteers take observations on farms, in urban and suburban areas, National Parks, seashores, and mountaintops. The data are truly representative of where people live, work and play.
and that's usually the better data.
-
Re:Isn't that anti-science?
What is *your* falsifiable hypothesis statement of Catastrophic Anthropogenic Global Warming?
Do you believe that the only way science gets done is via experiment?
What would you suggest as a control for Earth?
What is *your* falsifiable hypothesis statement of Catastrophic Anthropogenic Global Warming?
You're asking the wrong guy. Trying to make points by asking a non-scientist a scientific question. I don't do original research. I make decisions based on the work of those who do. Maybe you should ask These guys.
If they can't help you, get back to me, and I'll see if I can't put you in touch with some other climate scientists. Of course, I suppose your certainty that all those guys just "aren't doing science" would probably make you disregard their answer, so maybe I can't help you after all.
-
Re:Oxidizer, not fuel
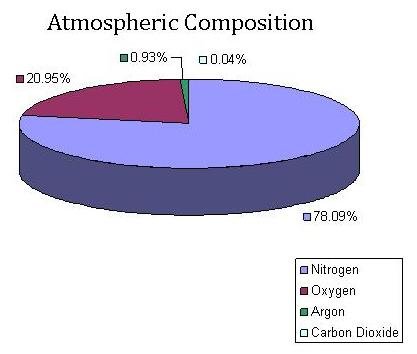
All our definitions are oriented around our nitrogen-based atmosphere.
-
Re:hmm
Their argument is actually that the slight warming caused by CO2 will increase the water vapor in the atmosphere, which will cause the lion's share of the continued warming, until they hit a tripping point in the arctic that'll release megatons of frozen methane which will lead to a catastrophic warming event. Depending on who you listen too climate sensitivity is between 1.4 to 2.5; if we look at 2, it means that for each doubling of CO2, the mean global temperature goes up 2 K
Best estimate for absolute global mean for 1951-1980 is 14.0 deg-C
1980 338.68 PPM CO2
our present CO2 is 391.57PPM, when it get to 677 PPM the temperature would be expected to be 16 deg-C if they are correct. To get to 18 deg-C CO2 would have to go up to 1354PPM. Most of those clowns don't have a clue what the science they say is settled actually is. -
Aurora location
Aurora occur in rings centered on the magnetic poles, not at the magnetic poles themselves. As activity intensifies, the radius of these rings increases, in parallel with lines of geomagnetic latitude, but even in periods of very low solar activity their radius never goes to near zero -- meaning, there are few aurora near the magnetic poles themselves.
-
Re:U.S. is established on religion, so
Thanks; in the same spirit of mutual respect, let me point out that it's just as unlikely for the layperson to have an insight that has never occurred the academic community in a particular field, as it is for a "civilian" to come up with some clever technique that plumbers or carpenters or electricians or mechanics or programmers never thought of. This includes such insights as the everpopular "the AGW people forgot to take into account the changes in the sun!" of course, but also such runner ups as "they didn't account for heat islands".
"3.2.2.2 Urban Heat Islands and Land Use Effects
Studies that have looked at hemispheric and global scales conclude that any urban-related trend is an order of magnitude smaller than decadal and longer time-scale trends evident in the series (e.g., Jones et al., 1990; Peterson et al., 1999). This result could partly be attributed to the omission from the gridded data set of a small number of sites (http://www.ipcc.ch/pdf/assessment-report/ar4/wg1/ar4-wg1-chapter3.pdf p.243see also
the famous Peterson 2003 paper, abstract only http://www.ncdc.noaa.gov/oa/climate/research/population/article2abstract.pdf"We show examples of the UHIs at London and Vienna, where city center sites are warmer than surrounding rural locations. Both of these UHIs however do not contribute to warming trends over the 20th century because the influences of the cities on surface temperatures have not changed over this time." (abstract only; The graphs of temp vs time for several urban vs rural areas are absolutely parallel in rises and drops, but you don't get to see them for free)
http://www.agu.org/pubs/crossref/2008/2008JD009916.shtml"Since the UHI effect is reduced in windy conditions, if the UHI effect was a significant component of the temperature record, then we would see a different rate of warming when observations are stratified by calm or windy conditions. The absence of such an effect (which is what Parker finds) is, conversely, evidence of a minimal UHI effect on the record."
http://www.realclimate.org/index.php?p=43" We find evidence of local human effects ("urban warming") even in suburban and small-town surface air temperature records, but the effect is modest in magnitude and conceivably could be an artifact of inhomogeneities in the station records."
http://pubs.giss.nasa.gov/cgi-bin/abstract.cgi?id=ha02300aOf course, one picture etc. etc.... so look here http://data.giss.nasa.gov/gistemp/2005/2005cal_fig1.gif and try to correlate that with urbanization; Note that the urbanized areas of the globe tend to be middle of the pack for warming; when the oceanic areas (which naturally warm less) are eliminated, you see that the urban areas tend to be on the low side of land surface warming estimates, which makes sense since the warming is, as predicted, larger near the poles, where urbanization is minimal. To put it another way; if you deleted all urban areas from the warming estimates on the grounds of eliminating urban heat islands, that would have the effect of raising the land warming estimate, not reducing it.
-
Re:Weather, not climate
I suggest you start with the Menne 2010 paper that compares surface stations that were considered well placed with poorly placed stations. The adjusted data from the poorly placed stations actually introduced a slight cooling bias compared to the well placed stations.
Oh, don't read Menne, he's a notorious warmist.
Go check out Fall et al, 2011, co-authored by the great Anthony Watts.
Which found that the poorly sited stations gave the same results as the good ones.
http://pielkeclimatesci.files.wordpress.com/2011/07/r-367.pdf
-
Re:Weather, not climate
Same AC here (I spent a bunch of mod points in this discussion.)
What do you mean the compensations applied are not fully testable in a scientific way? If you want to know how the poorly located surface stations have been compensated for then just read the papers that describe the compensations they applied. I suggest you start with the Menne 2010 paper that compares surface stations that were considered well placed with poorly placed stations. The adjusted data from the poorly placed stations actually introduced a slight cooling bias compared to the well placed stations. There are any number of papers published on the techniques used to compensate for extraneous factors in the temperature record. You just have to do a little digging to find them.
-
Re:naysayers
They don't point to research of climatologists to show the earth has always experienced climate change, they point to the research of geologists.
Apparently you have never heard of paleoclimatology.
That sounds like a newly made-up splinter denomination to me. In fact, they pretty much admit right there that they made it up in order to promote climate change. I guess they felt like the actual scientists that have expertise in geology just weren't following the script.
-
Re:naysayers
They don't point to research of climatologists to show the earth has always experienced climate change, they point to the research of geologists.
Apparently you have never heard of paleoclimatology.
-
Re:"Earlier than expected"?
I'll be honest I just looked at the graphs from Mauna Loa and the data itself and to my eye it's been pretty flat since early 2009, do you have a reference for you claim? I always understood that the cap and traders were blaming the flat CO2 levels on everybody's economies being in the crapper.
-
Re:first
The problem is most of the ocean is dark. Like, really, really, dark. The depth alone isn't a problem. The darkness, combined with the extremely limited visibility, is. You can see the entire surface of the moon from, well, just step outside on a night with a full moon. The bottom of ocean? Not so much. You can even make a precise survey of the lunar surface's height using laser rangefinding. Down to about 40m (vertical, 100m horizontal), which isn't bad at all. The closest thing for the ocean is sonar, and that is nowhere near as precise.
Don't remember where I heard it, but some scientist once commented that we know more about the surface of Mars than we do about our own ocean. It is surprisingly difficult to survey the ocean. According to the NOAA: "Yet for all of our reliance on the ocean, 95 percent of this realm remains unexplored, unseen by human eyes." (source). There is a reason we are still discovering new life in the ocean (and a lot of it too).
-
Re:Why do scientists make these statements?
-
Re:How did they get there?
[3] Incidentally, the same is true of the early Earth. Creationists like to point out the unlikelihood of life arising because of the low odds of the right chemical conditions arising - but with thousands of lighting strikes (to take one proposed cause) occurring daily in a wide variety of locations
Actually, according to the NOAA Severe Storms Lab, lightning strikes the ground of the Earth about eight MILLION times a day. So, a lot more chances than you suggested!
-
Re:And half the Arctic countries don't care
Coral reefs are bleached by warm and/or cold water, fully natural events from which they rebuild quickly. The pH level varies over the earth's oceans by orders of magnitude more than the change we think we might've seen over the last few centuries.
http://coralreef.noaa.gov/aboutcrcp/news/featuredstories/jan10/flbleaching/
-
LOL
Aren't we still measuring CO2 in Parts per Million? http://www.esrl.noaa.gov/gmd/ccgg/trends/
-
Sea Level trend at New York harbor since 1857
US government's National Oceanic and Atmospheric Administration (NOAA) keeps track of sea levels over time at various harbors. New York's Battery station data goes back to 1857. While I understand that raw sea level change has more inputs than the CO2 cycle, it is interesting to note that the rise is quite linear at the rate of 0.91 feet per hundred years (0.277 meters per hundred years). There are no unusual changes to the rate during or after periods of rapid CO2 increase (WWII or the post-war boom).
http://co-ops.nos.noaa.gov/sltrends/sltrends_station.shtml?stnid=8518750%20The%20Battery,%20NY
-
Burn it down
It may be cool, but I'm a ham radio operator and if you build this thing anywhere within 10 miles of my house, I will come over and burn it down.
This is just a toy for rich techies. There are plenty of places where lightning is frequent enough that if you build a structure to attract it, you will get lots of hits from the real thing: