 Slashdot Mirror
Domain: noaa.gov
Stories and comments across the archive that link to noaa.gov.
Comments · 2,602
-
Re:What was wrong...
Actually, no, that's not correct at all. Even as Katrina was crossing south Florida, three day forecasts were pretty far off. The forecasts certainly didn't call for it to become a major hurricane. Here are some forecast graphics for you:
http://www.nhc.noaa.gov/archive/2005/graphics/AT12/10.AL1205W5.GIF
http://www.nhc.noaa.gov/archive/2005/graphics/AT12/10.AL1205I.GIFThe three day forecast called for a category 2 hurricane moving in the general direction of Panama City, FL. The rapid intensification of a number of hurricanes that year wasn't predicted well. You can animate the graphics for yourself, if you'd like. Here's a link: http://www.nhc.noaa.gov/archive/2005/KATRINA_graphics.shtml.
The rapid intensification of Rita wasn't forecast well at all. Forecasts predicted it hitting south Texas for awhile rather than near the Texas/Louisiana border. Rita was forecast to become a major hurricane, but not as strong as it became.
The forecast track of Wilma was actually really good. However, the rapid intensification from a minimal category 1 hurricane to a 175 mph category 5 hurricane in 24 hours wasn't forecast at all.
All the NHC forecasts for 2005 are archived at http://www.nhc.noaa.gov/archive/2005/. If you look at the strongest hurricanes that year, you'll see that the rapid intensification cycles were pretty much not in the official forecasts at all. The track forecasts weren't great, but generally were just within the margin of error.
The hurricane forecasts in 2005 left a lot to be desired. Pretty much nobody knew several days before those storms how bad they were going to be.
-
Re:Hey, that's great!
Hurricane forecast accuracy has bee steadily improving over the years, and now can include forecasts out much further in time than before.
-
Re:It is now warmer than the '90s
Incidentally, if you are not a fan of the MBH study, there are hundreds of others you can look at. They all paint a similar picture. NOAA has compiled a list of 370 here for your perusal. Original data and metadata are included: https://www.ncdc.noaa.gov/cdo/...
-
Re:there is no climate change ? who said that?
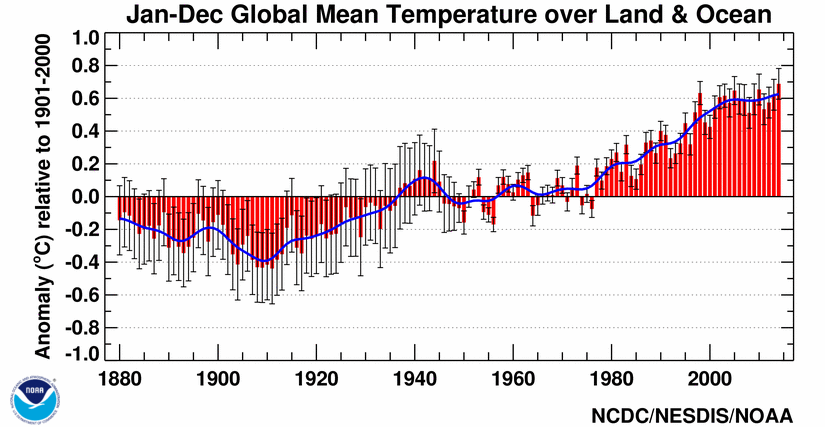
"He's talking about people who deny climate changed in the past twenty years, or even in the past 100." That applies to both sides. When people point to a 15 year stabilization of temperatures as evidence in the climate change debate
Is there a reason why you use outdated evidence - apart from the obvious? Just one year later and the "stabilization" isn't quite that obvious.
-
Re:there is no climate change ? who said that?
That applies to both sides.
Potentially, but not as much as you seem to think
When people point to a 15 year stabilization of temperatures as evidence in the climate change debate, the frequent response is "that's not climate, that's weather" or "that's normal variation."
The problem is those responses are actually reasonably true. In a noisy data set like yearly temperatures, we expect there to be periods of slow temperature growth and periods of fast temperature growth due to short term variability so "that's not climate, that's weather" is true, 30 year averages are generally used to minimize year-to-year variability that can drown out the long term trend. We have had a confluence of natural factors working together to slow the surface air temperature growth over that period. Perhaps more importantly it's important to look at more than just the air temperature since the atmosphere only contains a small fraction of the heat content the earth can store.
Or when they point out evidence that it was just as warm 1000 years ago as today, it will be derisively dismissed.
That's a northern hemisphere temperature reconstruction, so it only covers half the world, and one of the authors of that paper, F. C. Ljungqvist, doesn't agree with your analysis:
Since AD 1990, though, average temperatures in the extra-tropical Northern Hemisphere exceed those of any other warm decades the last two millennia, even the peak of the Medieval Warm Period”
But then there are those on the same side who will mention a 20-100 year period because it suits their argument.
Potentially, but those are periods that are long enough to cancel out year-to-year variability, though, I can't actually remember seeing anyone use a period that was longer than 30 years. Maybe it's not that the period suits the argument but that when you look at periods longer than 20 years, the evidence strongly supports one side in this debate? If that's the case, then the people who look at and accept the evidence have little choice but to end up on the same side of this debate?
Oh how I wish people would stop quoting skepticalscience as if a blog is a scientific resource.
Skeptical science says exactly would you did, and most of what they say is sourced against another blog(RealClimate.org) which was at least started by a pair of actual scientists, but is still itself not subject to peer review either and really does not belong in your exhibit of evidences. This is is what is WRONG with the whole 'debate'. Way too many folks believe themselves to be protecting and promoting the science while waving their hands at blogs and re-hashing the summaries from them.
One of the scientists that started RealClimate is Michael Mann, here is his latest article on historic temperatures. Mann is (in)famous for the hockey stick graph. In his latest work here he's gone a long ways to trying to improve upon his original paper and although he only graphs the NA trend(citing that the SA data is of much lower quality), it very clearly shows temperatures as measured by proxy records matched or exceeded todays temperatures on multiple occasions in the last 2k years. He tries to down play this, but the data speaks for itself. Mann even notes himself that However, in the case of the early calibration/late validation CP
-
Re:there is no climate change ? who said that?
That applies to both sides.
Potentially, but not as much as you seem to think
When people point to a 15 year stabilization of temperatures as evidence in the climate change debate, the frequent response is "that's not climate, that's weather" or "that's normal variation."
The problem is those responses are actually reasonably true. In a noisy data set like yearly temperatures, we expect there to be periods of slow temperature growth and periods of fast temperature growth due to short term variability so "that's not climate, that's weather" is true, 30 year averages are generally used to minimize year-to-year variability that can drown out the long term trend. We have had a confluence of natural factors working together to slow the surface air temperature growth over that period. Perhaps more importantly it's important to look at more than just the air temperature since the atmosphere only contains a small fraction of the heat content the earth can store.
Or when they point out evidence that it was just as warm 1000 years ago as today, it will be derisively dismissed.
That's a northern hemisphere temperature reconstruction, so it only covers half the world, and one of the authors of that paper, F. C. Ljungqvist, doesn't agree with your analysis:
Since AD 1990, though, average temperatures in the extra-tropical Northern Hemisphere exceed those of any other warm decades the last two millennia, even the peak of the Medieval Warm Period”
But then there are those on the same side who will mention a 20-100 year period because it suits their argument.
Potentially, but those are periods that are long enough to cancel out year-to-year variability, though, I can't actually remember seeing anyone use a period that was longer than 30 years. Maybe it's not that the period suits the argument but that when you look at periods longer than 20 years, the evidence strongly supports one side in this debate? If that's the case, then the people who look at and accept the evidence have little choice but to end up on the same side of this debate?
-
Re:there is no climate change ? who said that?
"He's talking about people who deny climate changed in the past twenty years, or even in the past 100."
That applies to both sides. When people point to a 15 year stabilization of temperatures as evidence in the climate change debate, the frequent response is "that's not climate, that's weather" or "that's normal variation." Or when they point out evidence that it was just as warm 1000 years ago as today, it will be derisively dismissed.
But then there are those on the same side who will mention a 20-100 year period because it suits their argument. -
Re:approval
Well, don't just blindly trust the Fox News story here.
As to the claim that they didn't give reasons...
http://www.nmfs.noaa.gov/pr/pe...
All of the documents are there, including the public comment, and the response from the company to the public comments, and the denial letter.
http://www.nmfs.noaa.gov/pr/pe...
http://www.nmfs.noaa.gov/pr/pe...I find their responses to the public comments to be evasive, dishonest, and confrontational. They make no attempt to seriously address the issues in a way that could lead to compromise solutions or mitigation of problems.
They give a bunch of reasons for denial. And they didn't approve it and then unapprove it, either; they processed the application and denied it. The whales were captured in Russia before the permit application. Fox News would prefer it to be ambiguous so that it sounds like the big bad Gubermint is hurting everybody by changing their minds. But that didn't happen.
Remember, the default thing with importing marine mammals for public display is that you can't do it. You can't just buy a marine mammal and build an aquarium. You need special permission, because these are intelligent animals who are under continued population stress due to human activity. People have gone to great lengths to afford them some minor protections. You need to get a permit, and it needs to be in the public interest. This company seems to think that they have a right to import marine mammals, but they simply don't. That isn't a right. The government has a significant interest in regulating foreign trade.
Why does Fox News care? Because evul libraaals want to save whales.
https://www.change.org/p/noaa-...
There was no approval before the denial. They applied, the public commented, the agency considered, and they denied it. Which is what most of the public wanted in this case. I don't even understand their claim; how could they have approval already before the required public comment period, etc? It makes no sense at all. They knew the process going in; the person doing the review recommended denial, and the Agency agreed and denied. It is a requirement of the law that in order to issue such a permit, it has to not have a negative impact on the species. In this case, these are whales being captured in the wild purely to sell to zoos, and so supporting that trade has a small but negative impact on the species. There is no positive conservation goal identified that balances that. It is purely for entertainment. That is banned under the law where it has any negative impact on the species. In other cases, whales that are threatened in the wild are captured to be used in captive breeding programs that are believed to have a net positive impact on the species. That means it is legal for NOAA to issue the permit in those cases. The Beluga population is not benefiting or expected to benefit from any such breeding program.
-
Re:What did friday come late or early ?
If you look at the raw temp data for the U.S. we have been in a cooling trend for the past 115 years
ftp://ftp.ncdc.noaa.gov/pub/da...
Even if that were true - you are ignoring the fact that most station observations in the US were moved from the afternoon (when it is warm) to the morning (when it is not). If you ignore this change, all you have shown is that the mornings in the US are now as warm as the afternoons were 115 years ago.
-
Re:Obama should do a fact check...
> First, we aren't feeling the impact of climate change. For all the fear mongering, the oceans haven't risen,
They have. http://oceanservice.noaa.gov/f...
> the weather is fine,
It's not. http://www.forbes.com/sites/je...
> and life has been carrying on.
'Struggling' would be a better word: http://news.stanford.edu/news/...
And we are just seeing the beginning of these problems. The predictions of the IPCC are actually quite conservative. The reality is likely to be much worse. This isn't fear-mongering; I'm not talking about fire and brimstone and mass anarchy. Humans can adapt. But we will have to deal with mass migrations, destruction of large areas of crop land, and a potentially very harmful loss of biodiversity. These are facts which we can state with certainty; the only uncertainty is just how deep the wound will eventually go before we actually do something about it.
-
Re:Obama should do a fact check...
First, we aren't feeling the impact of climate change. For all the fear mongering, the oceans haven't risen, the weather is fine, and life has been carrying on.
first- we are feeling the impact of climate change. oh i'm sorry, have i interfered with your unsupported assertion by making my own unsupported assertion ?
the oceans have risen:
http://oceanservice.noaa.gov/f...
Sea levels have been rising over the 20th century. This, and a host of other evidence say we _are_ experiencing the effects of climate change.
yes, life is carrying on. and it will continue to carry on even at such time as that carrying on becomes very, very difficult. so what the hell is your point ?
At this point, we're just moving the deck chairs around the Titanic, or perhaps put another way, we using a bucket brigade to try and get the water out of the ship. Nice idea, but pointless when the ship is still going to sink.
The standard denier bullshit. We can't do anything , we should just get over it. Except that the standard denier bullshit used to be "there is no climate change". Now, it's "oh yeah, maybe there is, but we should just get used to it".
By doing something NOW, we can make future impact less. BTW, what exactly do you have against dumping more shit into the air ? remember when they put lead in gasoline ? Should we have just left it in , because we had already dumped so much into the environment that it was "too late" to do anything about it ?
If the AGW people are wrong, then this is just a wealth transfer and overreaching power grab from big government.
your true slashdot, libertarian colors revealed.
-
Re:What did friday come late or early ?
Hmm. Who is better at interpreting NOAA data sets. Crashmarik on slashdot or NOAA https://www.ncdc.noaa.gov/moni... ?
-
Re:What did friday come late or early ?
If you look at the raw temp data for the U.S. we have been in a cooling trend for the past 115 years
ftp://ftp.ncdc.noaa.gov/pub/da...
If you compare the adjustments to the trend the adjustments are actually bigger than the error bars and larger than the raw data's trend.
What is it we are supposed to be mitigating ?
-
Re:Seems like a piece is missing
The amount of land isn't as important as the location. The land gives the country an exclusive economic zone which extends 200 nm out from the land. When claims by neighboring land conflicts, if the countries can't come to a mutual agreement the line is usually drawn equidistant from the nearest land . That's whay the line for the territorial waters between the U.S. and Mexico angles slightly north of the U.S.-Mexico border (the nearby Coronado Islands just offshore belong to Mexico), before angling sharply south (San Clemente Island further offshore belongs to the U.S.).
Countries cannot restrict passage through the exclusive economic zone, but they can regulate economic activity that occurs there - mainly fishing and mining (oil drilling). So islands in the right location are a big deal. The Japanese spent millions setting up a breakwater around a couple rocks because they were Japanese land and gave them exclusive fishing rights to over a hundred thousand square miles of ocean. The rocks were in danger of collapsing into the sea from wave erosion.
To qualify as land, it has to remain above sea level at high tide. Dumping sand atop underwater corals to create islands isn't generally recognized as legitimate land despite China's claims to the contrary, and would establish a very bad precedent if it were allowed. If that's the way China wants to play, the U.S. could in theory build a new island just off of mainland China and take away a huge swath of ocean territory from China. That's a can of worms you don't want to open. That's why the U.S. has been very clear in stressing that it doesn't recognize this as a legitimate "island," to the point of flying navy aircraft right over it. -
Re:Sinking island
The sad point is that by killing the coral reef they are destroying the ocean's ecosystem. Forget about the military implications, this is something that the international community needs to stand up and punish China for.
Even though coral reefs cover less than one percent of the ocean floor, they support an estimated 25 percent of all marine life, with more than 4,000 species of fish alone. In fact, coral reefs are some of the most diverse ecosystems in the world with thousands of species relying on reefs for survival. They also serve as important sources of food, income, protection, and new medicines for mankind. -
Re: They're not going to arrest him!
You are more likely to get struck by lightning than shot by a gun.
NOAA gives an average of 33 lightning deaths and 297 injuries per year in the US for the years 2004-2013.
GunPolicy.org gives a minimum of 11,068 gun homicides and 64,389 non-fatal gun injuries in any one year over the same time span.
Statistically, a random person in the US is much more likely to be killed or injured by gunfire than struck by lightning.
-
Why does this invalidate carbon dating?
OK, I'm no expert, but I'm not stupid either, and I do read.
Scientists have been using various methods to track how much carbon (among other things) is in the atmosphere by various methods. We've got a record of this going back quite some time. That's how we know, for example, how much carbon was in the atmosphere 300 years ago compared to now.
So if we know how much carbon is in the atmosphere, and we know how much of that is carbon 14 (we are keeping records, right?), then can't we correct for this? Other people have posted about how nuclear tests have increased the carbon 14 in the atmosphere. I'm sure at least these guys are keeping track of it.
It'll take some tweaking to get right, but I'm sure we can account for the difference. Maybe some grad student will use it for their PhD. When there are cases of overlap (the t-shirt dating as 1000 years older), there might be some issues, but for anything truly old it shouldn't be an issue.
-
Re:Actually there is a 34% CHANCE...
As to sources:
https://www.ncdc.noaa.gov/data...
https://www.ncdc.noaa.gov/data...
The GHCN and ERSST the source in the other datasets. Both of which are controlled by the NOAA.
The GHCN is a cooperative effort to combine data sets going back as far as 175 years... It is the source of the land surface data. And the ERSST is used for the sea data.
The primary difference between the datasets is not the source information which is the GHCN/ERSST but rather what sort of adjustments they use to modify the data. Everyone has their own methodology. I won't get into the whole adjustment argument. But I will simply point out that the datasets are not independent if they all have the same source dataset.
There is ONE dataset. And it comes from the NOAA.
As to numbers... As should have been obvious from my first response to you, I am drawing a lot of information sources and none of it is especially well organized in my mind. I'm not trying to get my doctorate here. I'm just trying to figure out what is going on. And from the frankly vast array of information I was taking in... I saw more estimations in the low 30s than I did in the 40s and above. What is more, I believe a bias to cool the figures is valid considering that there is a verifiable bias to cite higher figures than lower ones. When you take all that into consideration... numbers around 35... are tweaked to 30. Why? Because the only counter to a consistent bias is an opposing consistent bias. If a scale always says things are a bit heavier than whatever they actually are then you need to apply an adjustment to the figures recording them as slightly lighter.
As to waiting a minute... my bias corrects from 35 to 30. The figures based on the math alone were showing something around 35 to 38 percent. But given that we've had corrections to the models and the figures going on for years and they always correct them DOWN... I personally decide to read the numbers as being slightly lower than cited if only in anticipation of the next correction.
I think the climate forcing variable is down to 1.3 degrees C if CO2 doubles... which is down from like 5 C. More recently they were saying 4.5... then they ran their numbers again and got to 1.5... and then subtracting other forcing variables it got down to 1.3. So...
There's a lot of hype on this subject. Its very political.
The whole BEST debacle has been annoying for years because their "raw" data turned out to not be raw. And then they refused to actually release the raw data. Though apparently they're saying they're going to do that soon. A few people have confirmed they were actually able to get access to it. So anyway...datasets... there are fewer of them in this field than people realize.
-
Adjustments were minor [Re:The Gods]
This is definitely old news and the answer already known. The "adjusted" data shows it to be the hottest year on record but the original data does not.
If you actually looked at the site, which apparently you didn't, you'd see that both the original and the reanalyzed data show 2015 to be the hottest year on record.
http://data.giss.nasa.gov/gist...As does, for that matter, the data from the Japanese Meteorogical Agency.
And the adjustments are not arbitrary-- they are quite well documented: https://www.ncdc.noaa.gov/data...
-
Re:Actually there is a 34% CHANCE...
Oh... so many places...
First:
http://www.ncdc.noaa.gov/sotc/...Just as an interesting appetizer.
to continue:
http://www.metoffice.gov.uk/ha...Just so you can see where this is starting to come from...
And more:
ftp://podaac.jpl.nasa.gov/allD...And more:
http://www.ncdc.noaa.gov/monit...and more
https://en.wikipedia.org/wiki/...and finally:
http://www.ncdc.noaa.gov/sotc/...Here is the thing... this shit is "estimated"... there are high levels of uncertainty at EVERY step. There is a lot of guestimation going on and that adds up.
What temperature it even was in a given year has a margin of error of AT LEAST
What they do know is that 2014 was warm. It was arguable that it was as warm as the last 5 or so hottest years since 1850... keeping in mind that uncertainty and imprecision INCREASE as we go back farther in the record. By around 1920 the imprecision is so bad it is up to whole degrees. That is... today... they're saying they know to within about
You asked.
They don't know. It... "could" be the hottest year. They're certain to about 30~40 percent... based on which data sets they use. Of course... their data doesn't really go back to 1850 or so with that level of precision. So... maybe a 30 percent chance of being the hottest year in the last 20~30 years?... sounds about right.
-
Re: Coral dies all the time
As to the corrections... this is common knowledge:
Yes, you gave that link already, and I responded. This conversation is going around in circles.
did you look at the spread sheet I sent you?
Yes, and responded with a link to a graph of it.
while you accuse me of cherry picking that hasn't stopped you from doing it
If you can find datasets that are more complete than the ones I've cited, please do link to them. I gave you all the data I could find, including pH & sea level, and I even found different proxy data for you that went back further. Your turn.
As to Vermeer, I don't know why you're taking about him instead of defending the church graph.
It's the same graph! Same dataset, same values, same time period (1870-2010) = same graph.
If you still think it doesn't show an accelerating trend, draw a straight line on it and see how well that fits.
the graph of increase in CO2 in the atmosphere is linear
No, it isn't. Here is the full Mauna Loa CO2 record. And yes, it's accelerating - look at the graph directly below it, which shows atmospheric CO2 growth rate. See how it's now around double what it was in the 60s?
Your "issues" seem to be based around wondering why the results aren't quite what you think they should be. Perhaps it's all just not as simple as that?
-
Re: Coral dies all the time
the sats are calibrated with ground data... Every year their numbers are adjusted up...
No, they're not. The measurements are going up, not the adjustments. The citations you yourself provided show only tiny adjustments to the trend, every few years, going both up and down - while the measured temperature trend is ever upwards.
The calibration is not re-done from scratch every year. That would be meaningless, as you say. The satellite data obviously must be kept comparable, both to itself and to ground measurements, so that any trends can be determined. Give these people some credit, would you? not to mention the expert reviewers who checked their methods.
I can't cross reference that information with any other source
Similar data is in the HadCRU and NASA datasets, not just NOAA. They're all cross-checked with each other and with related evidence. Perhaps you should look harder.
As to Vermeer, that contradicts what was in the Church paper that you cited yourself.
No, it doesn't. Church's Fig 5 and Vermeer's Fig 3 Lower are the same graph, though Vermeer has a blue trend line drawn over the red measurement line. You can see clearly they have the same values at the same decades. Fig 3 Upper is the derivative of that trend line, showing rate of change.
how long do you think CO2 remains in the atmosphere?
Individual molecules of carbon are being re-absorbed - and re-emitted - all the time, by plants and by the ocean, in large quantities (around 200Gt/year). This is normally in equilibrium, with a slow growth from geologic weathering and occasional volcanism. The rates of natural emission and uptake aren't fixed however, due to numerous feedbacks, so the best we can say is between 30 and 95 years for much of it, with perhaps 20% persisting a lot longer (thousands of years). It depends a lot on the atmospheric concentration, and how much we keep releasing. This page discusses the issue and provides lifetime graphs.
If true this implies the CO2 from our sources is being emitted at a lower rate than the biosphere's absorption ability.
Obviously that's not the case, because atmospheric levels have gone up sharply for 150 years See this ice-core data and more recent Mauna Loa data, showing a definite acceleration even in the last 50 years.
Regarding CO2 spectrum absorption, your questions were already answered by the citations I've given. Broad-spectrum sunlight is not only reflected, but also absorbed and re-radiated in infra-red (look up black-body radiation), which is then partially blocked by various greenhouse gases. This is well-understood science going back to the 1800s. and I'm not going to go over it all yet again. I've already cited papers that quantify the measured radiative forcing of CO2. There's no serious debate about this aspect, only about the feedbacks and resulting temperature rise.Regarding ocean acidification, Turley et al 2006 is cited by many. Can't find a link to the paper, but here is a related presentation by Turley - see page 4.
Sorry, but I no longer have the time to spend with long explanations. It's taking too much time from my work. If the many peer-reviewed papers I've already provided haven't convinced you of anything, then providing more won't help. Either you're unable to follow the studies I've cited, or you're unwilling to to accept them as valid evidence, despite peer review and cross-correlation with other evidence. You claim that the broad agreement
-
Re: Coral dies all the time
Well, you took the time to write all that out, so I'll do you the courtesy of a response, but I will point out that none of it is worth saying without citations (which was the entire point of this thread).
You call it "common knowledge", but when it contradicts the published, peer-reviewed results from any number of studies, which are compiled, published and endorsed by organisations like NOAA, CRU, CSIRO, and the IPCC in numerous countries, then your "common knowledge" doesn't seem to be all that common at all. I provided linked citations of reputable sources for my claims, so you'll need data at least as reputable (please, no blogs or news articles). I've heard claims just like yours countless times, and nobody has yet provided any reliable data to back them up.
"[surface temperature stations] are mostly not very accurate" - a vague claim, but in aggregate they can still give a very accurate picture of the temperature trend.
"[satellites] have their readings INCREASED every year...The current "correction" is about
"the depths of the ocean are not warming... It rarely goes below 100 meters much less 200 meters." - the data shows that ocean heat content has been rising steadily down to 2,000m. Below that, NASA finds no significant change. But there's a huge amount of energy going into that top 2km of the world's oceans.
"there is no way to know how much [sea level rise] is the result of a climate change and how much is climate cycle." - well, we know that sea level rise accelerated significantly in the last 150 years. We know that it's consistent with predictions based on thermal expansion and measured ice loss. If it's part of a long-term cycle, there needs to be a cause, and there's no credible evidence of any cyclic cause at that timescale.
"There are regions that are losing ice and regions that are gaining ice... How much ice are you saying has melted... just give me your rough estimate." - Shepherd et al 2012 finds a net ice mass loss of over 200 gigatonnes/year for the last couple of decades, using multiple lines of evidence.
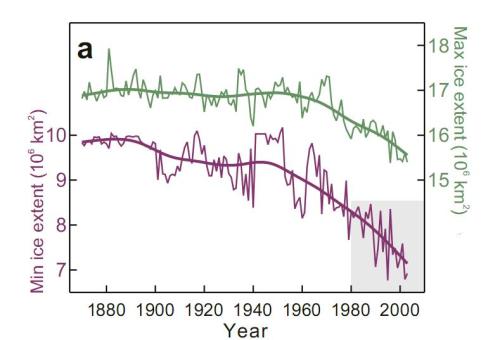
"ice extent is very easy to estimate. And ice extent doesn't show a decline." I cite ice mass because it's what matters, for rising heat content and for sea levels. Ice extent is a fairly inaccurate indicator of overall ice melt. That said, ice extent has been declining in the Arctic and Greenland while increasing in the Antarctic (despite overall ice mass decreasing there by around 70 Gt/y).
"if the ice packs were melting over all to any significant degree you'd see a great deal more sea level rise than we have seen thus far... We can look at the volume of water in the oceans and compare the change to your ice loss figures." - Yes, and it matches well with what we've observed, including accounting for thermal expansion (which, if you're tacitly admitting exists, requires significant ocean warming).
Citations - yes please. At this stage, if you have any further claims to make, I want to see only links to reputable published data and peer-reviewed studies, not talk of "common knowledge" or speculation from laymen or reporters.
-
Re: Coral dies all the time
That's quite a rant there - assumptions, ad hominems, sweeping declarations, invective, ironic projection, the lot. In fact, pretty much everything except data.
Oh you want peer reviewed rebuttals? Done:
Science & Education, really? Remember what I said earlier about crap publications that would publish anything? Yeah. It's not exactly Nature, is it? Where is its peer-review policy anyway?
Shame the article is paywalled so we can't examine it, but these guys did. And if it's the article I think it is, applying Monckton's own peculiar standards for handwaving-away any papers that aren't explicit enough for him, only makes the numbers for rejection of AGW look even tinier, at a mere 9 out of 11,944 papers reviewed. And nowhere is there anything to back your claim that the consensus figures "included papers that argued against climate change".
And of course, Cook's paper isn't the only one that arrived at ~97% consensus - from Oreskes to Powell, they all give similar results. Plus, of course, the long list of scientific institutions that have confirmed the findings of AGW, and none dissenting.
[vague accusations & unsourced claims of bias & corruption omitted]
ice age predictions from the 1970s [...] New York was supposed to be under water by 2015
Ah, specifics. Cite the papers that predicted these, please. Or are you getting misled by bad reporting again?
Every year you get weaker and look more foolish
Every year, the surface temperatures rise, ocean temperatures keep going up, sea levels rise some more, global ice mass keeps decreasing - the ongoing trend is obvious everywhere to anyone who opens their eyes, and comes from climate scientists around the globe who couldn't care less about all that Republicans vs Democrats nonsense. The argument about what to do about global warming is certainly political - but the data aren't, and wild, unsourced claims of massive political bias in the field only make the accusers look like the foolish ones.
-
Re:Coral dies all the time
Specifically to your question then, ocean pH has fluctuated over time... in some cases quite dramatically.
There was an expedition not long ago that was pulling up core samples to get a history of it... the cores went back something like 53 million years. And yeah... the pH moves about quite a bit.
Again, coral is a very ancient species. You don't get species that old unless they're tough sons of bitches.
We're talking about a species that survived vast changes in the earth's biosphere. We're talking about a species that has been preyed upon by an endless procession of species and the coral outlived them all. We're talking about a species that survived the meteor that killed the dinosaurs. We're talking about a species that has lived through many ice ages largely unchanged.
Coral as a collective is extremely tough. As individuals they die to anything. Think bad thoughts about coral and it dies. Say you don't believe in coral without clapping your hands afterwards and that kills fairies and... and coral. Bad breath probably kills coral.
The thing is yes... it is absurdly sensitive to any change in its environment and tends to respond to just about anything by bleaching. However not all the coral dies in any of these situations and the survivors recolonize the reef.
Here is something you can see:
http://coralreef.noaa.gov/abou...
This is talking about how oil spills effected coral reefs in South America and the middle east.
The results were bad when the oil was all over the place. But when the oil was finally digested by the ecosystem... oil is edible to some kinds of bacteria... once the oil was gone... the reefs were fine.
A point on oil specifically... its actually 100 percent fucking natural. Petroleum bubbles up around the world in various places and always has. That is not to say oil spills are fine or we shouldn't care about the poor pelicans that get coated in oil. that's tragic and the oil companies should be penalized for being sloppy with that stuff.
BUUUUT... the ecosystem actually can deal with it. Yes... it will kill birds and fish and fuck up all sorts of things. But the real engine of the planet's biosphere... the bacteria and algae... they don't mind it so much. The bacteria literally can eat it. When we had that big BP spill most of the fish were getting killed due to oxygen deprivation because the bacteria were so active eating the oil that they were using up all the oxygen in the water. IT wasn't the oil killing most of those fish. It was the biosphere digesting the oil that was killing the fish.
Anyway, coral is more similar to the bacteria and the algae than it is similar to the fish. Just like the bacteria or the algae, coral is very easy to kill. You can kill the majority of bacteria in any situation VERY easily. However... killing ALL of it is nearly fucking impossible. And any small amount that survives... will rapidly multiply until whatever numbers were lost are entirely replaced and possibly then some... plus an increasing resistance to whatever you did to kill past generations.
It adapts very quickly.
It is being increasingly pointed out by coral experts that the Maldives for example will not be submerged. Because the coral is responding to the various things going on with the land and water in the area... and ultimately breeding to stay near the surface and trying to create as many reefs around the islands as possible because it suits their biological needs.
-
Re:the battle of the selfless
Ok, let's talk about that then. The first observation is that humanity has only studied the ozone hole for a few decades.
The US began banning the use of CFCs in 1978, and the Antacrtic ozone "hole" wasn't discovered until 1985. Yet somehow the science of CFC impact on atmospheric ozone was conclusive enough for policy makers to act *without* having discovered the cyclical depletion of ozone over the Antarctic. When the situation in the Antarctic was discovered, it certainly didn't weaken the well proven science on CFCs - if anything it strengthened it.
As a result, we aren't even sure it's unusual in extent or duration or if it would get worse in the presence of CFCs
Ozone is destroyed in the presence of CFCs. Period. To say we don't know if ozone depletion would get worse with CFCs present is to deny well researched and well understood chemical reactive processes.
(maybe we have underestimated the production and non-anthropogenic destruction of ozone, for example).
Speculating on *how* the science might be weak doesn't mean the science *is* weak. If you've got something other than your speculation to support your contention, let's see it.
We will never see how much worse off we are because we chose to impair our economy by banning CFCs. Second, we don't know how much refrigeration and air conditioning use has been curbed due to the higher costs of such equipment. But we do know that people routinely die in heat waves from choosing not to run air conditioning.
I could just as easily claim that banning CFCs *improved* the economy, that CFC replacements *lowered* the cost of refrigeration equipment, and that individuals' choice of running their AC has *nothing* to do with the type of refrigerant in their systems. If you want your claims to carry more weight than mine, CITE SOME AUTHORITATIVE SOURCES.
YOU are the one claiming CFC replacements are less efficient for refrigeration than CFCs.
This is common knowledge.
If it's common knowledge, then you should have no problem citing some authority. Right now, you're doing nothing more than asking us all to take your word for it. Over and over and over. You act as though we all recognize you as an expert in these matters. We don't.
CFC replacements are often more chemically reactive (the reactivity greatly reduces the half-life of the chemical in atmosphere, such as HCFCs) and sometimes more hazardous to human health.
FAIL. The greater reactivity of CFC replacements has nothing to do with their efficiency inside the closed loop of a refrigeration system.
Having said that, I do see that a formerly common refrigerant CFC, R-12 was significantly less efficient than it's replacements (such as R-134a).
So I guess the reason you neglected to link to your source on refrigerant efficiency was because the source refutes your argument. Well done!
-
Re:Two problems with this article
First: There is additional supplemental material linked from the article, e.g. http://www.sciencemag.org/cont...
Second: Can you point these out specifically and what indicates this is the authors' "goal" ? Their stated goal is to review the temperature data set. They're reporting what they found. And the data is there to see.
Finally: You're confusing the estimate of the warming in the 20th century with the IPCC's forward estimate of warming in the 21st century. The authors of the paper are stating that the revisions to the data set based on aligning buoy with other temperature measurements mainly affects the period from 1998 forward, where significantly more buoy data was added to the set, that the data for the prior period isn't affected much by these adjustments, and that the resulting trends are similar throughout the period, thus the "hiatus" was an artifact of misaligned data in the data set.
Perhaps you should read up on how the data sets are merged and aligned before assuming it's "massaging." It should all be open and published for review. For example, ERSST version 4 is available here: http://www.esrl.noaa.gov/psd/d...
-
Re:Any materialized predictions? (Re:Sudden?)
Manabe was 14 years ago. Conditions have changed rather significantly in that time, as has our understanding of the geology. It may be that Manabe is still correct. On the other hand, it may not. [Jane Q. Public, 2015-05-22]
No, Jane. Manabe et al. 1991 was 24 years ago. The fact that Manabe was 24 years ago is exactly why I've repeatedly showed it to you. They predicted that Antarctic sea ice would increase in a warming world, but you keep insisting that "The science is faulty at its roots. The models haven’t predicted one thing, in 30+ years.
In addition to the other 17 reasons I gave you, don't you think this is another reason you should reconsider making these baseless accusations?
I've told Jane and economart that Fig. 2(a) from Polyak et al. 2010 shows that the reconstructed Arctic sea ice extent in the 1930s was comparable to that in 1979, and the modern decline is quite clear.
You seem to feel that what "you told people" is necessarily truth. That's an interesting point of view. [Jane Q. Public, 2015-05-22]
Huh? Jane, I just gave you links to peer-reviewed long-term reconstructions of Arctic sea ice extent in response to your insinuations that scientists are deliberately misleading. In response, Jane tries to guess at my feelings about what I "told people".
Instead, you might find it more productive to click on those links and learn about peer-reviewed long-term reconstructions of Arctic sea ice extent. Then maybe you'll be in a better position to judge whether you should dare to accuse scientists of deliberately misleading.
I've also repeatedly explained that Jane's accusations of deliberately misleading cherry-picking are completely backwards. As usual.
You are implying that my statement that 1981 was near a temporal local maximum is incorrect? You would rather use 1930 as your starting point? As opposed to, say, 2000 or 1850? [Jane Q. Public, 2015-05-22]
Good grief, Jane. Once again, I'd rather use all the available data. In the context of using a single dataset, that means using all the data in that dataset. That's why it's so ironic that Jane baselessly accused Layzej of cherry-picking when he loaded the entire UAH dataset, then Jane suggested only using data since 1998. But Jane obviously won't ever be able to grasp this irony, because he just did the
-
Re:Any materialized predictions? (Re:Sudden?)
...antarctic sea ice is at or near a record high... [Jane Q. Public, 2015-05-22]
I've repeatedly told you this is consistent with Manabe et al. 1991 page 811: "... sea surface temperature hardly changes and sea ice slightly increases near the Antarctic Continent in response to the increase of atmospheric carbon dioxide."
... it's a bit of a mystery to me how they can claim that ice is melting due to unusual ocean warming, when we know that ocean surface ice has been at record levels. [Jane Q. Public, 2015-05-22]
I've explained that Manabe et al. attributed the slight Antarctic sea ice increase to increased precipitation in the area. This freshens the frigid surface water and reduces mixing with the warmer water below. Other possibilities include stronger winds which spread out the ice and expose more surface water to be frozen.
Correction: arctic ice is below 1 standard deviation from 1981-2010 average, but within 2 std. deviations. Still, remember that 1981 is a (dare I say deliberately chosen?) high point from which to start measurements, so going by the 1981-2010 average is probably a bit misleading. And the total global ocean ice is still well above normal, because of the record high Antarctic ice right now. [Jane Q. Public, 2015-05-22]
I've told Jane and economart that Fig. 2(a) from Polyak et al. 2010 shows that the reconstructed Arctic sea ice extent in the 1930s was comparable to that in 1979, and the modern decline is quite clear.
I've also repeatedly explained that Jane's accusations of deliberately misleading cherry-picking are completely backwards. As usual.
-
Re:Fight!
Looking at the graph of the CO2, http://www.esrl.noaa.gov/gmd/c... I don't see any signs of slowing down thanks to the changes we've already implemented. Clearly, it's not enough.
I actually agree with you, the changes won't really alter the outcome.
I've come to the conclusion that the increase is irreversible, at least within our lifetimes. All we can do is slow the increase and make long term plans for it.
---
The changes required around the world to actually stop, then reverse, the increase, simply aren't going to happen. One could argue and debate all day long about if they "should" or not, but in reality, it simply isn't in the cards.
Americans can cut all we like, right now Americans produce more than 10 times more CO2 per person than people in India. But given the huge number of people there, it wouldn't take much of an increase to swamp anything we do. We could cut our CO2 to nothing, and they could increase by just 20% and the total CO2 output would be higher than it is today.
-
Re:Fight!
I don't have a problem with any of that... The issue is that the extremist AGW people want to triple all of it and do it tomorrow at any cost...
Looking at the graph of the CO2, http://www.esrl.noaa.gov/gmd/c... I don't see any signs of slowing down thanks to the changes we've already implemented. Clearly, it's not enough.
-
Re:-dafuq, Slashdot?
You go to the article, and of all the links they have, only *two* point to anything that comes even close to scientific
It would be nice if they provided sources, but there is nothing really controversial in the article. The article from 2007 noted that arctic sea ice was diminishing faster than any models had predicted. That has not changed since 2007: http://www.arctic.noaa.gov/rep... .
-
Re:Effect on life?Well, considering that they only exist because of a difference in density between the upper and lower layers involved, the massive movement of colder/saltier/etc water will have a definite impact on what lives in that water.
"Internal waves" are no different than (i.e. obey the same scientific principles as) surface waves. They are both "interfacial waves". The difference is that the air/water density difference is much greater than the water/water density difference.
It has an impact on land-based life as it can drive upwelling, which both causes cooler temperatures near the shore and provides nutrients for sea life.
-
Re:The secret is strictly the software.
Well not entirely. It can be used for navigation but it requires actively communicating with a base station or set of base stations and getting their raw pseudo range data as well as the L2 carrier phase data. From there with some fancy processing and enough compute power you can basically get real-time position accuracy. There is a set of open source programs and libraries that can provide the software necessary. Also if you don't want to setup your own base station there may be one nearby or a set that can be used to create a pseudo station provided either by the state or federal government. I have played around with RTK both with my own base station and using a nearby one (1.5 miles) and the results can give you 2cm resolution in real time with something like a RPi doing the processing. I can't find it at the moment but I remember reading that the buses in the Twin Cities metro area make use of the MN CORS network to accurately track lanes when they are driving down the shoulder.
-
Where has the absence of C13 gone?Take a look at the comparison of C13/C12 ratio with total atmospheric CO2.
http://www.esrl.noaa.gov/gmd/o...
The carbon in plants and in fossil fuels is depleted in the C13 isotope by about 1.8 percent (18 mils). The annual wiggles in the C13 ratio are accounted for by the complementary wiggles in the total CO2 being the update and reemission of CO2 depleted in C13 at that level.
The multi-decade slope of the C13 curve is much more shallow in comparison to the annual wiggles in relation to the same comparison for total CO2. Any number of debunk-the-skeptics Web sites points out that as we emit CO2 depleted in C13, the C13 ratio declines. But not one of these sites offers even a rough quantitative analysis, which would show that CO2 depleted at the fossil level can account for no more than a third of the increase in atmospheric CO2 that is the source of much anxiety.
Is anyone else noticing this?
-
Re:Bit to belabor the obvious
You would be willing to bet that a bunch of experts who have been doing this for 50 years missed things that you find obvious ?
-
Re:Hmm
Wow, so
Meanwhile someone discovers a link between Sun pollution, magnatism, heat transfer between planets and the 'void' which may explain away "Dark Energy" as simply being sun pollution. Unspent electrons. Energy for star ships.
Yet
What kind of future does
Oh gosh, where does on start.
I guess I'll take a simple approach.
Svante Arrhenius showed in 1896 that CO2 absorbs much more infrared radiation than Nitrogen or Oxygen, which is nice because it keeps our planet from being an ice ball. CO2 levels then were around 300 ppm.
CO2 levels today are about 400ppm, that is the highest they have been in 800,000 years. And no, CO2 levels weren't this high 800,000 years ago. That is just how far back we can go with ice cores.
Human activity, mostly burning fossil fuels, is pumping 36 gigatons of CO2 into the atmosphere each year.
If you don't buy human-caused climate change, explain to me which one of those facts you disagree with. Or explain to me how you interpret them.
Reference: http://www.esrl.noaa.gov/gmd/c... -
Re:Milestone my ass
No correlation as in this picture? Denial gets more desperate by the day.
-
Re:EPA has exceeded safe limits, needs curbing
While there may be some in the scientific world who dislike Mann several investigations of him have not turned up any damning evidence of wrongdoing.
The studies in question didn't attempt to interact with the damning evidence from the emails, in fact they carefully avoided addressing it.
Regarding similar studies confirming Mann's hockey stick graph here are some:
Here's a book from the National Academies of Science with more details:
Surface Temperature Reconstructions for the Last 2,000 Years
If you throw out data from measurements are not known to be reliable proxies for global temperature, you are left with very little if anything; and certainly not with a thousand year hockey stick shape. The hockey stick is an artifact of cherry picking data. There are many reasons for an upswing in various physical measurements in the 20th century, including (yes) a warming temperature as we swing up from a low point on the multi-century scale, but also modern agriculture and its effects on things like tree growth.
Case in point, take Figure 6 -- the proxies seem to show a dip which we'd identify as the Little Ice Age of ca. 1300-1870. Not much else is obvious there, except the somewhat misleading superimposition of the instrumental record. It's not really fair to slap instrumental readings on the end of the proxies, since even assuming these proxies reflect global temperature in some way (big assumption), they will flatten out upswings like the instrumental record shows in the late 20th century.It's true that water vapor is responsible for the largest chunk of greenhouse warming but it is not a greenhouse gas that can drive warming because the amount of WV in the atmosphere is strictly limited by temperature (and regionally the availability of water to evaporate). The level of WV is not something humans can have any significant direct effect on therefore it is not something to worry about.
Water vapor's status as the number one greenhouse gas makes it a hard problem because of the water cycle. What is the effect of cloud cover? How is the water cycle affected by more CO2? These are the billion dollar questions.
The "Pause" is not something that is statistically significant. Here is a statistical analysis that uses several different techniques to try and find some significance to the "Pause" but fails. There is no reason statistically to say the rate of warming since the 1970's has changed significantly.
The Pause has shown that the most highly vaunted predictions of carbon sensitivity were mistaken. What we do with that from here is a tricky question. Simply changing the fudge factors for aerosol albedo to keep our predictions "accurate" is a pretty lame response (Mann's, if you hadn't guessed).
-
Re:EPA has exceeded safe limits, needs curbing
While there may be some in the scientific world who dislike Mann several investigations of him have not turned up any damning evidence of wrongdoing.
Regarding similar studies confirming Mann's hockey stick graph here are some:
Here's a book from the National Academies of Science with more details:
Surface Temperature Reconstructions for the Last 2,000 Years
It's true that water vapor is responsible for the largest chunk of greenhouse warming but it is not a greenhouse gas that can drive warming because the amount of WV in the atmosphere is strictly limited by temperature (and regionally the availability of water to evaporate). The level of WV is not something humans can have any significant direct effect on therefore it is not something to worry about.
The "Pause" is not something that is statistically significant. Here is a statistical analysis that uses several different techniques to try and find some significance to the "Pause" but fails. There is no reason statistically to say the rate of warming since the 1970's has changed significantly.