 Slashdot Mirror
Observed Atmospheric CO2 Hits 400 Parts Per Million
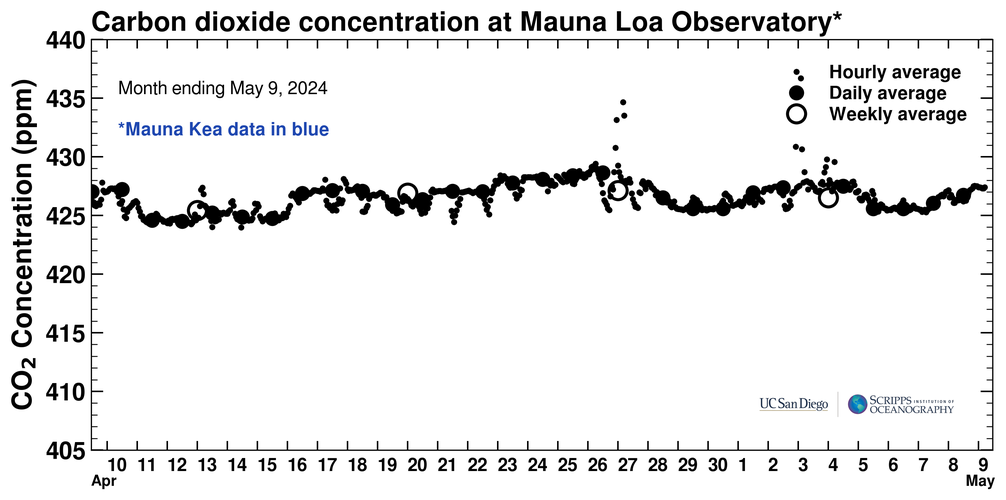
symbolset writes "Over the past month a number of individual observations of CO2 at the Mauna Loa Observatory have exceeded 400 parts per million. The daily average observation has crept above 399 ppm, and as annually the peak is typically in mid-May it seems likely the daily observation will break the 400 ppm milestone within a few days. This measure of potent greenhouse gas in the atmosphere should spark renewed discussion about the use of fossil fuels. For the past few decades the annual peak becomes the annual average two or three years later, and the annual minimum after two or three years more."
Might be better for your argument if that wasn't completely false.
The Muana Loa observatory measures only at night, when air is descending from far up high. That air has come from across the Pacific Ocean, far from any specific CO2 sources.
At night, the volcanic gasses are trapped in a thin layer near the ground by a temperature inversion. The observatory measures the air at several towers at different altitudes and also closer to the volcano so as to get a comparative reading.
You can read more in this report.
"We mustn't be caught by surprise by our own advancing technology" -- Aldous Huxley
That's when alarmists proclaim that the science is settled and everybody but them should just shut up, right?
Now THAT is something I'd never considered!
But others have, it's an old canard, yes it's a factor for that site (the oldest continuous monitoring site), but nobody is relying on just that site, we are at ~400ppm global average across all sites. CO2 concentration varies by ~5ppm in sync with the northern seasons (deciduous trees are responsible) so there is some "wiggle room" in the numbers.
And did you exchange a walk on part in the war for a lead role in a cage? - Pink Floyd.
Just remind them of the thousands of record highs set in the past few years all around the world. For every small increase in average temps caused by global warming, larger extreme temperatures are seen throughout the year. Higher highs and lower lows but an overall average of warmer.
There was a small dip in '09 in CO2 emissions but we have quickly recovered from it. Mind you, this is CO2 concentration, not production, so it's the log of the integral of production (that's why it's linear).
I'm not weighing in on this "debate", but the temperatures in the UK are artificially warm because of the ocean currents. Compare the UK to other regions of similar latitude to demonstrate this. If those ocean currents are disrupted by larger climate changes, expect to see the UK and most of western Europe get much colder overall, even though the global temperatures may be higher.
Being coastal and bounded on the west by an ocean, I wouldn't be surprised if Alaska is in the same situation.
If you want a vision of the future, imagine a youtube comments section scrolling - forever.
"One cold year says nothing about the trend in the Earth's climate."
No... but a 17-year failure to warm probably does.
That's from the IPCC itself. (And you should see the draft of their upcoming assessment report! It puts the lie to a lot of former claims about AGW.)
The IPCC’s Fifth Assessment Report suggests that the Earth will warm rapidly in the 21st century. However, this is not being borne out by observations.
No-one disputes that the earth's atmosphere is warming - this has been going on for some time now. What is disputed is the contribution that human activity makes to the degree/acceleration/rapidity of warming. The original models had man's contribution to an increase in warming as minimal at best. Then the IPCC re-jigged the models to take into account the theory that CO2 (and other emissions) would cause a climate forcing, i.e. the effect of the increasing CO2 levels would not be linear but would drive GW at a much higher rate than what would be expected naturally. These models have all predicted rapidly increasing global temperatures with no pausing. In order to account for small variations in the annual results, the IPCC et al initially said you needed 10 years of no warming to invalidate the models. Then as 10 years got close, that became 15 years.* Then 17 years. That has now come to pass. Even the most conservative of models do not match the observed results, therefore it's time to revisit the modelling.
*"The simulations rule out (at the 95% level) zero trends for intervals of 15 yr or more, suggesting that an observed absence of warming of this duration is needed to create a discrepancy with the expected present-day warming rate. From: http://www1.ncdc.noaa.gov/pub/data/cmb/bams-sotc/climate-assessment-2008-lo-rez.pdf
It's a very large PDF.
When they came for the communists, I said "He's next door. Take him away. Goddam commies."
Presumably you're referring to "scientists." Also, I've repeatedly said:
Since climate is an average over ~20 years ... climate is only meaningful when discussing averages over ~20 years. ... I've repeatedly stressed that we need ~20 years to average out weather noise. ... professional climatologists usually smooth data and model output using ~20 year averages. ... It's also important to remember that a ~20 year timespan is necessary to obtain statistically significant temperature trends...
In fact, I've repeatedly told you that ~20 years are needed:
As I've explained, climate is the global average over ~20 years. [Dumb Scientist to Jane Q. Public, 2010-02-16]
This graph shows why scientists prefer trends calculated over at least ~20 years. [Dumb Scientist to Jane Q. Public, 2013-01-21]
I've even gone into more detail, showing you a paper that says at least 17 years are required:
Of course, you ignored me just like you previously ignored riverat1:
And 10 years has what to do with climate trends? Not much. A recent paper by Santer et. al. calculated the signal (climate) to noise (weather/natural variation) ratio for climate trends. For 10 years the S/N ratio is less than 1. They found it takes 17 years to be sure the signal is greater than the noise. [riverat1 to Jane Q. Public, 2011-11-19]
For global temperatures, Santer et al. 2011 shows that one needs to average over ~17 years of data to obtain statistically significant climate trends. Here's another explanation by Tamino. Also, the Skeptical Science trend calculator helps visualize statistical significance. [Dumb Scientist, 2012-08-15]
Perhaps your ode to conspiracy theories distracted you, but I also linked to another method of calculating significance which is even more conservative:
Also, Bart