 Slashdot Mirror
Domain: dmi.dk
Stories and comments across the archive that link to dmi.dk.
Comments · 51
-
Re:Data is not the plural of anecdote
-
Fluctuating temperatures
The graph of historical temperatures in the arctic is really helpful. Traditionally there are massive temperature swings in the arctic, during the arctic night (which of course lasts all winter). In the summer, it begins to stabilize. The temperature swings are caused by wind, as massive fronts move across the region (or out of the region, as with the polar vortex).
Incidentally, winter temperatures in the arctic are not directly from the greenhouse effect, because there is no sun and you need sun for the CO2 to make a difference. At best the warming from anthropogenic sources is a secondary effect (which can still be large). -
Re:Sea ice vs projections
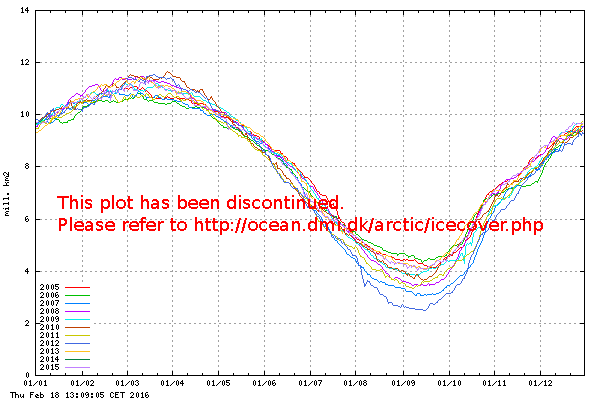
Here's a more up-to-date graphic: http://ocean.dmi.dk/arctic/plo... Not sure why yours shows less than 4 million square km in 2012, and the up-to-date one shows over 14 million square km currently. Maybe it's multi-year ice? I know the summer extent of ice in the arctic dips down to about 4Mkm^2 during summer...
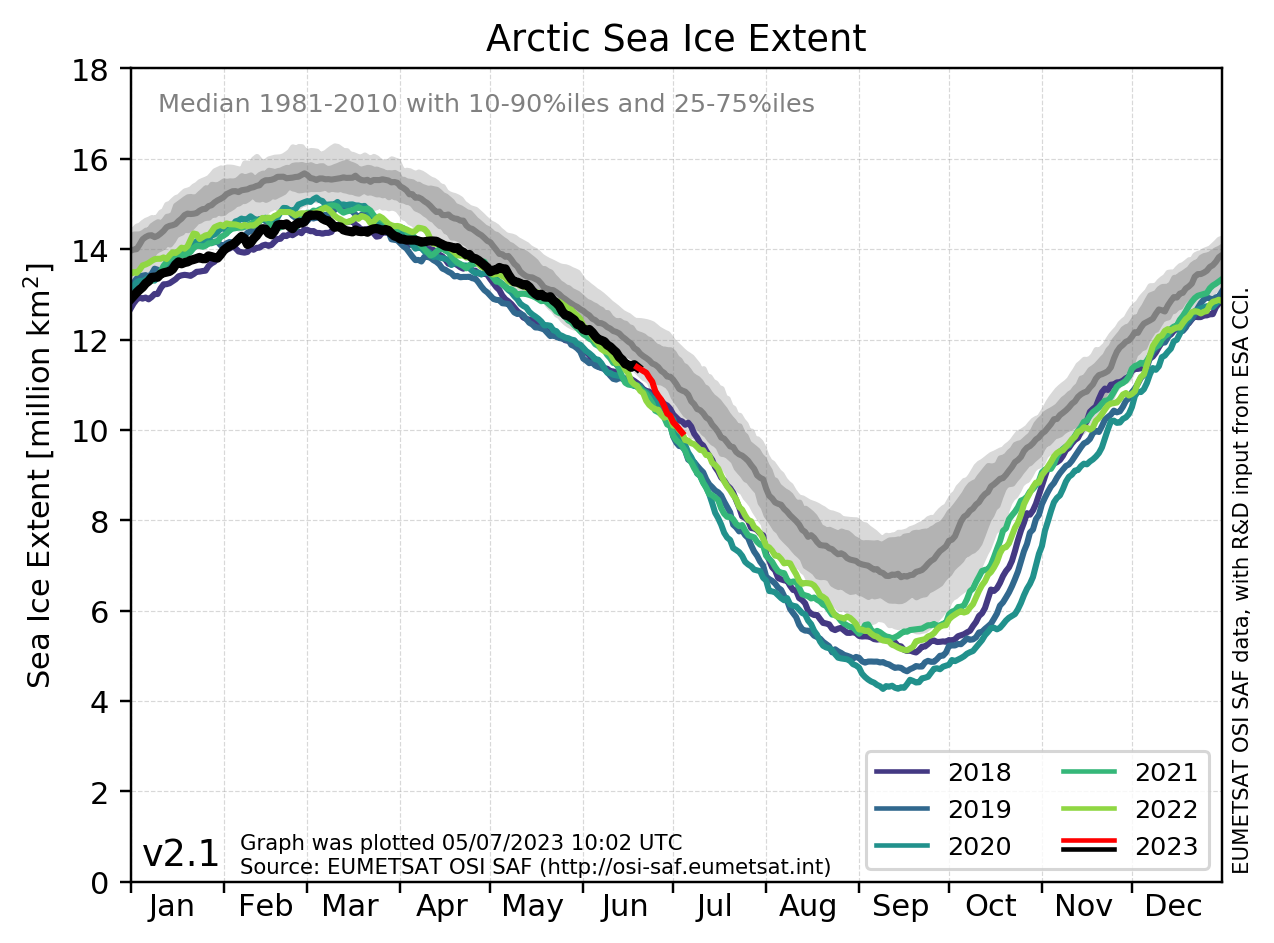
Arctic sea ice always retreats in summer and regrows in winter. The original graph showed development of the yearly minimum extend (which typically happens in September). September 2012 was the record low for arctic sea ice extend so far, going down to 3.3 million square kilometres (although all the last years have been below two standard deviations). At the moment, we are shortly before yearly arctic sea ice maximum - that's why we have 14 million square km. This is a record low for this time of the year. Indeed, day over day, sea ice extend has been at record low for the last few month, compared to the same day in other years. There is an excellent interactive map at the NSIDC.
-
Re:Sea ice vs projections
Here's a more up-to-date graphic: http://ocean.dmi.dk/arctic/plo...
Not sure why yours shows less than 4 million square km in 2012, and the up-to-date one shows over 14 million square km currently. Maybe it's multi-year ice? I know the summer extent of ice in the arctic dips down to about 4Mkm^2 during summer... -
We are now in La Nina conditions
Last year was very warm due to 'super El Nino' conditions. El Nino occurs every 4 years or so, and is then followed by La Nina conditions which are usually very cold. This is probably why temperatures have plummeted so much that it snowed in the SAHARA yesterday. This is all natural fluctuations on top of the gradual rise that started 150 years ago at the end of the Little Ice Age (where solar magnetic activity started changing terrestrial cloud formation, see the work by Svensmark and Shaviv for example). A mere 2% increase in water vapor has the same effect as a 100% increase in CO2, water vapor really is the dominant 'greenhouse gas'.
Here are pictures of yesterday's snow in the Sahara for anyone who is interested, the last time it was cold enough to snow here was 37 years ago:
http://edition.cnn.com/2016/12...
So much for all the clueless new agencies that said 'snow is a thing of the past' a decade ago
https://web.archive.org/web/20...
and all the 'ice free Arctic summer' forecasts also made by clueless mainstream media outlets
http://realclimatescience.com/...
They are a bunch of liars ! Don't fall for the lies anymore, dear Slashdotters. Especially don't let the frauds take your hard-earned cash as 'green tax' or take your individual liberty away in the name of 'saving the planet'. They got the science wrong and think they can win by lying to you to continue their globalist One World Government (UN) scam - which they control and you do not elect.With regard to the claim that the Arctic won't freeze I believe the people making the claims don't seem to understand that an El Nino often delays winter conditions by months, but when they do come and form La Nina conditions then they come with a vengeance. Expect next year to be colder than normal. And after that the 4-year El Nino/La Nina cycle driven by the Pacific Ocean will start again.
Here are data from the Arctic (Danish sources that are not fraudulent politicized entities like US ones):
http://www.dmi.dk/en/groenland...
We see that Greenland (in the Arctic) has massive amounts of MORE ice than normal. We also see normal variability in the ice cover data, things look fairly normal and ice cover is currently in an increasing phase both for this time of year and since 2012
http://ocean.dmi.dk/arctic/ice...Have a great Christmas dear Slashdotters, and I hope each of you has a much better 2017 than this year.
-
Re:No warming since 2016!
Apparently you haven't noticed it because of the width of your plot, but there has been a very precipitous 1K drop in the temperatures anomalies over land and slightly less dramatic over the oceans in the temperatures form September to November; even the arctic temperature spike might be reducing.
-
Re:The Priesthood has spoken
IDK every year seem to be a "New Record High" even if only by 0.001K!
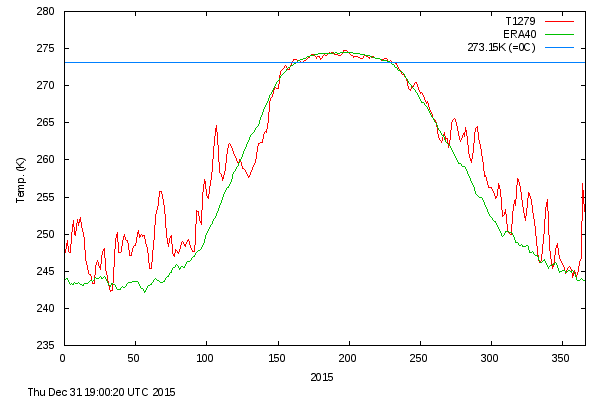
The Arctic as defined by north of 80N is extremely above expected temperatures, average running about 260K today, still considerably below freezing at 273.35K. Also there is a lot of variation this year. -
Re:20 Degrees C?! Lol
Albedo differences are nonexistent in the polar night. So that's definitely not it.
Here is temperature data for the past several decades. If you look at it, the first thing you notice is that temperature in the winter (night) is hugely variable, mainly affected by winds rather than sun, and a 30 degree swing is not entirely surprising, although it is larger than normal. -
Greenland and Arctic data
If we use the Scientific Method (rather than anecdotes) we look at data. Here is the Danish Meteorological Institute's measurements (Greenland is administered by Denmark)
http://www.dmi.dk/en/groenland...
Of particular interest is this graph:
http://www.dmi.dk/uploads/tx_d... Here is the Arctic Ice Extent:
http://ocean.dmi.dk/arctic/ice...Here is the late-summer Arctic ice extent. Temperatures drop below freezing in a week from now and the Arctic ice will start accumulating again (this is from an American source):
http://nsidc.org/data/seaice_i...The coasts of Greenland are losing some ice, which may be why this base is being expose, but a much larger interior are in the interior is putting on a lot of ice/snow. The pattern of where ice is gained and lost seems to vary annually, depending on sea conditions and also changes in wind/storms.
Given that the Antarctic is putting on ice and the total ice cover of the globe is actually increasing (if you look at the measurements) then there isn't much of a reason to panic - especially as those that study solar activity have a prediction of Maunder-Minimum conditions by about 2030, where the global temperature will decrease drastically. So relax, enjoy the good weather (El Nino this year, which was wonderful) while it lasts, amigas y amigos.
Don't forget to always check the observed data, as computer climate models are not data according to the Scientific Method, they are considered "hypothesis" and observational data can falsify those hypothesis.
-
Re:Only if you ignore the data that contradicts th
You present a graph for one spot, the GISP2 ice core at the summit of Greenland, that ends over 160 years ago in 1855 and think that means something globally today. I wonder how it would look if you added in the temperatures since 1855? Also the time scale is not even. The further back you get the more is compresses the graph horizontally which could be a bit misleading.
The GISP2 correlates with stalactite growth all over the World, such is in my own country in the southern hemisphere. Furthermore, given the fact that the observed warming since the Little Ice Age is agreed to be around 1.5 degrees Centigrade so far, consider the size of the modern record on this graph. Furthermore, the specific claim of AGW proponents, via Michael Mann, is that there has been no natural warming for the last thousand years and possibly two thousand. This is clearly not true and Mann's analysis has been thoroughly and utterly debunked - so much so that the IPCC have discarded their analysis. This proves that natural variability is large and relatively swift. Humans are not required to explain the observed variability since the end of the Little Ice Age (in fact, the warming we see is the End of the Little Ice Age).
Now you must explain why the specific prediction of AGW theory, that the LTT will warm faster than the surface, is not only not observed but the counter is observed.
I looks like 2016 will set a new record for the lowest maximum ice extent unless there is a big freeze up in the next few weeks.
FALSE. The quantity of interest is the minimum in the Arctic summer ice cover and this does not occur in the boreal regions until September. Here is the data which shows your statement is silly and should be beneath any Slashdotter:
http://ocean.dmi.dk/arctic/ice... -
Re:Does anyone have a list of the hottest years?
Yes there were warm episodes scattered around the world during that time but research indicates they weren't well coordinated in time so the global temperature was probably less driven by them.
FALSE. The same thing happened on every continent at the same time period. This is, by definition, a global effect. You just don't want to acknowledge the possibility.
You should really drop the "C" in CAGW. I just marks you out as being on the climate science denier side of things. Whether something is catastrophic or not is a pretty subjective measurement.
But the whole schtick for 'healing the planet' is becaiuse the change is deemed to be catastrophic. If it is not catastrophic than no action is required. The climate has always changed. Oh, and speaking of dropping terms. Even the newspapers now realize that using the term 'denier' not only makes the person using it look completely biased (which you appear to be), and waters down the disgusting acts of real 'deniers' (Holocaust deniers). So, if you want to stop looking like a non-objective extremist, I suggest you drop the 'denier' nonsense. But it seems we agree that what is observed is not catastrophic - which means the whole Alarmist hyperventilation (and UN imposition of socialist 'green taxes') is unnecessary.
Lewis and Curry's estimated ranges for climate sensitivity isn't that far off from the IPCC's estimates.
Not so. They are significantly different. The claim has been that warming of up to 8 K is possible and 4 K is *extrenely likely* hence the West must be de-industrialized - which means that tens of millions of poor people in the Third World will lack medicines and food as energy becomes much more expensive and scares. There is a huge difference between the IPCC computer-generated guesses and the observational reality, and at the moment the Alarmists in their comfy First World cities are condemning the poor of the Third World to energy poverty where they can never climb out of - as well as dying of preventable diseases where treatments are unavailable due to much higher manufacturing and transportation costs. Already thousands of old people are dying in Britain and Germany as a result of 'green energy' which is unreliable and triples energy costs. Did you not know that the alarmist scam is already killing people?
Also while 150 years of observations may be long enough to determine the Transient Climate Response I'm not sure that is long enough to determine the Equilibrium Climate Sensitivity because among other things it doesn't take into full account albedo changes from melting ice.
Melting ice? did you not look at the DATA I provided? The Arctic is putting on ice. So is the Antarctic. Total ice cover is at record levels. Polar bear numbers are up. You have not looked at the actual observational data at all, have you? Here is a hint:
http://ocean.dmi.dk/arctic/old...I don't consider Nic Lewis and Judith Curry to particularly be unbiased sources so I guess we're even on that score.
Which data of their do you refute and why?
Regarding changing my mind about CAGW as I said I don't accept the "C" in it
If there is no 'C' then what is the problem? Furthermore, what is the proper temperature that the Earth should be at? you guys never answer that question. You are the ultimate in conservatives who always want to wind the clock back to the conditions (and society) of the 1970s. Think about it, "What temperature and CO2 should the Earth be at?". We do know that plants evolved at around 2000 ppmV CO2, and below 150 ppmV of CO2 all plant life dies (which means all life dies) - we have been perilously close to that limit in the recent past and fortunately are moving away from real climate catastrophe.
Whether it becomes cat
-
Here's the 10000 year view
Slashdotters love data, right?
Here is the 10000 year view of the situation:
http://jonova.s3.amazonaws.com...Here's the data from the Arctic:
http://ocean.dmi.dk/arctic/ice...
http://ocean.dmi.dk/arctic/old...Here's the RSS satellite trend since the big El Nino of 1998:
http://www.woodfortrees.org/pl...Here's the RSS satellite trend since the big El Nino of 1998:
http://www.woodfortrees.org/pl...Here is a correlation between CO2 and various surface and satellite data-sets: http://www.woodfortrees.org/pl...
Unfortunately the global temperature range is of the order of 100 K from poles to equator, and the uncertainty in the measurement data is at least +/- 0.2 K, so increases of fractions of a degree are not particularly significant. Here is a paper discussing the same
http://multi-science.atypon.co...
http://wattsupwiththat.com/201...There is Global Warming for sure. We would expect warming after the Sun increased magnetic activity after the end of the Little Ice Age. Some component of that warming is due to human-emitted CO2. Whether the dominant effect is natural or human is still being debated (particularly since CO2 effects are weak and the IPCC's models that the CO2-induced water vapor effects would increase the temperature further appear to be falsified by experiment). To de-industrialize and impose punitive 'carbon taxes' at this stage does not look like it can be supported by the data. The difference between surface and satellite observations has not yet been resolved satisfactorily (the 'science is not settled'). If you think the science is settled please refer to the data I have provided in your response (you need to explain it). Thanks.
-
Re:Poor planning
3. Greenland does not exist.
You have now checked number 1. Let's sit back another hour or so and we will probably have covered the whole list.Who am I to prevent the Slashdot readers from finding the data on the Greenland ice cover from the Danish Meteorological Institute?
-
Re:Something missing here...
I had a job interview in March at the http://dmi.dk/
I had to do some programming tasks, before hand and present my results in kind of talk during the interview.
So I basically learned Python and the relevant libraries for that task in 2 days.
However I cheated a bit, instead of doing OO stuff I had plain modular Python code, but it was fun. With libraries at hand the result was very short and very readable compared to e.g. Java. -
Re:If you don't like the textbooks,
Arctic Ice seems to be rebounding, but it's too early to tell if it's a trend or an anomaly.
-
Re:in one case, a search and replace update
Thanks for replying in a manner where we can have rational debate. Your Exhibit A talks about relative death rates between countries (which they attribute to domicile quality), not relative death rates as a function of energy cost. Can you see the difference? can you see how your Exhibit A actually does not address my point at all?
Ignoring all the jobs that would be created with large scale clean energy adoption....not to mention stability.
This is a fair enough comment. What needs to be factored in is which creates more jobs, the 'general economy' or the 'green economy'. While I don't have any figures it would seem to me that 'green' jobs are probably much more capital intensive than general economy jobs. That means far fewer green jobs are created. Would you admit that this could indeed be a possibility? that fewer green jobs would replace more general economy jobs as money is sucked out of the economy and given to the green economy through the government subsidies that seem required for any 'green' project to be sustained? Green jobs probably pay more than regular jobs, so that is something in favor of that - but that doesn't help for those out of work because the government is sucking more tax out of the productive sector and giving it to their crony projects (eg. the Solyndra debacle, which was but one of dozens and dozens).
North Dakota is about to loose all the jobs they just got because Saudi Arabia feels like it.
Indeed. Saudi Arabia is spending $750 Billion to destroy the recent energy independence of America. And your President Obama seems very pleased by this. This seems quite disturbing as an outsider. But this has nothing to do with 'green jobs' vs general economy jobs. This is a trade war which is massively distorting the marketplace (aided and abetted by an Administration ideologically opposed to cheap energy).
And I guess you didn't see any of the examples I cited where sweeping environmental regulations were put in place that fixed the potential problem without any overall economic damage. (For exhibit B see my other post)
Apologies, I did not see your post. I don't think you'll find anyone arguing about environmental protection. The debate comes at whether the environment must be preserved as pristine at any price or not. I mean, do you think that any industrialization should be allowed at all?
Thanks for the "and Then There's Physics " post. As a physicist (PhD in Astrophysics, specifically Gravitational Microlending) I can see an immediate problem with the post, and understand why he doesn't get Salby's argument. Can you see the problem? I'll give you a hint, take a look at the diagram of CO2 exchange. What's wrong with this picture? furthermore, looking at other posts by that author he seems completely unaware that CO2 has a decreasing effect on the wavelengths of interest as concentration increases, ie. "diminishing returns" in terms of greenhouse efficiency. This is demonstrable in the lab and is no small thing.
Whatreallyhappened...classic data cherry picking for misdirection. I've debunked those enough in similar threads, I'm over it.
I'm pretty sure the AGW hypothesis says that the following shouldn't happen, right?
http://beta.dmi.dk/en/groenlan...
A massive increased in the Arctic ice sheet - right after record Antarctic ice levels.But the real question is (following Karl Popper): At what point does AGW become falsifiable based on the data?
What that statement ignores is that neither of those conditions supported human society!
Huh? do you not know about the Roman warm period? or the Medieval Warm Period? of the Little Ice Age? or the Dustbowl 1930s? I'm sure you do. Stop fearing change.
The current bout of climate change is differe
-
Re:Senator James Inhofe
Gore is not a scientist, so his opinion means nothing. You should have linked to this chart (the new, updated version), instead of your old and busted chart, which shows you really don't have a clue. According to the site you yourself cited:
The plot above replaces an earlier sea ice extent plot, that was based on data with the coastal zones masked out. This coastal mask implied that the previous sea ice extent estimates were underestimated. The new plot displays absolute sea ice extent estimates. The old plot can still be viewed here for a while.
Where "the old plot" refers to your chart, and "the new plot" to the one I posted.
You are either woefully ignorant of this topic, or you are being intentionally dishonest. Pick one.
-
Re:Everyone should just say "interesting"
Are you sure about that? People usually say the sea ice is increasing in extent, but that the land ice (the bit that might raise sea levels) is shrinking rapidly.
NASA and its climate partners (like GISS, NCDC) have been saying that. I don't know who else is saying that, unless they're quoting those sources.
RECORD sea ice this year. Sea ice forms around the generally WARMEST locations in Antarctic (lowest altitude, near the sea), and even so requires a consistent -2 degrees C to form. How is the rest supposed to be melting if it's colder than that?
Granted, temperature is not distributed completely evenly, and SOME part of the Antarctic is always melting. This allows the alarmists to scream and cry about the part that is. But the rest isn't. Quite the contrary: even when the alarmists were screaming about the "massive" melting of the Western Antarctic land ice sheet, the Eastern Antarctic was gaining more ice than the West was losing.
Of course it's Spring now in the Antarctic, and that will give the alarmists something to scream about as the record ice retreats a little. But if it's anything like the Northern Hemisphere was this year, even in summer it will continue to set new highs. As for the other hemisphere lately:
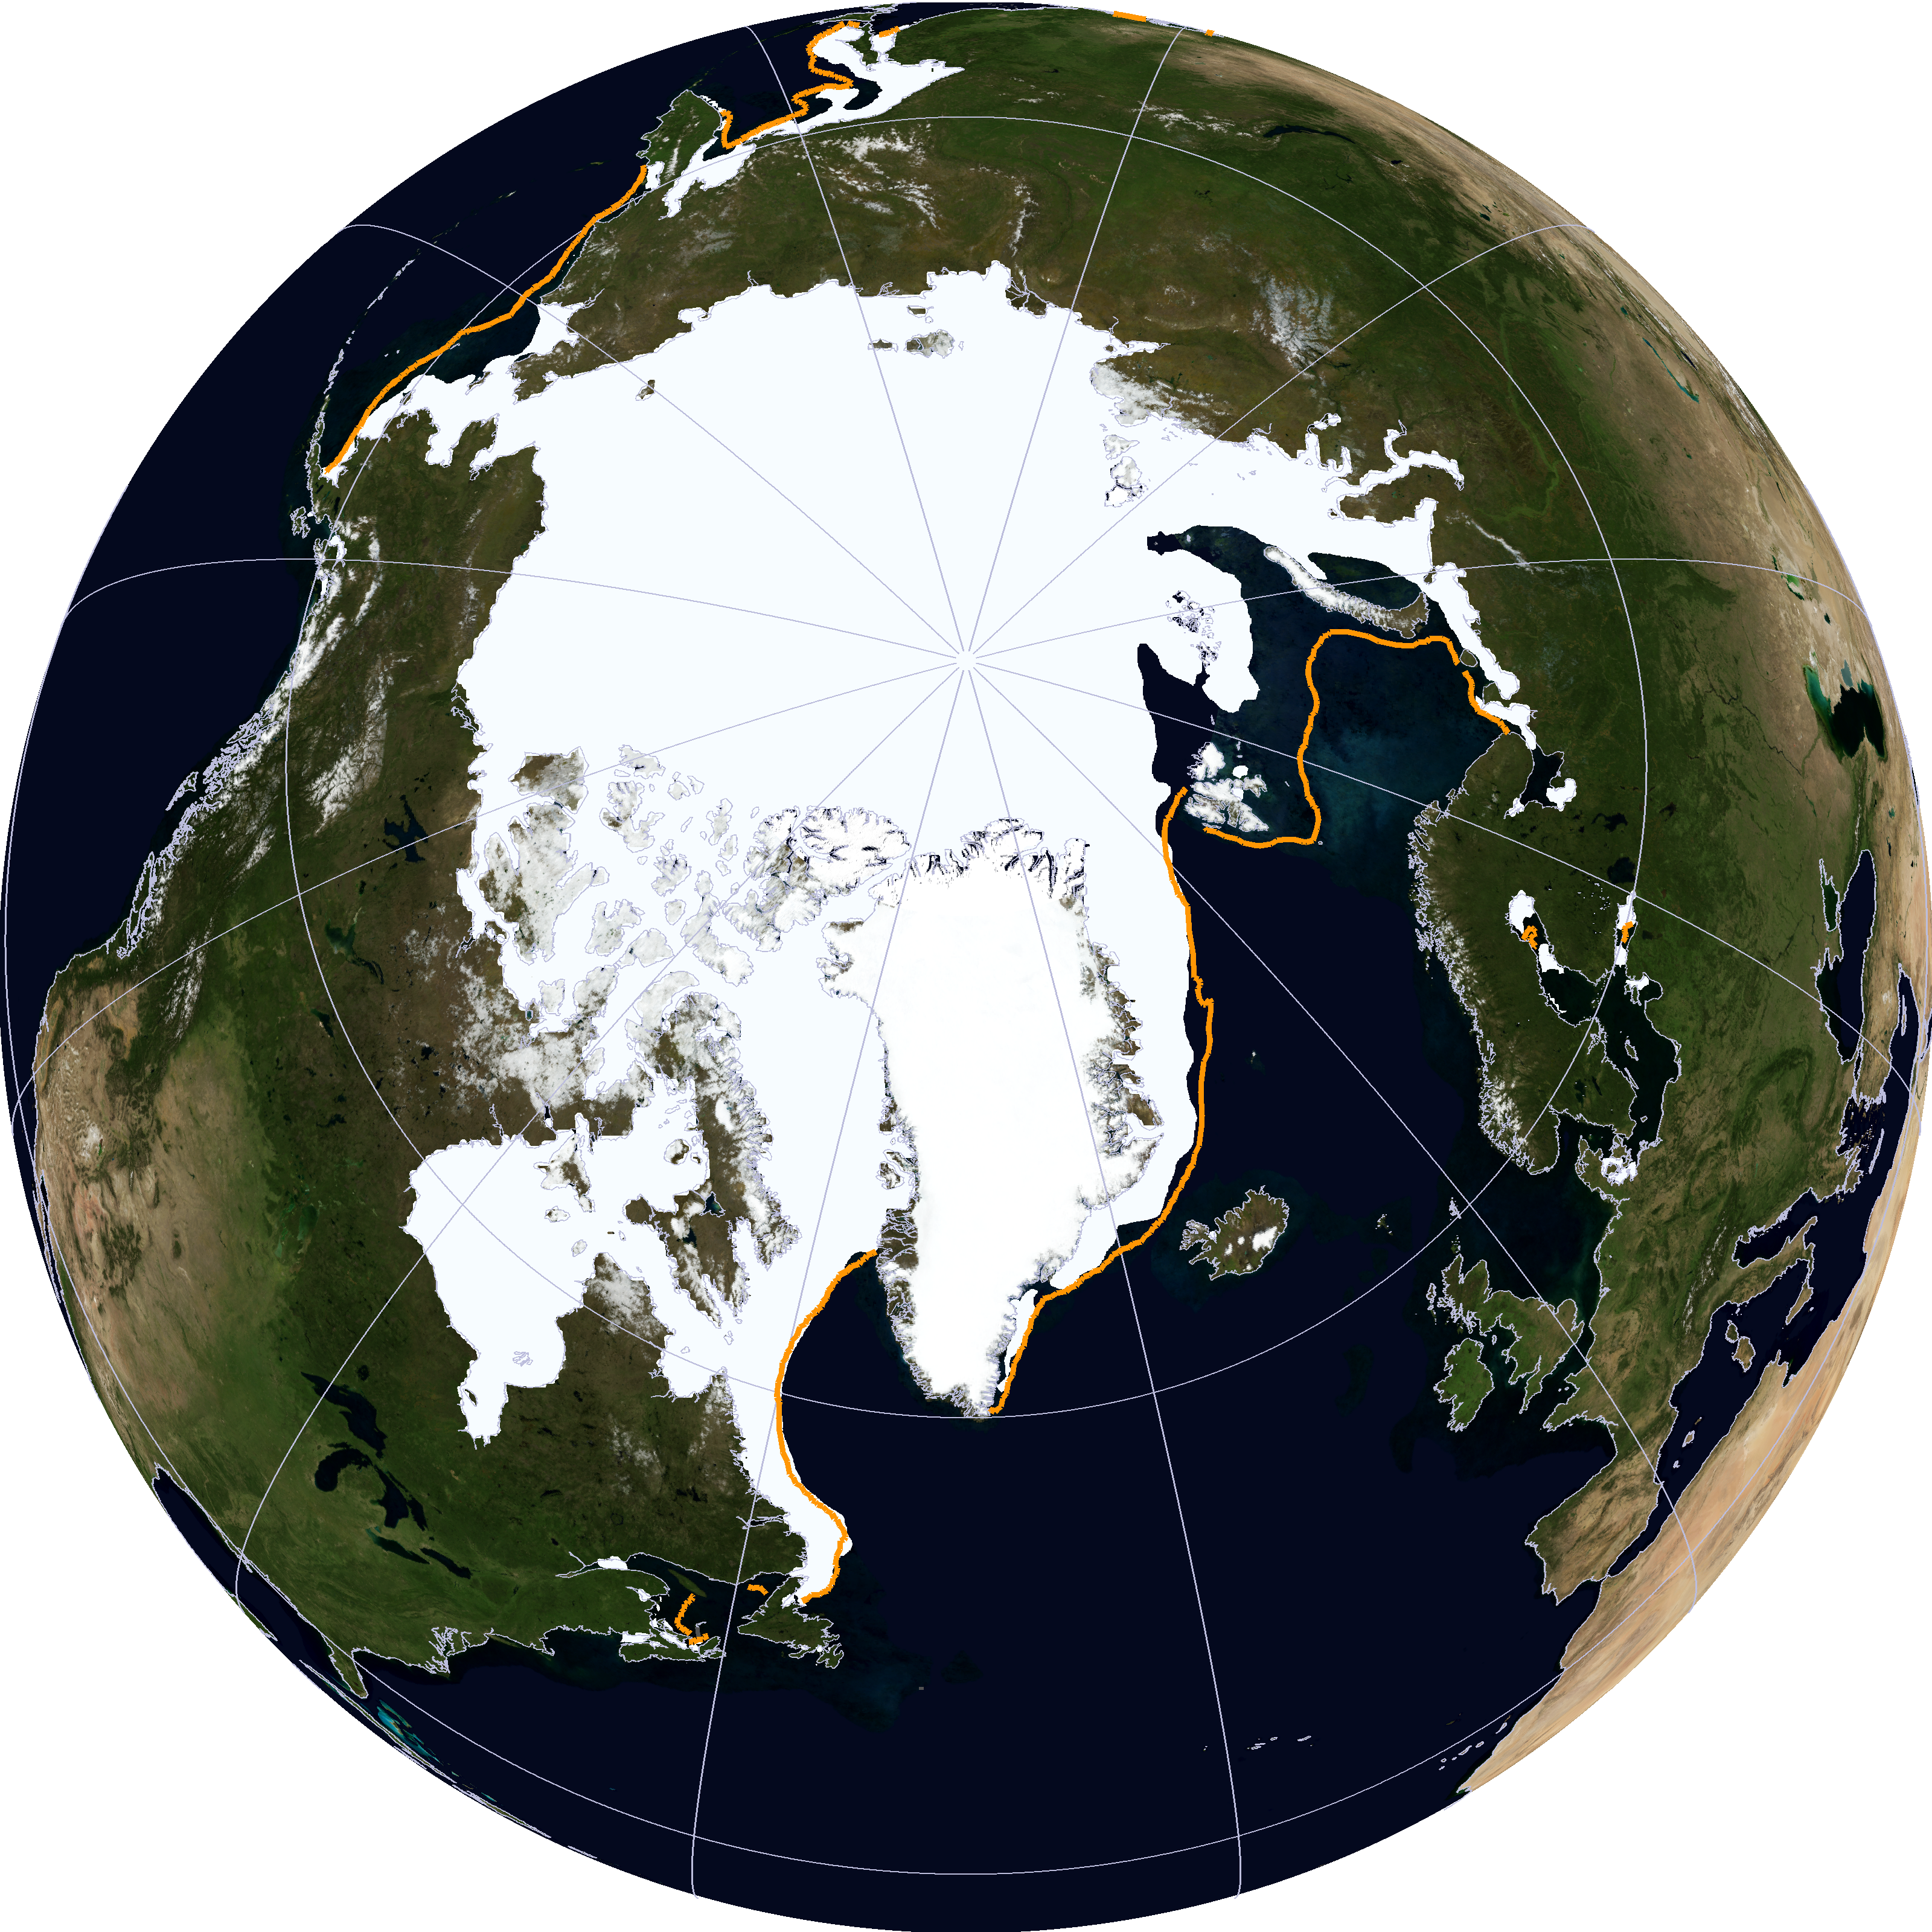
Does this look abnormally low to you? That's arctic ice right now.
Ice mass on Greenland is way above normal. And we're just coming out of summer!
Northern Hemisphere snow cover was at an all-time high in September.
NASA's own satellite temperature records often disagree with them. That's why they ignore it and you seldom hear about it. -
Annual increase in CO2
Also, it should be noted that the current annual increase in CO2 is about 2 ppm, which this graph shows. And, as can be read here(in danish), the largest fluctuations in the period from A.D. 1000 - 1800 was 7 ppm. So at present we are increasing CO2 levels every four years by more than the biggest fluctuations in said time period; I'm guessing it really is man-made.
-
Re:Empirical curve fitting suggests sooner.
> There are a couple of good "Arctic Death Spiral" plots out there,
> none of them look very encouraging.Here's another worth looking at:
-
Re:Global warming
So the scientists are postulating that our spring is cold because the arctic Sea Ice is greatly diminished; then they publish a scary looking picture show lots of open water, but wait, that picture is from August 2012, going to the Danish Meterological Institute's site we see how bad it was infact august, september and november had dramatic reductions in Arctic sea-ice sea ice extend, yet it is now spring, a cold spring it seems, and what do we see, Arctic Sea-ice extent is at several time higher than it has been in the last 7 years, so what does it look like today well the National Snow and Ice Center says it looks like This!
So if a lack of Arctic ice cause cold spring weather, then I should be unpacking my bathing suit!
-
Re:Press coverage
-
Re:Such dubious words...
Hansen is not a scientist he's a activist with scientific credentials. It's his horse in the race and he should be stripped of his title at NASA. We need scientists to report not react.
Anyway, the "epic" melt now being leverages is not a temperature melt. There was a huge artic storm that broke up the ice, which increased the surface area, which the water then melted. If we take a look at a temperature graph for the arctic: http://ocean.dmi.dk/arctic/meant80n.uk.php We see that it was an "Average" year with no additional time above the melting point than normal. What created the melt was not warmer weather, it was increased surface area.
The storm would have had to have been the size and intensity of Typhoon Tip to be able to even approach that level of impact on the entire ice pack.
Why not just say "God did it!".
-
Such dubious words...
Hansen is not a scientist he's a activist with scientific credentials. It's his horse in the race and he should be stripped of his title at NASA. We need scientists to report not react.
Anyway, the "epic" melt now being leverages is not a temperature melt. There was a huge artic storm that broke up the ice, which increased the surface area, which the water then melted. If we take a look at a temperature graph for the arctic: http://ocean.dmi.dk/arctic/meant80n.uk.php We see that it was an "Average" year with no additional time above the melting point than normal. What created the melt was not warmer weather, it was increased surface area.
-
Let's not be alarmist just yet.
Ok, before I get modded Troll, I'd like to appeal to your critical thinking logical side.
First, while I personally find this a bit saddening, lets ask a couple questions and make some observations.
1. Why is the ice cap cited as such a barometer of global warming?
2. Is the warming necessarily anthropogenic? Wouldn't it melt even if the warming was entirely natural?
3. What does an ice cap (which floats on water, which is an order of magnitude better conductor of heat than air)
3a. Where does this water get it's heat from? Hint: 75% of our surface is water. Does air affect ocean temps or something else?
3b. What is the heating role of CO2 in water. (ignore acidification)
4. If I showed you a temperature graph which showed temperatures are average while ice area is down, what would you infer?
( temperature graph )
4a. Could the ice pack be affected by say a storm that broke up the ice which facilitated melting?So while the news is bad, we can't necessarily draw the conclusion that we've been told to draw. Low sea ice has nothing to with CO2. Global warming maybe, but not CO2.
-
Re:This is worst than in the movies
Where is this magical place on Earth that is free from natural disasters (earthquake, tsunami, volcano, flood, drought, extreme cold, extreme heat, hurricane, tornado, blizzard, typhoon, mudslide, avalanche, wild fire,
I think the biggest "natural disasters" in Denmark is lots of snow, and even then it's only a disaster in the sense that "it's more than we're used to".
Extreme temperatures? Lowest recorded temperature: -31.2 C/24.2 F. Highest recorded temperature: 36.4 C/97.5 F
Most precipitation in a 24 hour period? 168.9 mm / 6.6 inches
Hurricanes? Since 1891 (120 years of data) - eleven class 4 storms (>28.5 m/s winds for 10 minutes), three classified as hurricanes.
Tornadoes? A few that classify as maybe an F1.
Earthquakes? Most topping out at about a 4, as it's sitting on the middle of a plate. A single 5.2 was registered in 1982, originating 40 km under the surface. Only one earthquake recorded that has resulted in any kind of damage to houses, and those were minor damages (think cracks in brick walls).
Tsunamis? Since we don't get earthquakes, tsunamis need to be caused either by insanely big land slides, like the north face of the Canary Islands dumping into the ocean, or massive earth quakes in the Atlantic. And even then Denmark is shielded quite well by it's location.
Floods? They happen, but nothing serious. Usually just results in people getting wet living rooms and flooded basements. Most of the newer ones happens because the sewage systems in the cities haven't been updated to keep up with the massive increase in paved surface area that dumps water into them rather than soil absorbing the water.
Drought? Not really. There are summers where there is barely any rain, but Denmark is a collection of relatively small islands and a single peninsula. It is almost completely surrounded by water, so any kind of serious drought could be fixed with desalination plants very quickly.
Blizzards? We get those, but moderate temperatures and moderately low amounts of snow means the only reason they cause problems is budget and idiocy. Budget because the local municipalities aren't setting aside enough money for snow clearing and idiocy because people look out at a blizzard and uncleared roads, turn on the radio and hear that the authorities are advising people to stay indoors and then go "what the fuck do they know?" and end up stuck in a ditch.
Mudslides? No mountains or hills to speak of. Which rules out avalanches as well.
Wild fires? There are some minor wildfires in the heathland every year, maybe one or two major ones a decade, but nothing life threatening, and definitely not even close to being a natural disaster.
Volcanoes? Closest volcanoes are in Iceland and southern Europe/Mediterranean.
-
Re:GISS
The data from GISS weather stations is pretty rotten in the arctic, DMI, Danish Meteorological Institute is much better, Air temperatures are primarily below freezing now, water temps guessed at between 0 and 3.4C, nobody seems to have anything working in the area of interest.
-
Interesting Animation of Dispersal
Here's an interesting animation of the dispersal from Denmarks's weather service: island_vulcano6000.gif
-
It can happen to you too
Iceland being more or less halfway between the main continents of the western civilization, means that the northen part of the american continent may be affected directly (directly, as in visible ash on the sky, and stuffed in the engines); see this animation http://www.dmi.dk/dmi/dmi_foelger_asken_fra_grimsvotn (text in danish) from the Danish Meteorologic Institute for an event of little over 5 years ago. Unless you want to start using zepellins all over again, I suggest you, for one, welcome your Icelandic overlords.
-
Re:I Don't Think This Was Well Thought Out
look, actual arctic data for the last 52 years! Yes, recent decrease in temperatures! In fact, they made much hoopla over last year's June was first month in 50 years where it never was above freezing. what's up with that?
http://ocean.dmi.dk/arctic/meant80n.uk.php
You must be a "climatologist", since you are more interested in Dogma than Fact.
-
Re:Do they know if this is unusual?
(And that's a big assumption given the major cooling trend we have been in for the last 10 years.)
Oh please. Take a look at the graph and tell me what cooling trend you see? I know that 1998 was exceptionally warm, but one years does not make a trend.
-
Re:Ice melting or technological advance ?
Well, wattsupwiththat indeed - if you check the link to the updated data from your second link, you see that the ice floe your point stood on just melted.
-
Re:Pot, meet kettle
Feel free to study the topic you're debating
Anyway, with regards to the ice - here's a link in Danish. I could of course provide you with links in English, but so far you've managed to misinterpret the ones you've read.
(The link is to the official Danish weather centre btw)
I september 2007 nåede den samlede, arktiske is sin historisk mindste udbredelse og selv om sommer 2008 blev noget koldere i Arktis, kommer isudbredelsen i år næsten lige så langt ned
http://www.dmi.dk/dmi/smeltning_i_oest_og_vest_aabner_arktiske_sejlruter_samtidigt
-
DO NOT
And for three Mars summers in a row, deposits of frozen carbon dioxide near Mars' south pole have shrunk from the previous year's size, suggesting a climate change in progress.'
DO NOT believe the evidence! Just because warming trends are happening on two different planets is NO reason to think that there might be a common cause, like the solar energy cycle. DO NOT read up NASA predictions for solar cooling and cooler weather on Earth. DO NOT look at the graph showing the correlation between solar output and the Earth's climate. DO NIT read up on the data showing that most stars like the sun show variability in output. DO NOT read about how the Earth's climate has changed greatly in the past, but always oscillates in a limited range.
Read only government approved scare stories. Believe only government approved computer climate models (even if they do not yet generate outputs that conform to the real data we see). Accept as an article of faith that the "cause" of the "problem" is fossil fuels (even though the majority of warming in the last 200 years occurred before the Industrial Revolution really got underway). Accept only "solutions" to the "problem" like Kyoto (even though Kyoto does not bind the fastest growing nations to any curbs in carbon use, and even though Kyoto would drastically depress standards of living growth in the first world).
When anyone challenges the government story on global warming, accuse them of being in the pay of "Big Oil". DO NOT judge the data and theories on their own merits; preemptorilly disbelieve anything that does not conform to what you've read in Time magazine and heard in Al Gore's political speeches, even if it comes from Mars probes, or experts on solar energy.
-
A TAF itself is not very usefulfor several reasons:
1) readability. A TAF is not aimed at the general public:
TAF-FC ekyt 291440z 291524 25020kt 9999 sct030 tempo 1517 26020g30kt becmg 1921 27008kt tempo 2224 6000 bkn012=
Sure, there are legends explaining TAF's and METAR's, but c'mon, I mean... I bet most people don't feel like having to do a lot of work just to get their weather forecast.
2) The nowcast-nature of a TAF won't tell you anything about the weather to come, any more than looking out the window once in a while. Towering cumulus/congestus? Looks like rain.
Huge anvils on those cumulonimbus? Might even be thunder/hail/snow then.
3) I'd love a look at the TAF if I were to land my plane at some airport but the weather could be quite different where I live, not more than 30 miles away. A TAF wont tell you that.
Maps you say? Well thats a whole other story
I myself prefer a combination of the Sembach satellite analysis as a nowcast, combined with the GFS maps to look ahead in time, where I check the sanity up against ECMWF
But for a quick weather forecast, I still just flick on my tv at seven -
Re:I know the idea of actually reading a story...1. CO2 is not a pollutant. It is, in fact, the lifeblood of the planet, required for growth of vegetation. It is the cornerstone of the food chain. The increased CO2 aerial fertilization effect has contributed to the greening of the planet, as confirmed by satellite photography.
2. Water vapor is by far the primary contributor of the greenhouse effect, accounting for 96 to 99%. CO2 accounts for 1 to 3%. Methane and others trace gasses account for less than 1%. The greenhouse effect lets solar radiation in, but, like a blanket over the planet, absorbs some IR heat that would otherwise radiate out. This keeps the Earth's mean temperature somewhere around 15 C, instead of roughly -15 C. This vital 30 C swing is the reason that the Earth is habitable.
3. During the current interglacial period, the Earth has been about 2C cooler (The "Little Ice Age" around 1600-1700, when the Thames regularly froze over), and it has also been about 2C warmer (The medieval warm period around 1000 - 1200, when Greenland was colonized by the Vikings.) We are currently about in the middle of this natural variation, which occurred without manmade CO2.
4. The 500k year Vostok ice core data: http://cdiac.esd.ornl.gov/trends/co2/vostok.htm shows CO2 either in phase or lagging temperature by up to 1000 years, over four temperature oscillations. This means the CO2 does not drive temperature, but that temperature drives CO2. The most likely explanation is that the ocean outgases and releases more CO2 when temperature increases, and holds more dissolved gasses as the oceans cools.
5. I'm not disputing the Earth may be getting relatively warmer (as we are coming out of the little ice age). One reason is likely the unusually active Sun. This report: http://cc.oulu.fi/~usoskin/personal/aah4688.pdf shows that over the last several centuries, solar activity is at its highest levels. The IPCC determined that the Sun's variation in energy output were too small to explain global warming. They dismissed the sun as a likely source of Earth changing climate!. Here is a link to a recent study showing how the sun's variation could have a feedback that would drive earth's climate change: http://news.bbc.co.uk/2/hi/science/nature/2333133. stm The theory goes like this: When the sun is highly magnetically active, the increased solar wind shields us from cosmic radiation. Low levels of incoming comic radiation reduce cloud formation. Reduced low level cloud formation reduces reflectivity (i.e., the Earth's albedo). More energy is absorbed instead of reflected, and the temperature increases. The difference from an active Sun to an inactive Sun was about 3% global cloud coverage. The correlation in the study is remarkable. The jury is still out, but it could explain the correlation between the Maunder minimum of the 1600's and the little ice age, and account for the warming in the last 3 decades that corresponds with unusually high solar activity at the same time.
6. In November 1991, Danish scientists Eijil Friis-Christensen and Knud Lassen, startled the climatological world with a paper in "Science" describing a 0.95 correlation between solar cycle length and global temperature (IPCC version). "Science" writer, Richard Kerr described it as "one dazzling correlation". The blue line is temperature, the red line is solar cycle length.) As can be seen, global temperature has tended to increase in lockstep with shortening of the solar cycle length (ie. solar maxima becoming more frequent) I hope you follow the link, because one look at it, and you are forced to say, "Its the Sun, stupid." The graph is at the bottom of this link: http://web.dmi.dk/sol-jord/projekter/rum_vejr/over sigt.html
7. The best protection against climate chan
-
Re:CO2 warming a mythArg, all my links were dead in the original post do to my formatting errors. These links actually work: 1. CO2 is not a pollutant. It is, in fact, the lifeblood of the planet, required for growth of vegetation. It is the cornerstone of the food chain. The increased CO2 aerial fertilization effect has contributed to the greening of the planet, as confirmed by satellite photography.
2. Water vapor is by far the primary contributor of the greenhouse effect, accounting for 96 to 99%. CO2 accounts for 1 to 3%. Methane and others trace gasses account for less than 1%. The greenhouse effect lets solar radiation in, but, like a blanket over the planet, absorbs some IR heat that would otherwise radiate out. This keeps the Earth's mean temperature somewhere around 15 C, instead of roughly -15 C. This vital 30 C swing is the reason that the Earth is habitable.
3. During the current interglacial period, the Earth has been about 2C cooler (The "Little Ice Age" around 1600-1700, when the Thames regularly froze over), and it has also been about 2C warmer (The medieval warm period around 1000 - 1200, when Greenland was colonized by the Vikings.) We are currently about in the middle of this natural variation, which occurred without manmade CO2.
4. The 500k year Vostok ice core data: http://cdiac.esd.ornl.gov/trends/co2/vostok.htm shows CO2 either in phase or lagging temperature by up to 1000 years, over four temperature oscillations. This means the CO2 does not drive temperature, but that temperature drives CO2. The most likely explanation is that the ocean outgases and releases more CO2 when temperature increases, and holds more dissolved gasses as the oceans cools.
5. I'm not disputing the Earth may be getting relatively warmer (as we are coming out of the little ice age). One reason is likely the unusually active Sun. This report: http://cc.oulu.fi/~usoskin/personal/aah4688.pdf shows that over the last several centuries, solar activity is at its highest levels. The IPCC determined that the Sun's variation in energy output were too small to explain global warming. They dismissed the sun as a likely source of Earth changing climate!. Here is a link to a recent study showing how the sun's variation could have a feedback that would drive earth's climate change: http://news.bbc.co.uk/2/hi/science/nature/2333133. stm The theory goes like this: When the sun is highly magnetically active, the increased solar wind shields us from cosmic radiation. Low levels of incoming comic reduce cloud formation. Reduced low level cloud formation reduces reflectivity (i.e., the Earth's albedo). More energy is absorbed instead of reflected, and the temperature increases. The difference from an active Sun to an inactive Sun was about 3% global cloud coverage. The correlation in the study is remarkable. The jury is still out, but it could explain the correlation between the Maunder minimum of the 1600's and the little ice age, and account for the warming in the last 3 decades that corresponds with unusually high solar activity at the same time.
6. In November 1991, Danish scientists Eijil Friis-Christensen and Knud Lassen, startled the climatological world with a paper in "Science" describing a 0.95 correlation between solar cycle length and global temperature (IPCC version). "Science" writer, Richard Kerr described it as "one dazzling correlation". The blue line is temperature, the red line is solar cycle length.) As can be seen, global temperature has tended to increase in lockstep with shortening of the solar cycle length (ie. solar maxima becoming more frequent) I hope you follow the link, because one look at it, and you are forced to say, "Its the Sun, stupid." The graph is at the bottom of this link: http://web.dmi.dk/sol-jord/proj
-
Re:Should we have to pay twice to get weather foreThere is no national or continental weather service in Europe
This must definitely depend on which nation in Europe you talk about. In Denmark, DMI provides specialized weather reports and forecasts for aviation, shipping, and farming. DMI is a national institution and many of its services are free.
-
Re:Simulating a fiction...?
The Danish Meteorological Instistute has made a webpagewhere they describe and compare the phenomenea in the movie to those found in the real world, with the eyes of a real meteorologist.
Link is in danish only, translation: movie looks nice but is totally unrealistic.
-AC -
Re:Attn. Global warming sceptics
Has anyone claimed that temperatures are not rising? No. Only thing that people are discussing is WHY they are rising. How about this?
-
Re:icebergsJust to go along with the above, here's a good page with links to a lot of the satellite imagery of icebergs in the north.
The Canadian Department of Environment also has regular updates and warnings about icebergs and the like. Presumably were the northwest passage to open up they'd track it. (I admit I'm a bit leery of trusting the prediction - but who knows) I suspect that, baring continued war in the mid-east, the United States military would be involved as well. Admittedly it is less of an issue now that the cold war is over. But they have had quite a bit of monitoring of the arctic sea in the past.
-
Re:Practical Concerns
The Danish Meteorological Institute launches weather balloons 8 places in Greenland even in winds of 60+ meters/second (35 m/s is gale force) and blizzards. The only thing that happens is that the balloons get stretched to ten times their original length, which looks quite funny - picture a guy in heavy winter clothing holding a 10 metres long light yellow sausage-formed object in snow storm conditions...
-
Re:Very interesting
I have worked as balloon operator at the Danish Meteorological Institute, so I can tell you how this works: The winds at higher altitudes (10km+) is rather violent, often forcing the balloon to travel 100-200 kilometers eastwards (west is the prevailing direction of the wind in Denmark) during its ascent to an altitude of 30-35km. Then, at the top, the balloon tears (at that time it has expanded to a volume of 100 cubic metres from a starting volume of 1½ cubic meter) and drops gently to the ground, the torn balloon acting as a parachute. The kit is use-and-throw-away, so there is no need to chase the descending balloons (a good thing, because 90% of the balloons I launched landed somewhere in the Baltic Sea).
-
Re:Influence of solar activityThe report you cite seems to be highly questionable pseudoscience, IMHO. The author, a Phd in (he doesn't say which field) and member of the "Schroeter Institute for Research in Cycles of Solar Activity, Nova Scotia, Canada" (not a reputable institute -- it doesn't even have a website).
I've quoted some problematic statements:
"Those scientists who spread anxiety in the eighties.." [ad hominem],
"Precise forecasts that prove correct are a sharp criterion for efficient science. The protagonists of global warming remain empty-handed in this respect in spite of great material and personal expense." [false and unscientific]
"All these predictions have turned out to be untenable. It is accepted that global temperature has risen by 0.5 C in the last hundred years. Yet during the last fifty years the temperature has remained approximately at the same level, even though 70% of the anthropgenic carbon dioxide contribution was injected into the atmosphere during this time. From 1940 to 1970 the temperature fell, and according to satellitite data available since 1979, which are in good accord with balloon data [27], the trend in the lower troposphere has remained at -0.06 C per decade." [misrepresentation of the data, see here]And it's conclusion is almost gibberish:
"If we bear in mind that the correct forecasts based on the semiquantitative model of solar-terrestrial relations presented here are thinkable only if the sun's varying activity is a dominant factor in climate change, it seems difficult to resist the insight that once again an artificially constructed homocentric position is beginning to rock. A general survey of the given results indicates that climate variations are governed by the sun, not mankind." [artificially constructed homocentric position? solar-terrestrial relations?]Plus, the graph you cite has been deprecated; the authors of the 1991 study state in a new, revised 1999 report (see below) that solar variation cannot account for the warming trend observed during the 1990s. Solar variation accounts for 50% of the warming, at best, and there is clear evidence of an anthropogenic component.
From the relevant section of one Global Warming FAQ:
Is the recent warming caused by changes in solar activity?
There is no doubt that solar variability plays an important role in global climate change. Interest in the relationship between solar activity and the current global warming was sparked by a paper from the Danish Meteorological Institute, published in 1991. This found that there was a close correlation between a particular parameter of solar activity and surface temperatures, and it is discussed on this page from Stanford. More recently, however, the DMI has published an update of their work, in which they reveal that the increase in temperatures since 1990 no longer correlates with solar activity. They call it 'The fingerprint of the anthropogenic greenhouse effect'. Dr Keller of the Los Alamos National Laboratory has also researched this phenomenon, and he describes the relationship in this lecture he gave in 1998.
The detailed causes of the recent warming trend have been investigated by the UK Meteorological Office using climate models, and are presented here. They found that about half of the warming is caused by solar variability but that, in the second half of the century, these effects have been countered by sulphate emissions from volcanoes (which act to cool the earth). The overall effect of all these natural causes (sun and volcanoes combined) has been quite small. Similarly, two recent studies of ocean temperatures have found that the observed increase is best explained by the effect of greenhouse gases.
The current science seems to support the hypothesis that man-made emmissions of greenhouse gases pose a threat to the stability of the climate.
The question is "What can we do about it?" Clearly, dramatic reduction in fossil fuel usage is in order. The move to renewable solar, wind, hydro, and nuclear power, must be accelerated. Cleaner forms of transportation, such as hybrid-electric and fully-electric cars, must be promoted. Energy efficienct homes and appliances can be implemented. The list goes on.
Let's act now, while there is still time to affect the future.
-
Yeah right!Designed for the Earth's weather, the computer should be able to predict climate for the entire planet for thousands of years
Don't know about your country, but using one of the fastest computers here in denmark, the danish weather institute can't predict the weather 100% correctly even a week ahead. This new computer can't be THAT fast!