 Slashdot Mirror
Domain: skepticalscience.com
Stories and comments across the archive that link to skepticalscience.com.
Comments · 1,449
-
Re: sugar
I see you're one of the idiots...
Informative link, thanks.
-
Re:Ice Ages
The warming we're seeing is not just recovering from an ice age.
We're not trying to keep the temperature fixed at some ideal stable point. We're trying to avoid rapid catastrophic warming of several degrees Celsius in the space of a century or less.
-
Re:We've gone beyond bad science
So, you are not one of the people who has trouble recognizing which parts of AGW are settled science and which parts aren't? Is that what you are saying?
Nope, that's just you trying to act like a smart ass by implying that _you_ do.
If you want details, I believe that the following is settled:
a) Climate doesn't change spontaneously, something has to drive it
b) Global temperature is slowly going up (we keep on inventing better instruments to measure it, they keep telling us the exact same thing)
c) The only major heat source around here is the Sun
d) Greenhouse gases are the only gun producing any smoke at the moment (solar output isn't increasing)
e) CO2 is a greenhouse gas
f) Man is producing a lot of CO2 (and at the same time destroying some of the CO2 absorbing capability of the planet)On a more "personal opinion" level, I believe:
g) The public consensus in the USA on AGW is very different from the rest of the world (via. paid lobbying and paid-for media stories).
h) The AGW "debate" in the USA closely resembles the Creation-vs-Evolution "debate", ie. a never-ending game of Whac-a-Mole against arguments that sound plausible but never stand up under scrutiny, no matter how convinced the creationists were when they were parroting them. One side has to spend vast resources to produce hard evidence, the other side doesn't feel they have any burden of proof whatsoever, they just make stuff up.The list of arguments I refer to in (h) looks something like this. Maybe you've heard some of those arguments over the last few years. Well, guess what...?
Disagree? Perhaps you'd like to inject _your_ facts into this.
-
Re:How do food shortages make sense for warmer cli
-
Re:How do food shortages make sense for warmer cli
-
Re:How do food shortages make sense for warmer cli
-
Re:It's the end of the world as we know it
The trouble is that the rate that we are emitting carbon dioxide into the atmosphere far exceeds the rate at which plants can absorb it.
-
Re: sugar
-
Re:Guess they didn't get the memo...
See the temperature escalator I mention above.
-
Re:When do we reach ...
You're referring to the temperature escalator. According to the escalator, it's always cooling!
-
Re:Big Models
I see you bought a nice bunch of cherries from Anthony Watts.
Sadly the only thing it proves is your (and Judith Curry's) lack of education on the subject of statistics. Note I am actually being generous here by assuming that Curry doesn't understand her mistakes. -
Re:Oh Look --
I was quite please to get so far through the comments before a post by an idiot denier.
Then you find the "proof" of warming down at the bottom. A carefully excised anomalous temperature chart that. 0.5C total range with a tail pointing down.
The "tail" seems to be wagging your dog.
This graphic illustrates the stupidity of your view. http://www.skepticalscience.co...
Plot the temperature folks. It ain't hard. BEST has it available for free. http://berkeleyearth.org/data
BEST, a study financed by deniers, hiring the team and setting the goals in the hope of producing an anti-AGW result. And the conclusion was: AGW is real.
I have been pawing through the data from each station.
As you're not a scientist, that's a sure sign that your denial comes from mental illness.
-
Re:Roy Spencer has other motivation.
-
Re:Roy Spencer has other motivation.
-
Re:Roy Spencer has other motivation.
-
Re:A very interesting answer
What is it with Americans and taking quotes out of context? Come election season, you see these appearing almost daily on both sides, and they seem to be taken strangely serious too.
In case you didn't know, an out-of-context quote can give an awfully skewed impression, even more so if it is ripped from informal communications. Here is a more complete story, including how a discussion of the papers in question was included in the IPCC report. It concludes with:
Despite being heralded as “the final nail in the coffin of anthropogenic global warming”, Climategate did not even demonstrate corruption of the IPCC process, let alone corruption of the climate science community. In any case, the CRU scientists' influence extended to a couple of IPCC chapters covering only a small part of the large body of evidence for anthropogenic global warming. That mountain of evidence cannot be explained away by the behaviour of a few individuals.
-
Re:Predictions were made in the 1970s then?
There we go again, long-discredited climate myth #9.
Also relevant. -
Re:Predictions were made in the 1970s then?
There we go again, long-discredited climate myth #9.
Also relevant. -
Re:As we've always said
Why would you trust the selection of data from a single scientist (who also happens to believe in intelligent design, which indicates to me that this person may have an agenda beyond pure scientific analysis) versus the selection of data from hundreds of scientists who all agree?
If you have a longer range of data, you can see that the climate models and observation are very close. How reliable are climate models?
Further reading about climate models, and the predictions they made and got right: http://ossfoundation.us/projects/environment/global-warming/climate-models
-
Karl Popper's "Republic of Science"
If consensus were a scientifically valid measure of anything, we'd still be in the stone ages.
Perhaps that's why you have so much trouble comprehending this issue, go and read about Karl Popper's "republic of science" and tell us all how that is different from "consensus". At the end of the day Science is a philosophy, your own track record of posts on AGW indicate you are unable to apply that philosophy to real world questions. You clearly judge your sources not by their content but by their political colour, which is why you link to Anthony Watts and avoid the internationally recognised leaders in the field such as Mann or Hansen.
This post is no different, first you say a valid survey means nothing, then you say it's wrong, then you say another survey, the Petition Project, proves the opposite. Think about it like Karl Popper would, why do accept the politically inspired survey at face value but reject several other much more rigorous surveys that clearly show the opposite conclusion. If that's not enough to convince you that you are being used as a useful idiot then just look at the tortured logic of your post, all to try and prove black really is white. -
Re:Predictions were made in the 1970s then?
Well you certainly didn't. Predictions require statements about the future. The selecting of 1998 as a start year by you and the other denialist morons is due to the fact that 1998 was the hottest year on record. Starting from that fact and ignoring all data before is a thing called "cherry-picking" and is only possible in retrospect.
It also requires complete ignorance of the fact that the normal period of averaging is 30 years. Making it impossible to judge a climate trend on anything as short as 15 (10? 11? 12? 13? 14?16? 17?) years.
Finally one notes that if you do ignore the definition of climate and just consider a start year and a finish year, all within the last 30 years, nearly all such lines are warming.
The scientists in the the 1970s were making predictions. You're just being a backwards looking moron.
-
Re:As we've always said
Incredible. I'm looking at that graph right now. Amazing how often the warming "stalls". It "stalled" at 0.0C between 1970 and 1977. It "stalled" at 0.1C between 1978 and 1986, then at 0.3C between 1987 and 1997, then at 0.4C between 1998 and 2003, and most recently, at 0.5C between 2004 and 2013.
I wonder how hot the next "stall" will be?
-
Re:BS junk science
Incorrect - the world has continued to warm. You need to update your knowledge, please see http://www.skepticalscience.co...
It'd help you to wander around that site - they're on top of recent developments and watch new papers as they come out.
-
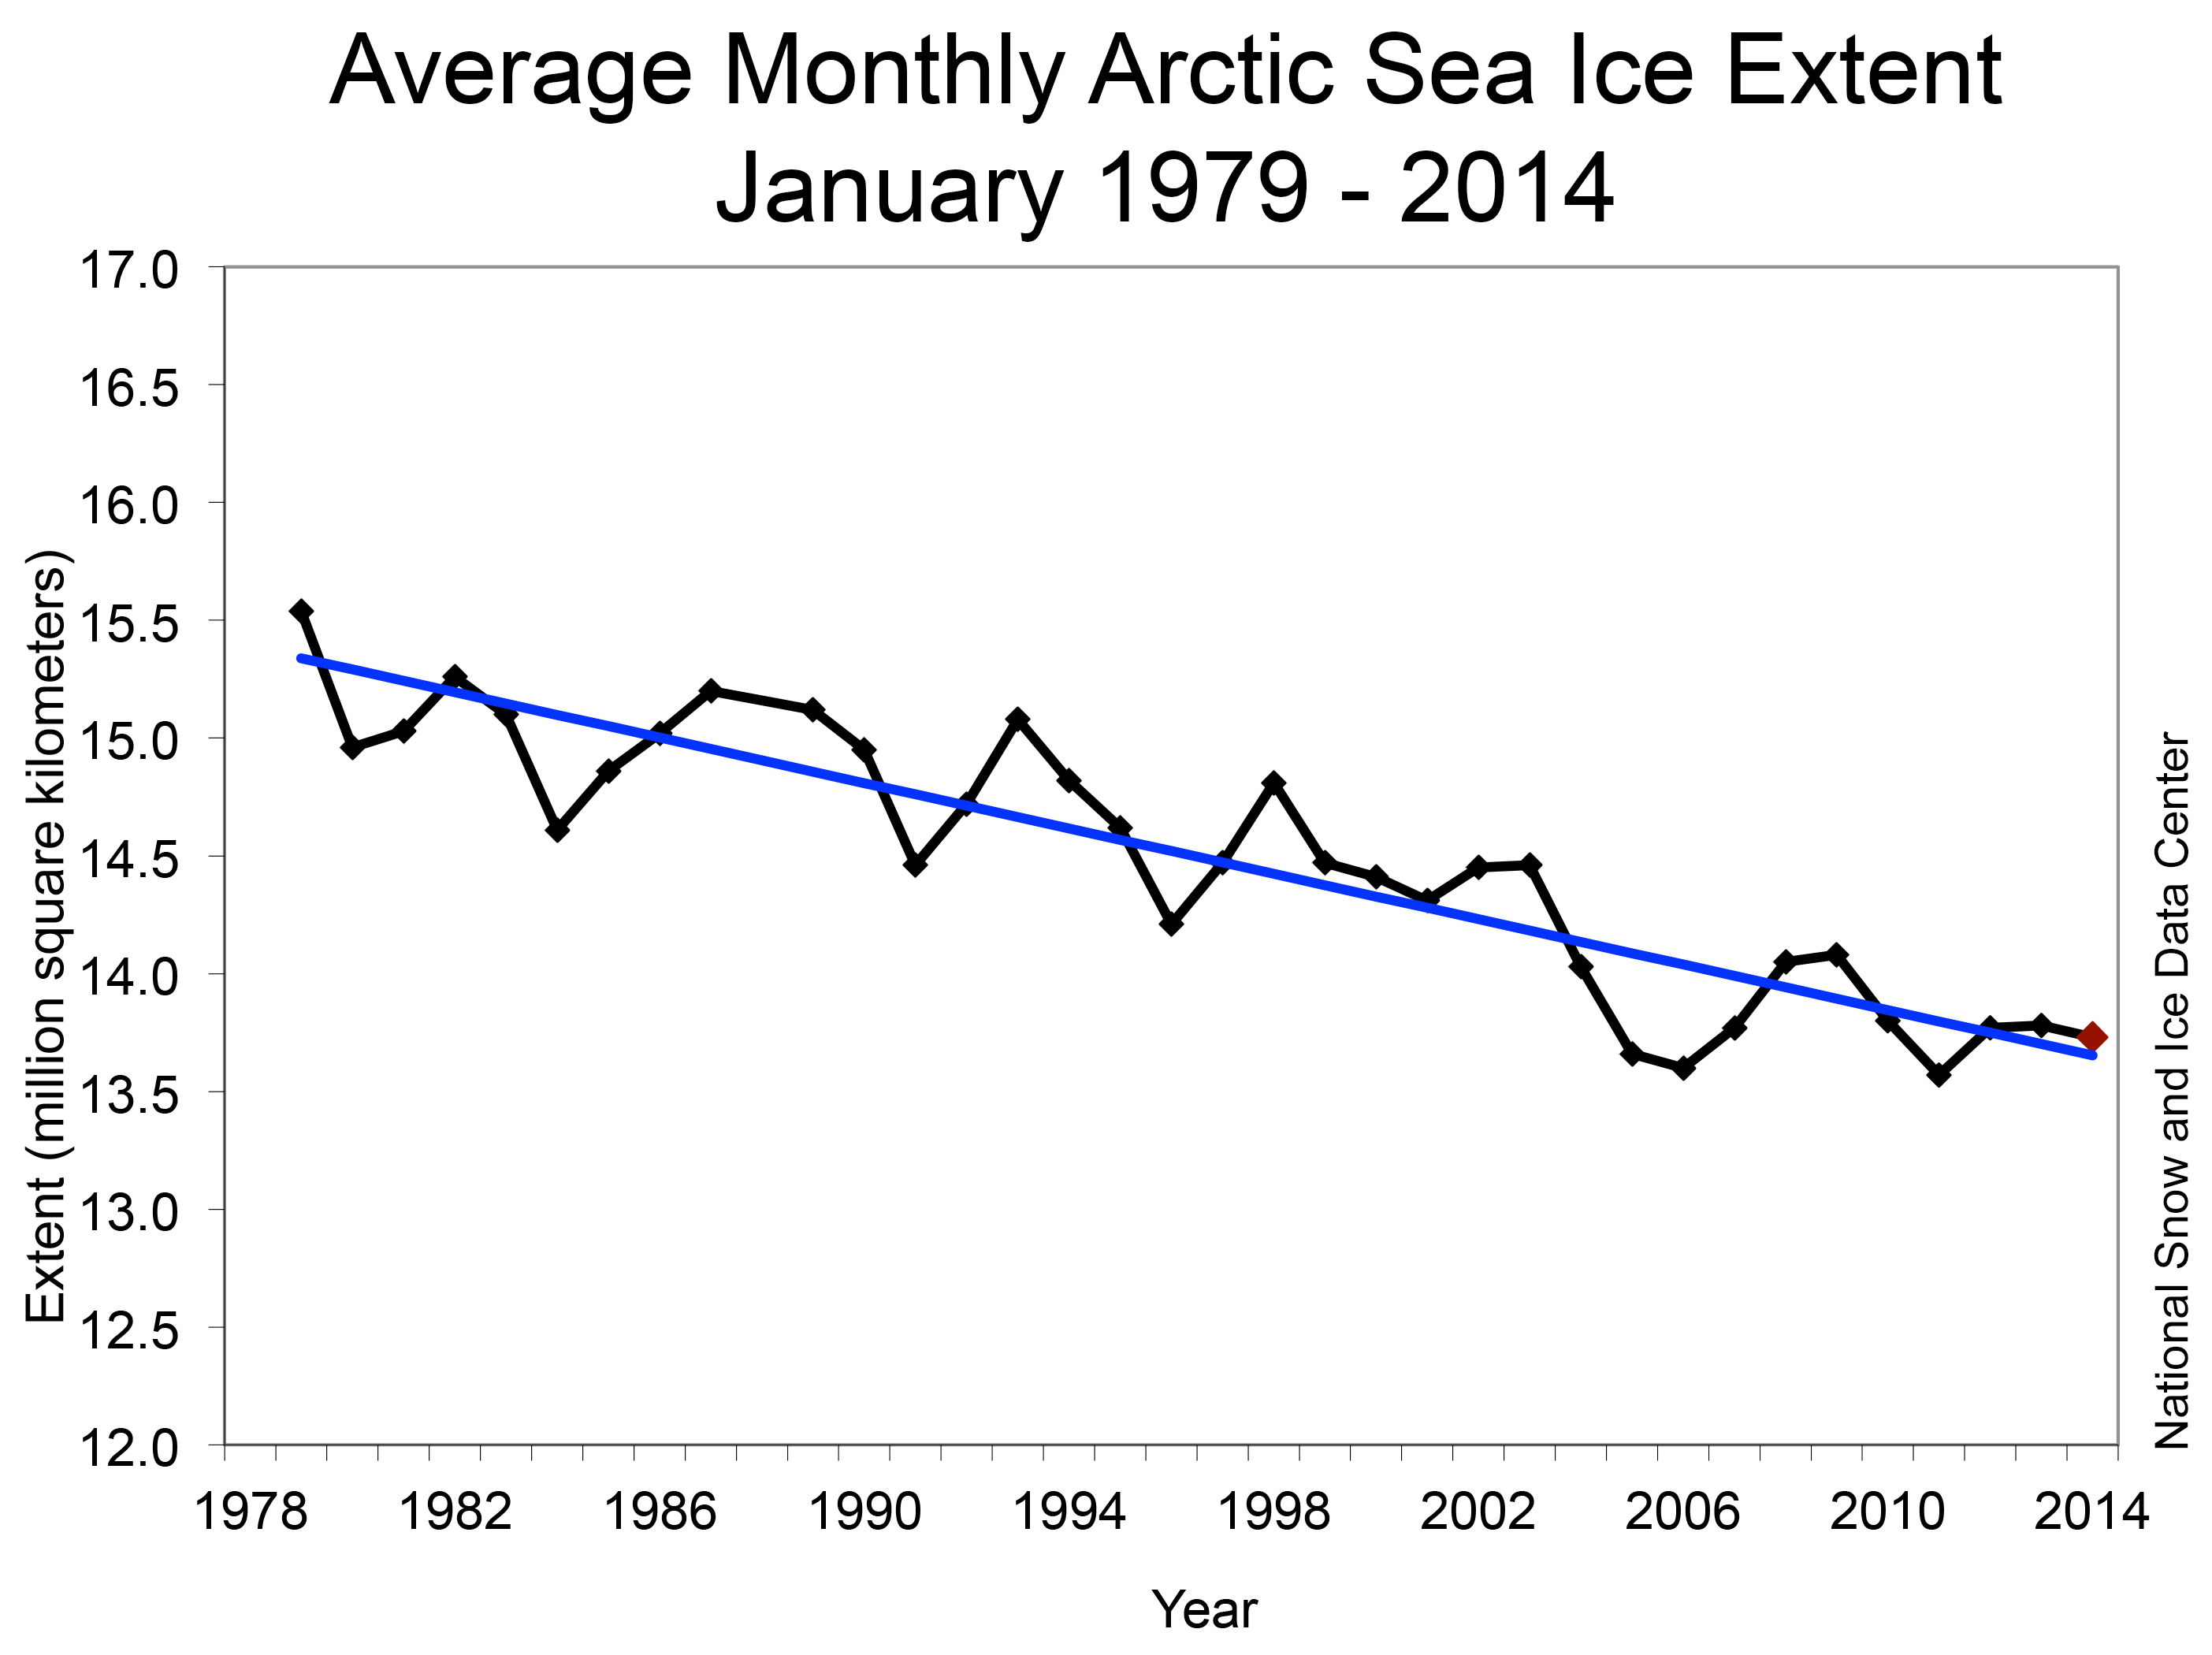
Re:There are two "Arctics"
The sea ice extent is the surface area of ice that is floating in the sea. Unfortunately, there is more ice floating in the sea because it's calving off the land. The total volume or mass of ice in the Antarctic is decreasing.
-
Re:Maybe if the US stopped using fraudulent data
Now we just need to convince the Arctic ice, Antarctic ice, and Greenland ice sheet to stop their damn melting. Please do tell them about the fraudulent data they're using.
The further north you go the more liberal you get, the US north is more liberal than the US south, Canada is far more liberal than the US north, and Northern Europe is notoriously liberal.
The Arctic ice and Greenland ice sheet are so liberal they're gay married and are probably melting just to collect welfare and refreeze later with the free health care. The damn commies are further left than Sean Penn's dry cleaned underwear.
-
Re:Maybe if the US stopped using fraudulent data
Now we just need to convince the Arctic ice, Antarctic ice, and Greenland ice sheet to stop their damn melting. Please do tell them about the fraudulent data they're using.
-
Re:I called it.
That would be the Richard Lindzen who has been consistently wrong about Global Warming?
-
Re:here we go again
Species adapt to climate change by migration and/or evolution, both of which have rate limits past which extinctions become more likely. In light of this, why should the total be more important than the rate?
Because otherwise we would have huge extinctions ever spring and fall when CO2 is shifted into and out of deciduous plant leaves in the Northern hemisphere.
And keep in mind that we don't know what the actual rate of change was from year to year for the various extinction events discussed. Those studies you cited discussed total changes, couching in the language of average rate of change.
My opinion is that the Great Dying involved huge variability, perhaps from year to year. When you take two CO2 estimates, one at the beginning and one at the end, and draw a line straight through that, you are missing completely the important details of what happened.
I think this is quite relevant because I don't actually see a significant amount of stress put on species diversity from current AGW. My view is that most species (including plants and corals) are mobile enough to adapt to the current and near future projected rates of change. Habitat destruction is a different story, but even then, we're not comparing as you put it, "apples and oranges" when we compare a modern species extinction event with a prehistorical one.Just suppose the national academies are right to say that we should try to limit global warming to "only" 2C. All else being equal, warming is proportional to cumulative CO2 emissions. Here are three different ways to achieve that. Notice that the longer we wait to address the CO2 problem, the steeper our emissions cuts will have to be.
Note that you actually present no way to achieve reduction of CO2 emissions since the graphs in question just describe what would happen, if you did manage to find a way to reduce CO2 by the rates specified.
They also completely ignore why CO2 emissions occur. I could come up with similar graphs while trying to lose weight. Cutting a few percent of my calorie intake each year sounds like a great idea, until you pass the point of starvation and die as a result. There are huge costs associated with attempting to reduce CO2 emissions - especially if it is not universally embraced and someone uses it as a means to surpass everyone else economically.
Also, I think the 2 C set point was deliberately chosen to sell the "we need to act now" story. If instead, you pick 10 C, the PETM level of temperature rise, you can wait significantly longer, especially if, as implied by the recent IPCC report, the temperature sensitivity of CO2 emissions is significantly lower than advertised.
My view is that CO2 emissions fundamentally happen because we are running advanced technological societies and moving billions more into these sorts of societies. That is more than a fair trade for a slightly adverse climate outcome.
If you really are concerned about species extinctions in raw numbers, whether from any sort of climate change or for any other reason, then you need to tackle the real obstacles - habitat destruction and invasive species. If you just care about maintaining viable ecosystems, then it really boils down to habitat destruction. My view is that actually addressing AGW would cause more environmental damage than it fixes. Impoverished people don't care about the environment. -
Re:here we go again
It's an estimate with order of magnitude error right there in time and another significant error in CO2 quantity (with a ceiling of 2 PgC incidentally rather than the 1 PgC claimed in the article).
The quote from that review paper is a summary of references 54-56 which are Payne et al. 2010, Wignall 2011 and Shen et al. 2011. The quantities of carbon come from Fig. 3 in Payne et al. 2010, but the 20kyr timespan comes from Shen et al. 2011 where it only refers to the second carbon isotope excursion. The PgC/year range is a summary of all those references' PgC/year estimates, but with each using their own quantities and their own timespans to avoid mixing apples and oranges.
We also don't have a good idea what else was released, which might have been more lethal than the CO2 (for example, sulfates or fluorides).
A few sentences down in Honisch et al. 2012:
"Knoll et al.(59) inferred the preferential survival of taxa with anatomical and physiological features that should confer resilience to reduced carbonate saturation state and hypercapnia (high CO2 in blood) and preferential extinction of taxa that lacked these traits, such as reef builders (32)."
To be consistent with the fossil evidence in Knoll et al. 2007 (PDF), your "more lethal" extinction mechanism would have to have the same marine extinction pattern as that expected from a massive release of CO2. Also, the PETM doesn't have an obvious volcanic culprit but does have a carbon isotope excursion, rapid warming, and a similar (albeit smaller) marine extinction pattern.
Finally, it's worth noting that even if your assertion is complete and accurate, it would take at minimum a millennium for current rates of CO2 production and 13,000 PgC (the lower bound) to put enough CO2 in the atmosphere to match the impact of this extinction event. The upper bound increases that to over four millennia. We should be able to figure things out long before that happens.
Species adapt to climate change by migration and/or evolution, both of which have rate limits past which extinctions become more likely. In light of this, why should the total be more important than the rate?
What is the hurry? Sure, we don't want to run the situation out for a few millennia until we end up in a huge global extinction event. But we can figure things out in far less time than that.
Just suppose the national academies are right to say that we should try to limit global warming to "only" 2C. All else being equal, warming is proportional to cumulative CO2 emissions. Here are three different ways to achieve that. Notice that the longer we wait to address the CO2 problem, the steeper our emissions cuts will have to be.
-
Re:good
Yet we are still in a global temperature stall.
and not a single model comes close to predicting it.
The best worldwide dataset we have (the satellite data that Dr. Spencer uses) doesn't show the heating (where modern climate theory says it should happen the strongest - mid-troposphere).
No data confirms the models.
false Sensing a trend here?
So which do you believe?
Oh gee, dunno.
-
Re:Climate change...
Where there doesn't seem to be a strong consensus is whether it's entirely man-made
This review of scientific literature found that 97% of papers that took a position agree that warming is man made: http://skepticalscience.com/97...
-
Re:Show me a climate model for the past 16 years
If the climate scientists have a model that accurately predicted the past 16 years then we can talk about the future.
There are no models that did prediction 16 years ago. The Hadley Centre's had DePreSys predicts a decade, but that only came online in 2007, not 1997.
So your requirement for talking about the future is set at impossible.
That is stupid and dangerous. Talking about the future is both sensible and important.Until then the predictions of gloom and doom are about as believable as the heavens-gate cult.
0.8C temperature rise over the past 100 years, all in a spatial and temporal distribution that matches the CO2 greenhouse effect.
Measured energy imbalance at the top of the atmosphere, demonstrating warming.
Continued sea level rise, demonstrating energy absorbance, either my melting ice sheets or my warming oceans, and thermal expansion.
Extinction pressure on many ecosystems because of changing rainfall, temperature, and phenological changes.
And you claim these observations are from predictions as believable as heavens-gate cult, because the last 16 years, the warming trend has only been about 0.05C per decade.
Much like the "pauses" in warming in 1978, 1987, 1997 and 2003?
I don't think you've thought this through. -
Re:Which shows that people don't understand
Changing definitions and arguments do not help also: change means increase in extremes, but the original argument and studies used median temperatures? now in winter is climate change but then in summer it will be global warming again? the polar bears will go extinct in 2010, no, wait, in 2012, no, wait, in 2013, no, wait, in 2014... in the mean time, the climate scientists studying the phenomena got trapped in ice? The arctic disappears but the antarctic grows and the explanation is *global* warming?
Here's a nice link explaining global warming vs climate change, how they relate, and a bit on the history of the terms: http://www.skepticalscience.com/climate-change-global-warming.htm
-
Re:Not the sun
You're referring to the temperature escalator. That argument uses cherry picking to throw away most of the temperature data to arrive at that conclusion. It's one of the tactics of denialism.
-
Re:Localized Global Warming?
I think you're referring to the temperature escalator. It's a method of cherry picking data to show a short-term cooling trend even though the long-term trend is warming. In this case, you're ignoring all data before 1998, which was the year an unusually strong El Nino produced warm weather.
-
Re:Egocentrism
Climate is like the probability a side of a die will land up, and weather is like one particular die roll. Let's say you have a die and the probability that it will roll a 1 is increasing and the probability that it will roll a 6 is also increasing. You cannot tell from any one particular die roll whether that is evidence that the probabilities of the die rolling particular values is changing. But if you graph the die rolls over a long period of time and observe the change in probabilities empirically, that is evidence that the probabilities are changing. Any particular roll of a 1 or a 6 proves nothing, other than the probability of rolling a 1 or a 6 is not zero. But if you roll the die 100 times and observe 50 of those rolls are a 1 or 6, that does say something about the distribution of die rolls, in particular that the die does seem to now be favoring 1 and 6 results.
Similarly, we can graph the number of record highs we observe and the number of record lows we observe. If we graph these results and observe that the ratio of record highs to record lows is increasing over time, it does appear that the climate is changing toward warmer. This is exactly what we observe. No one particular record high or record low shows this, however. You cannot do statistics on a sample of one.
-
Re: In the middle of summer
Very hard to get studies that go against the dominant paradigm published.
Yes - the dominant paradigm of requiring evidence must really put a kibosh on this and other similiar theories, such as the moon being made of green cheese. The only surprise is that you are suprised that nobody takes this guff seriously.
We submitted these findings sequentially to Science Magazine, Nature, and Nature Climate Change. The editor of Science Magazine replied that the results were not of sufficient general interest, suggested we submit the work to a specialty journal, and declined to proceed with external scientific review. Nature also rejected the paper without external scientific review, for reasons that we considered spurious. Nature Climate Change initially rejected the paper, but after some discussion the paper was assigned to a senior editor and reviewed by two anonymous reviewers. Given the context of their comments, both reviewers appeared to be climate modelers. With reference to analysis of Vostok series. [wattsupwiththat.com]
This is the same Anthony Watts who gets a salary from the Heartland Institute to tell lies about climate, who once claimed that he had personally falsified the HADCM3 model (a claim quickly proven to be utterly wrong), and then later claimed the IPCC AR5 would halve the estimate of climate sensitivity (only to be proven wrong several days later) - and then did not bother to publicly correct his remarks? That guy?
Do you by chance take financial advice from scammers as well?
Still, here's the Vostok temperature graph [rocketscie...ournal.com] and here's the Greenland temperature graph [drtimball.com].
Except that isn't Taylor's or Jacksons graph. It's Easterbrook's graph. It's the infamous graph by Easterbrook that caused a scandal and embarrassed the denialist movement and threw egg in the face of it's oil industry backers.
Read the whole sorry saga here Who told you it was Taylor's graph? If Taylor submitted that graph as his work, he is lucky his paper was just rejected. He could well have been accused of fraud, given the circumstances.
Do you see unprecedented present day warming, or do you see current temperatures being well within the range of natural variation?
In the actual greenland ice core data, rather than a set of data explicitly defined to exclude the last 120 years of climate data? Yes.
With respect to the laws of Thermodynamics, climate sensitivity is low, as the IPCC are slowly admitting.
It's convenient you choose to use the IPCC (AR5) as the source of truth on sensitivity. Since AR5 says that sensitivity is holding steady at 2.1, whereas the uncertainty has decreased. Which makes all your previous statements on the subject a nonsense. Congratulations.
-
Re:Cue the climate change deniers ...
No. Global warming is the observation that the mean temperature of the earth has increased over the past several decades, as shown in this graph. Only warming is proof of warming. We can also see effects of this warming, such as the Arctic ice and Antarctic ice melting.
-
Re:Cue the climate change deniers ...
Sigh. Take a look at this graph and read the article.
-
Re:Cue the climate change deniers ...
http://www.skepticalscience.com/climate-change-global-warming.htm
TL;DR: Both of the terms in question are used frequently in the scientific literature, because they refer to two different physical phenomena.
-
Re:Just remember now...
What does the raw data show? The satellite and balloon data is raw - and covers the entire world.
If it's the raw satellite data then Dr. Spencer is being wilfully obtuse or deliberately misleading, he should know by now that the raw data has errors due to satellite drift. From a paper from one of his fellow climate change "skeptics", John Christy:
Previously reported discrepancies between the amount of warming near the surface and higher in the atmosphere have been used to challenge the reliability of climate models and the reality of human-induced global warming... This significant discrepancy no longer exists because errors in the satellite and radiosonde data have been identified and corrected. New data sets have also been developed that do not show such discrepancies.
If he's using known bad data, then it should be no surprise that he's getting the wrong results.
-
Re:This whole incident...
Your facts don't suggest anything because they are in fact false. http://www.skepticalscience.com/going-down-the-up-escalator-part-1.html
-
Re: In the middle of summer
Here's a graph that shows how you're looking at things. It's called cherry picking your data.
-
Re:Just remember now...
When I was a wee lad, the "settled" climate science was that Earth was cooling, and we were careening head-on into a new Ice Age that was going to destroy us all.
No, it wasn't. What this statement shows is that you don't know the difference between a new reporter and a scientist. There was a little media hysteria over the possibility of a ice age, but the science supported warming over cooling at nearly 6 to 1 already by that point. The debate at that time was over whether the natural cooling effects that causes ice ages could overcome anthropogenic emissions (which were quite a bit lower at that point).
Then, as science, data collection, and computer modeling advanced yet further... "Global Warming" has been called into question. So much so, in fact, that many of the climate scientists of today will not use the phrase "Global Warming", but have chosen the trademark of "Climate Change". It's back to "we're not sure what's going on but we're all gonna die!" "Climate Change" is a delightfully vague yet alarming turn of phrase, and a stroke of genius.
This is also false, the IPCC has never been the IPGW. Many people don't understand this, but global warming is a specific effect of climate change. Just like warming is just one type of temperature change. The IPCC's mandate is to study climate change, whatever it is. Global warming is what we're currently getting from anthropogenic greenhouse gas emissions. The only people I'm aware of who tried to change the name for the phenomenon from global warming to climate change are George W. Bush's political advisors who suggested that climate change was less likely to disturb voters.
So now, every time something odd, unusual, rare, extreme, or even normal happens with weather, it can be attributed to "Climate Change" -- because something changed, see? Climate Change equals different weather, so something in weather that didn't happen last year or the year before is now because of Climate Change.
That is not at all what climate change means. Climate change is about changes in the long-term baseline for weather, so yes if new events are possible because the average amount of rain fall or temperature (for example) has changed over the long term, then climate change may be partially responsible for a new extreme weather event. For instance if you increase the average temperature by 1 degree over the long term, you also increase the maximum reachable temperature by one degree and the minimum reachable temperature by 1 degree (simplistically, it's actually a lot more complicated that). Regardless of that change, individual events aren't general regarded as scientific proof of climate change but changes in the distribution of events can be. For instance, in a stable climate you would expect a roughly 50-50 split over time between record highs and record lows and that the number of new records overall would decrease over time. For the last 20 years or so we've been looking at around 66-33 for the high/low split, and the difference between the number of record highs and record lows is increasing, plus the number of record highs is not falling off at the rate we would expect for a stable climate.
Go ahead, Climate Change bigots. Mod me down. I've got karma to burn. I could post AC, but I'm thumbing my nose at you.
You know, it'd be more effective if anything you wrote was actually correct.
-
Re:Just remember now...
First, it is important to note that Dr. Roy Spencer has a track record of providing misinformation on climate issues.
Looking at his graph and notes, I don't understand why he chose 1979 as the starting period for his graph, and what he's done to model runs that start after 1979 to extend their trend lines backwards. I would expect a single line with many points of divergence along it to show where each model begins to overestimate warming, the fact that they all seem to start overestimating by 1982 is a clue that someone is playing games with the data. Furthermore, just from looking at the graph it appears to be indicating that the average of the models is between 0.3 and 0.4 degrees per decade. That is significantly higher than the average from the IPCC1 report (which was between 0.15 and 0.3 degrees per decade) so where are these numbers coming from? Did Spencer cherry-pick the worst performing models for his graph or did he alter the results produce by the models in some way? The attached commentary doesn't provide the data or explain the methodology used to generate the graph.
Additionally, the only two reference points are an average of two sets of satellite data and 4 balloons? Where are the ground temperature series in this graph?
Skeptical Science has posted several blog posts that show a much closer match between models and observation, so I'm inclined to believe that Spencer screwed it up unintentionally or otherwise.
-
Re:AGW is religion, not science
Every single one of your points has at least one fallacy, false assumption or outright lie in it. Additionally, the vast majority of your links point to well-established sources of disinformation. Posting a large amount of such drivel makes it prohibitively time-consuming to write a nice point-by-point rebuttal. However, that doesn't make them any more true.
Just a random pick of the long-discredited climate myths you regurgitated:
* #9
* #51
* #10
* #119 (it's that far down the list because the smart deniers are busy pretending they never used it). Also on that subject: this and this. Also, your wattsupwiththat.com source makes a huge leap of logic by assuming the 2 scientists were filtered out based on their answer to the first question as opposed to the more mundane explanation that they were filtered because they didn't fill in the second question, which is common practice in this kind of studies and leads to the fluctuating "total sample" numbers that are ubiquitous in the literature. Also, even if their questionable assumption were true, 94.9% still counts as a consensus. Also, it is quite ridiculous of you to compare absolute numbers from polls that were conducted on a different scale (10,257 earth scientists vs. the 10 million science graduates that live in the US). Not to mention that the studies are of a fundamentally different design, with one being reasonably well-designed, and the other one, not really...
* Bald eagles and wind farms, really? How does that even say anything about climate change? Other than that people who are smarter than you are sufficiently concerned about it that they're willing to sacrifice an insignificant percentage of a species that, although iconic, is classified as "Least Concern" by IUCN?