 Slashdot Mirror
Domain: wordpress.com
Stories and comments across the archive that link to wordpress.com.
Comments · 7,349
-
Re:Reading TFA
I'm not remotely interested in Chrome, but I want to see what's in store for Firefox about 2 releases from now.
this is clearly a joke....but if you actually want to see whats in store for firefox 'about 2 releases from now' just start using the firefox Nightly branch:
they recently implemented a new http cache http://www.janbambas.cz/new-fi...
they moved the preferences into the webpage area instead of in a popup window http://msujaws.wordpress.com/2...
in windows theyve implemented OMTC https://wiki.mozilla.org/Platf...
and they have been continuing work on their one thread/process per tab project.. https://wiki.mozilla.org/Elect...
-
Re:Meanwhile, in reality world...
No, I'm happy to have a multiple line hypothesis. Heck, take a few paragraphs if you need to. Pages even! But the hypothesis shall be falsifiable, contain specific observations that would falsify the hypothesis, and a logical argument that the *lack* of those observations can only lead us to conclude the hypothesis is true.
Yeah, I'm not that motivated.
It's absolutely testable - finding an anachronistic fossil in the precambrian, such as that of a modern rabbit, would falsify it.
You seem to think that "test" means "lab experiment" - they really aren't the same thing. You can test a hypothesis by making a falsifiable prediction, and looking for observations that match - astrophysics is filled with stuff like that, since obviously we can't just setup experiments of solar systems and galaxies.
But you need the falsifiable prediction. No fair going, "if I see more droughts here, or if I see more floods here, AGW is right!" or "if Cancers are sometimes honest, but other times dishonest, astrology is right!"
-
Re:The FCC has no right to dictate terms
#1 is critically important. It is my understanding that getting land rights to put up poles and lay cable is the largest hurdle for many potential providers, to the point of making it cost prohibitive. And who is lobbying to keep it that way? The one provider already in the area. This must be fixed. I agree with you that a free-er (as opposed to completely free) market solution is the best. We just need some ground rules to ensure that competition can be made fair.
Too many people are looking to strong-arm the companies with strict regulation instead of looking at the situation and providing an environment in which the free market can work. We haven't really had a chance for the free market to work, and #1 is a great example of why, so we haven't seen what the free market can do in this sector.
Let's try the less-government solution first. If that doesn't work, then we can go to the more-government later. We can ALWAYS get more government later. It's excruciatingly difficult to go the other direction.
No, you idiot, because this: http://trillastravels.files.wo...
-
Re:The FCC has no right to dictate terms
With all due respect, you don't know anything about line construction. Do you want this hanging outside your house? While overstated, that is essentially what you'll end up with.
-
Re:The Science is settled!
By the way, anyone who's interested in showing that there's no scientific consensus on AGW might want to visit Brandon Shollenberger's survey and suggest improvements. Brandon started this survey right after being threatened with a lawsuit by "Skeptical" Science's John Cook's university for disclosing leaked data.
-
Re:Where does 7 feet of water come from?
I'm sure you vastly underestimate the amount of heat required to raise sea-levels that much by melting ice.
consider 7 feet in the next 86 years. or 2,133.6 mm,
1 mm / (2.78 microns / Gt) = 10-3 m / (2.78 x 10⁻⁶ m / Gt) = 360 Gt, Conversion factors for ice and water mass and volume,
2133.6mm * 360 GT/mm = 768,096 GT,
334 Kj/Kg, 10^12 kg = 1 GT;
768,096 GT * 334*10^12 Kj/GT = 2.56544064e+20 Kj OR 61,315,502,868.069 kT nuclear explosion! -
Re:CO2 and climate: my take
What Santer said is that it takes at least 17 years for statistical significance to emerge. Tamino wrote a good post about the current situation called Uncertain-T.
-
Re:CO2 and climate: my take
For starters, the models can't predict the influence of aerosols, the sun, or ENSO cycles. 1998 was a peak El-Nino year, with a record heat, so this skews the results for the interval starting at 1998. It is instructive to look at the temperature data, but compensate it for those three factors. The result shows an unmistakable trend, that has not paused at all: http://tamino.files.wordpress....
-
Re:Bad move
Some criticism of Mr. Lerner's DPF fusion approach by a person who seems to know what they're talking about. http://mikebhopkins.wordpress....
It really does look like he's just rebuilt a standard pinch device.
-
Re:EROEI?
Yes, and they also have been taken down by a plasma physicist for complete nonsense: read this if you dare.
The title of this article says it all: "Why Lawrenceville Plasma Physics Results are Not Even Wrong; a Detailed Analysis." Ouch.
-
Especially When...
Any time someone says "look how bad winter was" they are (rightfully) chided for treating a variation in weather as being "climate".
Especially when it is very localized.
That's the mean of temperatures at all Historical Climatology Stations in the U.S., for Jan. 1 - May 17 2014. So even when the warmth in CA and AZ is included, on average the U.S. has still been experiencing record cold this year.
Weather vs. climate, indeed. -
Re:ANOTHER DEAD BODY! SWEET JUSTICE!
The strange concept is that you would bring up gun control when the statistics don't back you up. Over the last decade, the percentage of officers killed on duty, by guns vs other causes, in Britain is slightly HIGHER than it was in the United States. The US is far more violent than Britain, but guns do not contribute to that nearly as much as you would have others believe.
Do you have a source for that? According to the site linked below (which includes citations), "In the US – population 311.5 million – there were an estimated 13,756 murders in 2009, a rate of about 5.0 per 100,000. Of these 9,203 were carried out with a firearm. In the UK – population 56.1 million – there were an estimated 550 murders in 2011-12, a rate of about 1.4 per 100,000. Of these 39 were carried out with a firearm." I couldn't find similar statistics for police officers, but you're obviously pretty sure of your facts so I thought I'd ask. http://fleshisgrass.wordpress.com/2012/07/24/us-and-uk-murder-rate-and-weapon-updated/
Ok, I have an interesting exercise for you, since you're so good at finding the numbers. take the US murder number, but subtract out the murders committed in Chicago Metro, New York City Metro, and Washington D.C. Metro areas. Yeah, those areas where it's almost impossible to own a gun legally. You know, GUN-FREE zones. Subtract out those murders, and tell me what the rate is then for the rest of the US. You'll find it's very close to the rate for the UK. The murder problem in the US is that GUN-FREE metro areas have astronomical murder rates. Yeah, crazy, I know!
So, since the REST of the US has all the guns, and the murder rate of the REST of the US is no higher than in the UK, I guess guns really are NOT the problem, are they? It sounds trite, but it's true - Guns don't kill people. PEOPLE kill people.
-
Re:ANOTHER DEAD BODY! SWEET JUSTICE!
The strange concept is that you would bring up gun control when the statistics don't back you up. Over the last decade, the percentage of officers killed on duty, by guns vs other causes, in Britain is slightly HIGHER than it was in the United States. The US is far more violent than Britain, but guns do not contribute to that nearly as much as you would have others believe.
Do you have a source for that? According to the site linked below (which includes citations), "In the US – population 311.5 million – there were an estimated 13,756 murders in 2009, a rate of about 5.0 per 100,000. Of these 9,203 were carried out with a firearm. In the UK – population 56.1 million – there were an estimated 550 murders in 2011-12, a rate of about 1.4 per 100,000. Of these 39 were carried out with a firearm." I couldn't find similar statistics for police officers, but you're obviously pretty sure of your facts so I thought I'd ask. http://fleshisgrass.wordpress.com/2012/07/24/us-and-uk-murder-rate-and-weapon-updated/
Unlike the U.S., the island states of Japan and Great Britain have had centuries of unilateral culturalism--only a century or so for Canada and the island continent of Australia; their populations being about 20 million caucasians each. Otoh, there are over 200 million homes of different cultures in the U.S containing firearms.
Of the gun deaths in the States, most (about 65%) were suicides; others were related to self defense; and then there darwinian accidents.
Here's an incomplete list (incomplete due to issues with authorities and the dissemination information) of an interactive breakdown of gun deaths for 75 of the 200 countries in 2014; interactive, because you can reorder a column by clicking on the column's header to see the countries with the most deaths by accident, suicide, murder or overall total.
Here's a reordering based on the ones with the highest homicide rate:
Honduras
El Salvador
Jamaica
Venezuela
Swaziland
Guatemala
Colombia
Brazil
South Africa
Panama
Mexico
Paraguay
Nicaragua
Costa Rica
and finally next: United StatesYes, I guess we could take the guns from the people in the U.S. (that everyone likes to illegally immigrate to) except for the police and their friends or family, but it'll probably mean that we will become more like the rest of "gunless" Latin America.
A lot of these deaths are planned executions, staged to look like self defense. Afterall isn't it alright to kill someone if the victim deserves it; think about human nature and how one would react if someone with a thug-like demeanor came at them in everyday wear. Maybe this one wasn't a setup, there's no way of knowing since employees of the police department don't respect the idea of humanity; instead a self-serving professionalism that lacks accountability to the community.
Enjoy the future of a living hell for the powerless unable to have anything that can be used for self defense. If you're randomly searched and found with a pair of scissors, screwdriver or pen knife, it'll be decreed you were going to use it as a weapon. (This happened to myself . This one was about having fun harassing someone they mistakenly thought was gay due a nearby event I was unaware of. It was okay, since they thought I was a victim that deserved it.)
The same thing can and will happen when firearm ownership are illegal and are conveniently found in a raid on politically problematic people and decreed that it was being used a weapon. Killing a deserving victim is insatiable feeling that becomes a hobby that will never end.
-
Re:ANOTHER DEAD BODY! SWEET JUSTICE!
The strange concept is that you would bring up gun control when the statistics don't back you up. Over the last decade, the percentage of officers killed on duty, by guns vs other causes, in Britain is slightly HIGHER than it was in the United States. The US is far more violent than Britain, but guns do not contribute to that nearly as much as you would have others believe.
Do you have a source for that? According to the site linked below (which includes citations), "In the US – population 311.5 million – there were an estimated 13,756 murders in 2009, a rate of about 5.0 per 100,000. Of these 9,203 were carried out with a firearm. In the UK – population 56.1 million – there were an estimated 550 murders in 2011-12, a rate of about 1.4 per 100,000. Of these 39 were carried out with a firearm." I couldn't find similar statistics for police officers, but you're obviously pretty sure of your facts so I thought I'd ask. http://fleshisgrass.wordpress.com/2012/07/24/us-and-uk-murder-rate-and-weapon-updated/
-
Re:Almost first post!
Many number theorists believe the problem of discrete logarithms and factoring are somehow linked, and historically advance in one has led to advance in other. However, this particular breakhrough was first published nearly a year ago, and also currently only relevant for small to medium prime fields...
-
Re:The Science is settled!
From the reviewers: "The overall innovation of the manuscript is very low, as the calculations made to compare the three studies are already available within each of the sources, most directly in Otto et al.
The finding of differences between the three “assessments” and within the assessments (AR5), when assuming the energy balance model to be right, and compared to the CMIP5 models are reported as apparent inconsistencies.
The paper does not make any significant attempt at explaining or understanding the differences, it rather puts out a very simplistic negative message giving at least the implicit impression of “errors” being made within and between these assessments, e.g. by emphasising the overlap of authors on two of the three studies.
What a paper with this message should have done instead is recognising and explaining a series of “reasons” and “causes” for the differences." - http://andthentheresphysics.wo...
-
Re:No, not so much
Post office is model of efficiency, and studies show private and charter schools spend more on administrative costs (read:profit for the owners) that public schools. But hey, keep repeating a lie often enough and it's bound to become true sooner or later, right?
Or could it be that good education is really, really expensive, and that $100 million dollars isn't really a lot of money on the scale of a State of American. Could it also be that a lot of that $100 million was spent on trying to make the school district turn out cheap employees for facebook?
The article is very long, but you ought to read it, it very accurately points out that the Newark School District is full of corruption and very pointedly demonstrates that, in this particular case, the charter schools were fiscally more efficient. The district had an administrator for every 6 students and even some clerks had clerks. That is insane.
I'm not weighing in on charter vs. public schools in general, just in this case. It seems that the charter schools actually were getting better results for a lot less money. Students were assessed on Common Core so the measurements of student success was comparable with the district's measurements of the same.
This situation was full of scumbags and scoundrels, but anyone maintaining that Newark School District didn't need some sort of fixing (and still does!) is out of their mind. I am pro union, but that particular teacher's union attacked the state legislature to keep in seniority provisions for layoffs and and job transfers. If I could point to one major reason for failure of the whole project it would have been this single issue. They tried to build the arch anyway, but they didn't have a keystone, the results were predictable.
-
Re:Fuck seaworld
I think it's the water quality. Dog poop and urine don't mix with the air, they don't breathe it in. Marine animals on the other hand, DO breathe their own feces. Which is why it's essential to have a large volume of water per animal, as happens in nature.
First off, Marine MAMMALS don't breath water. They come to the surface to breath.
Secondly, if it was primarily water quality then aquariums that are located next to the ocean and are constantly getting
fresh water from the ocean should see significantly different life expectancies than ones inland which must filter their
own water.I've been thinking of doing an experiment for quite a while. Take two groups of guppies, one in a common aquarium environment, say 10 guppies in a 10 gallon tank (1 inch of fish per gallon). The other group would live in a far less dense tank, maybe 5 guppies in a 200 gallon tank. (5 would be the minimum number since guppies are communal fish and they don't do well mentally unless they're in a group). And compare the fish lifespan in the the 2 groups.
A more accurate experiment would be to have two identical tanks with the exact same number of fish but have one tank have a hidden sump tank.
Here is an example of one: http://splurgebook.files.wordp... It basically allows you to double or triple your volume
of water without changing the size of your display tank. This is what pet stores do and why they can have 100 fish in a 10 gallon tank without them
all dying. -
Re:Not "obsolete"
But if you wanted to set up a new machine to do something like WordStar on DOS that would be quite possible, hence WordStar on DOS is obsolete.
WordStar on DOS may or may not be obsolete, but having a separate machine for it is.
Then again, maybe having to get up and change seats to take a break and go read tvtropes or something is an advantage...
-
Re:Put this in perspective
Aww, Vortex, I friended you a while ago because your posts are generally smart. Too bad this one was an exception.
Anyway, I'm trying to spread some actual data: the NOAA dataset that begins in 1855, when humans had had hardly any impact on atmospheric CO2 levels.
The slope of the line then was 2.77 mm/year, and the slope of the line in 2010 was unchanged, 2.77 mm/year (or 0.9 feet per century). So there's nothing anthropogenic about this.
-
Re:Put this in perspective
I for one am not in favor of subsidized flood insurance. If you want to live near the water, assume the full risk.
But look at the NOAA dataset that begins in 1855, when humans had had hardly any impact on atmospheric CO2 levels.
The slope of the line then was 2.77 mm/year, and the slope of the line in 2010 was unchanged, 2.77 mm/year (or 0.9 feet per century).
Now do you still think NYC will be inundated anytime soon?
-
! half the world's population
Look at the NOAA dataset that begins in 1855, when humans had had hardly any impact on atmospheric CO2 levels.
The slope of the line then was 2.77 mm/year, and the slope of the line in 2010 was unchanged, 2.77 mm/year. I predict the trend will continue: 100 yrs from now it will still be 2.77 mm/yr (or 0.9 feet per century), regardless of CO2 levels. That's not going to cause a significant number of people to move..
-
Cities won't be inundated
Look at the NOAA dataset that begins in 1855, when humans had had hardly any impact on atmospheric CO2 levels.
The slope of the line then was 2.77 mm/year, and the slope of the line in 2010 was unchanged, 2.77 mm/year. I predict the trend will continue: 100 yrs from now it will still be 2.77 mm/yr (or 0.9 feet per century), regardless of CO2 levels. That's not a significant threat to the major cities.
-
Rate of sea level rise
I'm glad you brought up the rate of sea level rise. Here's a NOAA dataset that begins in 1855, when humans had had hardly any impact on atmospheric CO2 levels.
The slope of the line then was 2.77 mm/year, and the slope of the line in 2010 was unchanged, 2.77 mm/year. The only thing that's anthropogenic is the fear mongering.
-
Re:Translation...
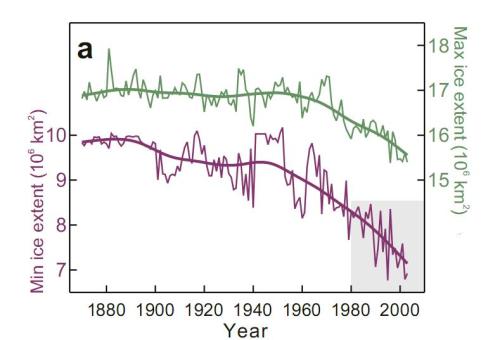
... So, using your own logic here: why is it that when we see comparisons of "warming" and ice starting from 1937, rather than 1979, we see no warming pattern or ice loss? [Jane Q. Public]
Fig. 2(a) from Polyak et al. 2010 shows that the reconstructed Arctic sea ice extent in the 1930s was comparable to that in 1979, and the modern decline is quite clear.
Seriously? You haven't noticed that nearly all the warming "evidence" seems to start around 1979? Have you looked at the actual historical temperature and climate records before then? I have. Be careful when you lecture about "long term trends", lest you end up not looking so smart.
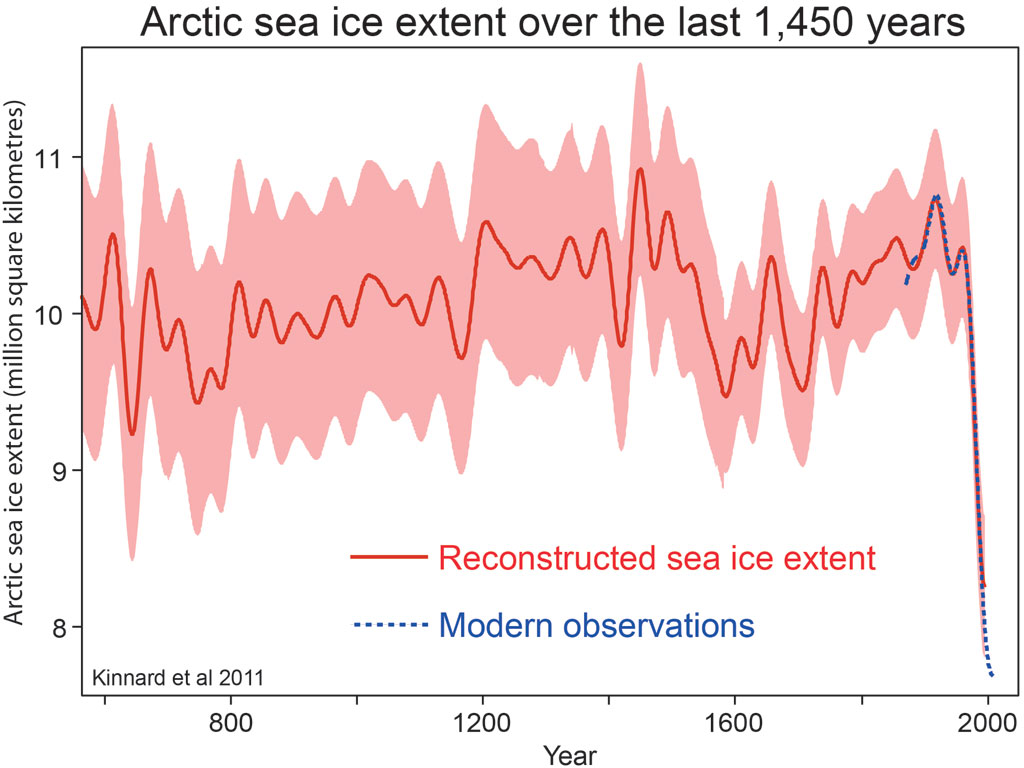
Kinnard et al. 2011 reconstructed Arctic sea ice over the past 1,450 years. Again, the modern decline is quite clear.
-
Re:Translation...
... So, using your own logic here: why is it that when we see comparisons of "warming" and ice starting from 1937, rather than 1979, we see no warming pattern or ice loss? [Jane Q. Public]
Fig. 2(a) from Polyak et al. 2010 shows that the reconstructed Arctic sea ice extent in the 1930s was comparable to that in 1979, and the modern decline is quite clear.
Seriously? You haven't noticed that nearly all the warming "evidence" seems to start around 1979? Have you looked at the actual historical temperature and climate records before then? I have. Be careful when you lecture about "long term trends", lest you end up not looking so smart.
Kinnard et al. 2011 reconstructed Arctic sea ice over the past 1,450 years. Again, the modern decline is quite clear.
-
Re:Translation...
The reason 1979 gets used a lot is because that's when the satellite era of geophysical measurement really got launched. The ground based records goes back to the mid to late 1800's and it's basically been warming since the start (and before) of those ground based temperature records.
My main point is that 17 or even 20 years is not long enough to discern the temperature trend and it can be shown statistically that it is not long enough. At this point it's not possible to say whether the warming trend from 1975 has continued or if the trend has flattened in the past 17 years. Uncertain-T
-
No, not so much
Post office is model of efficiency, and studies show private and charter schools spend more on administrative costs (read:profit for the owners) that public schools. But hey, keep repeating a lie often enough and it's bound to become true sooner or later, right?
Or could it be that good education is really, really expensive, and that $100 million dollars isn't really a lot of money on the scale of a State of American. Could it also be that a lot of that $100 million was spent on trying to make the school district turn out cheap employees for facebook? -
Re:Tonopah Rob is a Real Farmer
Kinda crazy how detached people are from natural systems.
Which seems more sustainable to you?
this?
http://climatevoices.files.wor...or this?
http://www.savannainstitute.or...
http://citygrownurbanagricultu...
http://www.permaculturenews.or... -
Re:Tonopah Rob is a Real Farmer
Kinda crazy how detached people are from natural systems.
Which seems more sustainable to you?
this?
http://climatevoices.files.wor...or this?
http://www.savannainstitute.or...
http://citygrownurbanagricultu...
http://www.permaculturenews.or... -
Re:Club and balls
-
Thorium - a classic acadmic reactor
The Economist had an article about thorium reactors recently too. It was a bit rosier than this one. Anyway, all this press I've seen recent about thorium reactors reminds me of an article Admiral Rickover wrote in 1953 about the difference between academic and practical reactors. It's a good read, and there are definitely parallels here.
-
TDCs
It is called tDCS and it has already formed an amateur community, search in Reddit for example, many have bought their devices and many of them have made them themselves. If you are going to try this, then do your research and try to be safe. There are safety guidelines made by some guy here for example:
http://speakwisdom.wordpress.c...
Also there was a study on rats which found that
http://www.ncbi.nlm.nih.gov/pubmed/19403329
Exceeding recommended current will probably give you skin burns long before you reach anything brain damaging. Don't get me wrong though, I don't recommend you anything and I am not a doctor either. -
Re: Motivated rejection of science
for me the greatest clincher for man-made global warming are these two graphs:
atmospheric CO2 450,000BC to present
atmospheric CO2 1000AD to presentthe first graph shows that the CO2 level has hovered between 200 and 300ppm for 500k years. so our current co2 concentration ~400ppm is unprecedented in the history of mankind! The graph also shows that global temperature is highly correlated with CO2 concentration.
the second graph shows that for most of the past millennium the CO2 level has been hovering at 290 ppm, which is consistent with the past. But in the past 100 years it steadily shot upwards! My conclusion is that this is strong evidence that CO2 increases are due to the large scale burning of fossil fuels that began with the industrial revolution and kept going until today. my further conclusion is that if we reduce our CO2 emissions we can bring the CO2 concentrations back to historical levels.
Here's another interesting graph:
atmospheric carbon dioxide, 500 million years ago to presentThat graph shows that carbon dioxide levels were up to about 7000 ppm about 500 million years ago. Then carbon dioxide levels dropped dramatically to reach a low 300 million years ago. Wonder if there is a scientific explanation for why it went so low 300 million years ago? Then it went back up, and dropped down again to the present day.
Here's the thing: if carbon dioxide levels were over 2000 ppm 175 million years ago, there should be some traces of global warming dooom from back then. Climate Change Doom Warning Experts don't have to make speculative predictions of doom. They can look at what happened the previous times carbon dioxide levels got high, and use that as the base for their doom predictions.
Having lots of carbon dioxide in the atmosphere isn't unprecedented. Probably the same thing will happen again as happened the last times there were high carbon dioxide levels. But what happened last time? That's what some Climate Change Experts should find out, as quickly as they can!
-
Maybe the USA accidentally shot it down?
Did the USA Accidentally Shoot Down MH370 off Diego Garcia? link: http://dissention.wordpress.co...
-
Re: Motivated rejection of science
for me the greatest clincher for man-made global warming are these two graphs:
atmospheric CO2 450,000BC to present
atmospheric CO2 1000AD to present
the first graph shows that the CO2 level has hovered between 200 and 300ppm for 500k years. so our current co2 concentration ~400ppm is unprecedented in the history of mankind! The graph also shows that global temperature is highly correlated with CO2 concentration.
the second graph shows that for most of the past millennium the CO2 level has been hovering at 290 ppm, which is consistent with the past. But in the past 100 years it steadily shot upwards! My conclusion is that this is strong evidence that CO2 increases are due to the large scale burning of fossil fuels that began with the industrial revolution and kept going until today. my further conclusion is that if we reduce our CO2 emissions we can bring the CO2 concentrations back to historical levels.
this is my conclusion; you may look at the same evidence and come to the same conclusion. But the important thing is to teach our children the critical thinking skills to evaluate this data. If you white wash science classes then you lose the chance to develop these skills. -
Re:How is Burying Africa Under PCs Going to Help?
That's because of the news cycle, or your news sources. "If it bleeds, it leads". Your emphasis on "machete attacks" shows you should read the Economist instead of whatever you're getting your news from. Here's an article with some simple graphs and pictures about what's going on in Africa internet today. http://o3bnetworks.wordpress.c...
-
Re:Hurray for Japan
According to Freakonomics, the low reported murder rate in Japan is due to perverse incentives. As in, police won't open a murder investigation unless they already have a suspect and think they can get a conviction. This allows the police to keep their nigh-perfect score, which apparently causes the community to trust them. As a bonus, their reported murder rates are incredibly low, which makes the society feel better about itself. Instead, people die of implausible "natural causes" all the time, and criminals get away with murder.
Here's one example, but you can trivially find many more.
-
Re:DMCA says this isn't so!
-
Re:Russia you were so close
No, they just pass the information to the police that handles that job.
Look at what happened to all the Occupy members. Funny how all the important people in the movement were found very accurately by police forces across the country.
Found, and crucified:
Occupy Wall Street on Trial: Cecily McMillan Convicted of Assaulting Cop, Faces Up to Seven Years
Why Did FBI Monitor Occupy Houston, and Then Hide Sniper Plot Against Protest Leaders?Like this dick authoritarian move by Russia, China et al. actions speak louder than words: The United States is not alone in being afraid of democracy... real democracy. Which starts with the more outspoken amongst us rallying together, writing blogs about the social problems we face, proposing solutions, attending OWS type events to agitate peacefully for positive change. Just too bad all those things that make common peoples lives better also happen to conflict with the goal of accumulating even more wealth for the richer parts of society. See graph: 12-country 1975-2007 chart of share of income growth going to The 1%.
-
Re:sigh
Great USA data. Too bad we're talking about global climate disruption. Check out 2013, and see that the USA's mild year was a global anomoly:
-
Re:sigh
Anything that advances the anthropogenic global warming agenda is climate. Anything that doesn't is weather. Keep up!
According to the government's own figures, 78% of the United States has been experiencing the coldest year (i.e., 2014 so far) since 1937. About the only exception has been the SW like the LA region right now. Great Lakes have record ice for this time of year. Arctic is at normal sea ice levels and Antarctic levels are above normal. Which wouldn't be worth mentioning if it hadn't been a strong trend for well over a year. But what's really educational is to look at the actual record of past years, rather than just taking other peoples' word for it.
This guy is a very good source of historical comparisons to todays weather AND climate.
When you know a little actual history of our climate, you look at these "warming" scares and go "Pffffft. Baloney."
He posts some really great, actual historical stuff like THIS and THIS and THIS.
Alarmists can say what they want about skeptics, but the historical record is the historical record.
Good luck trying to rebut the actual thermometers in, say, 1940 for example. They said what they said.
So the first link is the infamous trick of showing no warming by starting with 1998, the hottest year ever. Doing so obscures the fact that we've spent the last 15 years almost matching the hottest year ever!
The second link is an unsourced graph of percentage of weather stations experiencing 100F days. The implied interpretation is that 100F days are less frequent. The unaddressed question is how has the composition of weather stations changed in the last 100 years, are there more outside of urban centres, more in Alaska?
The third is a plot of global sea ice area, this sounds like a rebuttal of the scientists talking about the loss of sea ice, an attentive person might remember scientists are usually talking about multiyear sea ice at the north pole...
The final one reprises the short lived scientific discussion, and massive media hyping, of global cooling from the 1970s. Of note is the fact that global cooling was never the scientific consensus but was merely the hypothesis of a handful of scientists before the field worked out how anthropogenic factors would balance out. It only became a big thing because the media was playing its same game of finding a paper or two and declaring it to be the latest truth from science.
I do agree with Mr. Goddard we can learn something from the global cooling debacle. The obvious lesson is ignore the media, listen to the scientific consensus and take global warming seriously!
-
Re:sigh
Fascinating. While I can't comment on all of these points, I did a bit of searching regarding the second LINK about global sea ice: That graph shows the global sea ice area, not the volume. The area slightly increased while the volume has steadily gone down over the same period of time.
This is what makes it impossible for the armchair scientist to understand this. Inevitably, someone will reply telling me why my link is a bunch of dumbutts and how that graph is irrelevant, we should be looking at something else.
-
Re:sigh
And by the way, before people chime in with ad-hominems and other such blather, they might want to read this first:
Why I Do This, by Steve Goddard. -
Re:sigh
Anything that advances the anthropogenic global warming agenda is climate. Anything that doesn't is weather. Keep up!
According to the government's own figures, 78% of the United States has been experiencing the coldest year (i.e., 2014 so far) since 1937. About the only exception has been the SW like the LA region right now. Great Lakes have record ice for this time of year. Arctic is at normal sea ice levels and Antarctic levels are above normal. Which wouldn't be worth mentioning if it hadn't been a strong trend for well over a year. But what's really educational is to look at the actual record of past years, rather than just taking other peoples' word for it.
This guy is a very good source of historical comparisons to todays weather AND climate.
When you know a little actual history of our climate, you look at these "warming" scares and go "Pffffft. Baloney."
He posts some really great, actual historical stuff like THIS and THIS and THIS.
Alarmists can say what they want about skeptics, but the historical record is the historical record.
Good luck trying to rebut the actual thermometers in, say, 1940 for example. They said what they said. -
Re:sigh
Anything that advances the anthropogenic global warming agenda is climate. Anything that doesn't is weather. Keep up!
According to the government's own figures, 78% of the United States has been experiencing the coldest year (i.e., 2014 so far) since 1937. About the only exception has been the SW like the LA region right now. Great Lakes have record ice for this time of year. Arctic is at normal sea ice levels and Antarctic levels are above normal. Which wouldn't be worth mentioning if it hadn't been a strong trend for well over a year. But what's really educational is to look at the actual record of past years, rather than just taking other peoples' word for it.
This guy is a very good source of historical comparisons to todays weather AND climate.
When you know a little actual history of our climate, you look at these "warming" scares and go "Pffffft. Baloney."
He posts some really great, actual historical stuff like THIS and THIS and THIS.
Alarmists can say what they want about skeptics, but the historical record is the historical record.
Good luck trying to rebut the actual thermometers in, say, 1940 for example. They said what they said.