 Slashdot Mirror
Domain: cbo.gov
Stories and comments across the archive that link to cbo.gov.
Comments · 372
-
Re:This is supposed to be the *WAY* they do their
http://www.cbo.gov/sites/defau...
"CBO and JCT project that 12 million more
nonelderly people will have health insurance in 2014
than would have had it in the absence of the ACA. They
also project that 19 million more people will be insured
in 2015, 25 million more will be insured in 2016, and
26 million more will be insured each year from 2017
through 2024 than would have been the case without the
ACA.""Relative to their previous projections, CBO and JCT now
estimate that the ACA’s coverage provisions will result in
lower net costs to the federal government: The agencies
now project a net cost of $36 billion for 2014, $5 billion
less than the previous projection for the year; and
$1,383 billion for the 2015–2024 period, $104 billion
less than the previous projection.
[...]
Those estimates address only the insurance coverage pro-
visions of the ACA, which do not generate all of the act’s
budgetary effects. Many other provisions, on net, are
expected to reduce budget deficits. Considering all of
the provisions—including the coverage provisions—
CBO and JCT estimated in July 2012 (their most recent
comprehensive estimate) that the ACA’s overall effect
would be to reduce federal deficits."Forbes? Really? REALLY?
sPh
-
Re: I never thought I'd say this...
people that otherwise couldn't afford it
Because for a person born and raised in America to be unable to afford Internet service (as well as a phone, vehicle, decent shelter, and food) is a shame. Millions of immigrants here — legal and even illegal ones — manage to not only do well for themselves, they are also able to support extended families back home. That's despite the culture shock, not knowing the predominant language very well, and — in many cases — dubious legal status.
But if you feel like continuing the failed "War on Poverty" for another fifty years — go ahead. Just don't force me at gunpoint (via the IRS, that is) to join you.
-
Re:I like...
AS for the calculation, you are not taking into account benefits such as SSI, Food Stamps, etc, that the poor receive as part of the redistribution of taxes
I'm not sure it's really appropriate to refer to everyone in the bottom 50% as "the poor", that seems overly broad, but the rest of your point has some merit.
Government transfers are a bit tricky since they're given for a variety of different reasons, but lets assume the case most favorable for your argument, that they should all be figured in. Using the CBO data http://www.cbo.gov/sites/defau..., which is a bit harder since it's in quintiles, I integrated that into the equation. (This was quick math with approximate data but it should be close enough for this discussion) Given that scenario their profit is $39,362.20 and an appropriate tax burden would be 2.3% So even in the case where every government transfer should be taxable (which I don't think is true) their appropriate tax burden is still lower than what they're currently paying.
Obviously before any real changes were made a much more detailed and accurate study would need to be made, but I stand by my original assertion that the bottom 50% don't pay an unfairly low rate of taxation. Oh, and before you start drawing all sorts of unwarranted assumptions about my politics I should mention I'm registered as a Libertarian. -
Re:Equality of OPPORTUNITY or RESULTS?
A bump living in the tunnels of a New York metro
A "bump" born and raised in America — the land of milk and honey, where millions of immigrants (legal and otherwise) not only do well despite the culture-shock and the disadvantages of having to learn a new language, but also manage to support their extended families back home — such a bump has no one but himself to blame for lacking anything he wants, but can not afford.
-
Re:Silicon Valley is officially old
Nice narrative, too bad it's not based on facts. You don't need to Google far to see those "who don't support this country" and who's "refusing to live up to basic responsibility of living in this country".
http://globaleconomicanalysis....
The bottom 20% had average income of $8,100 but received $22,700 in annual assistance, netting $30,800 in after-tax income.
The second quintile had average income of $30,700 but received $15,200 in annual assistance, netting $43,400 in after-tax income.
The middle quintile had average income of $54,800 and received $8,100 in annual assistance.
The second-highest quintile ($87,700 income) paid $8,800 more in taxes each than they got back.
The highest quintile ($234,400 income) paid $52,500 more in taxes each year than they got back. -
Re:In a century...
For your information, "Clinton's surplus" was because of Republican Congress that didn't let him spend much money. It also was only possible because of the DotCom Bubble of the 1990s. Once that burst during Clinton's final year in office, the surplus vanished.
Now if your post had contained actual information, instead of made-up stuff.
CBO analysis shows that despite all the economic events that transpired after Bush's election, the U.S. Federal Budget would have remained in surplus (more than a trillion dollars) right up until the time of the Bush economic meltdown that began in 2007.
Legislative changes - the bills the Republicans passed and Bush signed - spent the entire surplus, and trillions more.
-
Re:oh, sorry
The latest CBO report shows that the law is on track to reduce the total number of uninsured people by 12 million this year. Page 8 of the PDF.
I don't see the mention of 12 billion at all on that page or the ones next to it.
Of course you mean 12 million, not 12 billion.
The reason you can't find the number is because you are (quite correctly) looking at the page labeled as number 8. Unfortunately the PDF was not formatted correctly and the numbering is not restarting after the four-page preamble. Because of that, @artor3's PDF reader is incorrectly telling him that the page he is looking at is number 8, while you will find it's labeled as number 4.
So, go to page 4, Table 2, and look at the column for 2014. The Item (Change in Insurance Coverage Under the ACA) for Uninsured shows an increase of -12 (millions).
-
Re:oh, sorry
The latest CBO report shows that the law is on track to reduce the total number of uninsured people by 12 million this year. Page 8 of the PDF.
And if you check page 14, you'll see that that estimate was based on just enrolling 6 million people in the exchanges this year. The actual number is 8 million.
But keep lying. Maybe if you repeat it enough, it'll turn true!
I think the remaining reductions are taken care of by the death panels, and the people dying from poor healthcare...
-
Re:oh, sorry
The latest CBO report shows that the law is on track to reduce the total number of uninsured people by 12 million this year. Page 8 of the PDF.
And if you check page 14, you'll see that that estimate was based on just enrolling 6 million people in the exchanges this year. The actual number is 8 million.
But keep lying. Maybe if you repeat it enough, it'll turn true!
-
Re:If you didn't built it it should be taxed
The estate tax is a tax on the estate, not on income. It's taxed at a higher rate than any income.
Factoring in the $5M exemption, the effective rate is usually far lower than it would be if it were treated as income. Taking your own examplte of a $10M estate, you're looking at $2M in taxes which is a 20% effective rate. That same $10M at ordinary income rates would mostly be taxed at the top marginal rate which is far higher. I'm all for complaining about the estate tax being potentially thorny for cashflow/business reasons, but let's not pretend that it's not a much nicer allternative to ordinary income taxes in most situtations.
This problem was more severe when you have lots of family run farms, where a large portion of the estate was in the value of the land, but exists today with many small businesses.
Has anybody really looked at the data on this? Becuase the best reference I can see on it indicates that it's problematic, but not exactly a major issue. It's the type of thing that should be pretty easily resolvable in other ways (long term payment plans, etc.) that don't involve eliminating the estate tax.
-
Re:This is how the media controls you
"Why look at trillion dollar deficits that are destroying the economy"
That is truly begging the question. Assumes facts not in evidence. Actually, assumes facts that are contrary to a lot of evidence:
- FY2014 deficit will be $300-500bn, and forecasted to be in the higher end of that range for the next 4 years.
- That's 3% of GDP and falling.
- Evidence shows that advanced nations are in a macro-economic liquidity trap.
- Evidence shows that governmental deficit spending in a liquidity trap has a positive multiplier to GDP.
- Evidence shows that "Expansionary austerity" is not a thing, in that austere economic policies have not caused economic expansion in the countries that have tried them. Even former cheerleaders of austerity have admitted those policies have not worked.
---
Sources:
http://www.cbo.gov/sites/default/files/cbofiles/attachments/44715-OptionsForReducingDeficit-2_1.pdf
http://useconomy.about.com/od/fiscalpolicy/tp/US_Federal_Budget.htm) -
Re:Collusion, in tech?
I am not sure if I am selling anything. Well, maybe tax reform to simplify the code and improving our school system, in particular at the primary level. And then there is this, the upper end if sprinting a lot faster than the middle or lower quintiles.
http://www.cbo.gov/publication/42729
So let me ask you a question - why did you pick that a person should have stocks equal to his income? Could some of difference be that you are looking at the individual level (what 1 person should do) while I am looking more at the macro level – what people can do on a aggregated level.
Thought experiment. A company has a market cap of 20m, outstanding debts of 80k. The company then issues 10m in bonds for a stock buyback. Now they have a market cap of 10m with outstanding debts of 90k. Did the worth of the company drop in ½? I would say no. (Or they could go the other way and issue equity to pay off the debt.)Both the equity and bond holders have economic claims to the company’s profits. Different claims but they are both on the capital side of the equation. The mistake that you are making is that you are counting the debt as a liability – but it is an asset for whoever holds the bond. From your perspective does it matter if the capital is held in equity or bonds? You could hold junk bonds that have the same expected return as stocks. And where would you put preferred shares? For this purpose I don’t care – it is all capital.
Looking back we have had 3% growth and we (at the national level) had capital about 4 times our income. Historically, when growth was at 2%, the value of capital was about 8 times that of income. This makes sense. As the spread between required return and growth get narrower the value of future income streams increases. BTW, this is why I chose 8 times. To point is if growth drops to 2% the returns on all investments (both stocks and bonds) as a whole drop by ½. As an individual you can boost your returns and risk by overweighting stocks. A company can lever up by issuing more debt. But society as a whole can’t do that.
Now, back to acquiring said capital. Assume you invest X dollars a year at Y rate for 20 years. Run the numbers. At some point compound interest is going to kick in at your portfolio is going to really take off. Now, slash your rate or return by ½. Your growth is going to look a lot bleaker.
On the ownership society - It is something which I fully back. But if growth slows it will be harder for the average person to achieve it. In the past, lower GNP growth meant more concentration of the wealth at the top. That is my concern.
-
Re: Don't imagine it stops there.
http://www.cbo.gov/publication/42729
Bottom 20% up by 18% from 1979. Another era of high unemployment.
As for doctors, today we call them registered nurses. Maybe Pas. But they did not have computers. Car, telephone, air-conditioning, home, and T.V. ownerships rates have risen.As for you moral position that the current generation is debase and materialistic – well – that is your opinion of what is valuable. Society as a whole disagrees with you. While I might agree with you (and I kind of do) it is kind of arrogant to say that the progress that has been made does not count because you don’t value it.
-
Re:Feminization of childhood
My source for that number was the Bureau of Labor Statistics report I linked in my post above (located with a quick web search). They lump "Education, training, and library occupations" together in the 39.2% union represented number; I'd have to look elsewhere to see exactly what portion of that is specifically government-run public schools (though that's the biggest portion of the "education" market to start with). No "janitorial/maintenance" is not lumped in --- they're a separate line ("Building and grounds cleaning and maintenance") with only 11.4% representation.
Searching around, I found what appears to be a more comprehensive state-by-state report on teacher's unions at
http://www.edexcellencemedia.net/publications/2012/20121029-How-Strong-Are-US-Teacher-Unions/20121029-Union-Strength-Full-Report.pdf
If you want to nearly entirely avoid unions, go to Florida, North or South Carolina, Mississippi, or Arkansas.Given your (oft well founded) distrust of government, why do you think government employees shouldn't be allowed to band together to make sure they don't get screwed over by their management? You do realize that union donations are, in the grand scheme of things, pretty small --- politicians are "hearing" a lot more loudly from anti-union and pro-privatization advocates. Here's the page I found on OpenSecrets.org listing public sector union donations: https://www.opensecrets.org/industries../indus.php?ind=P04 . On the total list of "special interest" groups, they're 15th down the list (https://www.opensecrets.org/industries../mems.php) --- not completely insignificant, but outspent 2:1 by, e.g., "securities/investment" who would love privatization and wage-slashing action. And even that's a drop in the bucket (not "boatloads") compared to total private-sector lobbyist spending. Overall, union funds for campaigning are only a tiny fraction of their worker's paychecks --- and working-class folks only take home a fraction of the money going to anti-union oligarchs (who have a lot more disposable income for corrupting government officials to their will).
For a test of public sector union "corruption" based on data rather than hand-waving, one might ask whether public sector (union) employees actually earn ridiculously more than their private sector counterparts. If they don't, then "eeeevil unions" apparently aren't doing much harm (and, if they do, it may be that private sector employees are getting shafted...). Here's a CBO report I found on the topic: https://www.cbo.gov/publication/42921 --- I see slightly higher wages+benefits for similar educational levels (below doctorate level), but not exactly signs of massive evil fraud --- to reasonable approximation, you're earning about the same amount either way.
-
Re:Here is a thought..
So, you think your projections are better, or more informed?
khallow did not, actually, make any projections. You quoted the CBO's — to support your argument:
BTW, the CBO projects the deficit out 25 years, and they don't see the problem you see with obamacare.
khallow explained, rather convincingly, how unreliable the CBO's projections are (and your argument along with them).
His job was much easier, of course — he did not need to prove anything himself, merely destroy your proof. Well, he did it — the CBO not only failed to predict the 2008 crash, but, according to the figures khallow quoted, the subsequent "recovery" as well. The CBO's numbers are so far off, year after year, it is laughable.
I simply pointed out that the CBO did not agree with him, which is true, they don't. Whether you agree with them or not, their charter is to provide unbiased economic guidance to congress. If they missed the 2008 meltdown, well, so did everybody else. If they expected the recovery to be more robust, well, so did everybody else. Nobody expected the republicans to block any attempt to stimulate the economy, and in fact to push for austerity (in the form of the Ryan budget) once they took the House. That would have been too mean spirited even for them, given the unemployment numbers.
khallow's claims that the world is going to end because of the ACA are nonsense. His claims that rebates will cause funding problems for 'roads, defense, entitlements' is nonsense. His claims that medicare patients will face death panels are nonsense. Look at debt/GDP and learn to add for fuck sake. We have plenty of money, and bonds that are the most secure in the world, that people are still buying despite real negative returns wrt inflation. The pressures that ACA puts into effect are the same as in Germany, who has had a public health system since the time of Otto Von Bismark. Their economy seems to be doing OK. Also, they have much better health outcomes, and pay far less per person than we do.
BTW, here is a fun blog entry on the republican war against the CBO. Apparently, some Republicans (cough Newt, Ryan) don't like to be told that they are too stupid to claim 'wonk' status.
-
Re:Here is a thought..
So, you think your projections are better, or more informed?
khallow did not, actually, make any projections. You quoted the CBO's — to support your argument:
BTW, the CBO projects the deficit out 25 years, and they don't see the problem you see with obamacare.
khallow explained, rather convincingly, how unreliable the CBO's projections are (and your argument along with them).
His job was much easier, of course — he did not need to prove anything himself, merely destroy your proof. Well, he did it — the CBO not only failed to predict the 2008 crash, but, according to the figures khallow quoted, the subsequent "recovery" as well. The CBO's numbers are so far off, year after year, it is laughable.
-
increased by $200 billion = down by half? 40% incr
2008 deficit: $458 billion
2013 deficit: $680 billion
2014 deficit: $744 billion> Maybe you should make it a personal mission to learn about this stuff instead of just repeat dumbass headlines?
Perhaps you should. Rather than venturing to comedycentral.com on that mission, may I suggest you start with http://www.treasury.gov/ and http://www.cbo.gov/
-
Re:Here is a thought..
That isn't true. They are independent. Who would pay attention to them if they were not independent?
You just did.
I'll just add that CBO deficit projections are one of the areas that they are particularly notorious for getting wrong (2009 CBO economy and deficit projections). For example, in that link they forecast 4% real GDP growth rate for 2011-2014. So far it's been about 2.5% through to this fall. They understated unemployment (6.4% through the same 2011-2014 period, actual average unemployment appears to be a bit under 8% so far, but probably will remain above 7% average when 2014 ends IMHO).
But it's their deficit projections which are off the most. Here's the figures from that report of 2009:
CBO projected deficits in billions of US dollars:
2010 -703
2011 -498
2012 -264
2013 -257
Actual deficits in billions of US dollars:
2010 -1294
2011 -1300
2012 -1087
2013 ~-680 (picked up from news sources)
Notice the problem? How far off these CBO projections are (over 800 billion over for 2010 and 2011!)? I picked this particular report because it was the most important CBO report of the past few years since it was used to justify 2009 stimulus spending and as justification for increase other sorts of spending in 2009 and early 2010.
Now you might think it just a coincidence that the CBO greatly exaggerated the fiscal health of the US budget at a time when it was highly advantageous to Congress to have such an exaggeration. I don't. I think this sort of deceptive propaganda is part of the CBO's reason for being. -
Re:Here is a thought..
When these subsidies grow big enough to threaten funding for basic services like road systems, national defense, and the other entitlements that the US has, then something will be done. Inflation isn't going to work because the costs will outpace inflation no matter how much you inflate. But dumping people on Medicare/Medicaid (which I think will turn into another fine disaster as it caps prices of health care given under the Medi* system, but not the cost of health care) or restricting their access to medical care (say via the "death panels") would.
When did we start caring about road systems and national defense? I thought the fact that the sequester happened meant we'd already given up on those goals?
Also, the real fear of conservatives is the medicaid system, that gives healthcare to the poor. That is why many states have opted out of the medicaid expansion, despite the fact that a) they are paying for it now in the form of emergency room costs, and b) that it would help their economies. The problem for governors of these states is that their population would freak out and elect sombody else if it was known that they helped 'those people' in any way. And, they would be right. They know their states, and do polling on these issues.
BTW, the CBO projects the deficit out 25 years, and they don't see the problem you see with obamacare.
-
Re:Really?
How much does ObamaCare cost the economy?
As long as you are going to ask that, why don't you ask how much it would cost the economy to:
1. Allow health care costs to continue their current trend without the ACA of spiraling up? As of 2003 the insured saw on average $1000 per year per person being spent on administrative costs. - Woolhandler, et al
2. Lock entrepreneurs with chronic illness into corporate jobs so that they can qualify for health care, instead of striking out with their ideas and boosting our economy?
3. Allow citizens with health problems get so disabled due to lack of care that they slip from the roles of employed, productive, tax paying contributors to society, and go on unemployment and disability and end up TAKING money from government services? (my father was a type 1 diabetic, who got laid off in the 90's from his job, couldn't find work, couldn't qualify for insurance, could barely afford the hundreds of dollars a month on insulin and test strips and died of diabetic complications within a couple of years.)
4. Allow citizens who are foolhardy enough not to buy health insurance delay their medical care until they get bad enough to go to an emergency room where the most expensive care available is given to them for free, and then charged back to us through increasing healthcare costs (see item 1).
5. Allow citizens who are foolhardy enough not to buy health insurance delay their medical care until they get bad enough to go to an emergency room walk around with their infectious diseases, spreading them to others who will then lose work days and to sickness or caring for their sick children.
The non-partisan organization that both Republicans and Democrats depend on for accurate estimates of such matters, the CBO (alternately vilified, and lauded by partisan in congress and the media depending on whether or not the CBO's non-partisan findings support their bias) took all of this into account AND more, and this is what they came up with in reports to both Speaker Pelosi and Speaker Boehner:
To Boehner, evaluating the projected cost to the economy of the first attempt to repeal the law:
-
Re:Thank goodnessNice rebuttal. Here's the CBO document on VA costs. The relevant part is on page 10:
Annual resources averaged about $5,600 (in 2010 dollars) per enrollee for 2009 - an inflation-adjusted increase of 9 percent from the previous year's total of $5,100
$5,600 per. person. If we compare that the private insurance, it's ohhh, look at that, about the same. Except of course you also have to include the deductibles, and it doesn't account for stuff which is covered by VA but isn't covered by the cheaper plans which drag the average down.
The VA looks like a damn good deal to me. -
Re:Race to the Bottom
That's pretty astonishing when you consider people like mitt romney pay roughly 14% (all taxes... federal, state, local, and social security).
Also
http://www.cbo.gov/publication/43373
Perhaps you are confusing your top marginal rate with the actual tax rate you pay?
I made six figures in 2013 and only paid about 30% including social security.
---
A lot of our current deficit problems would be essentially solved* if we simply rolled back the bush tax cuts.
* (we'd still have deficits but total debt growth would be smaller than gdp growth so the effective size of the debt would shrink over time).
-
Re:It's a great idea if you ignore...
Sorry about your reading difficulties. If you can maintain attention, perhaps I can clarify.
The point was that large public construction projects happen in expansionary periods when empires is growing, resources are plentiful and economies are relatively free of both public and private debt as a proportion of actual GDP.
Any evidence to support his assertion?
The enormous 1930s Public Works Administration program was undertaken when the U.S. public debt/GDP ratio was at a (then) all time high.
The interstate highway system, that largest public works project in US history, was authorized in 1956 when the public debt/GDP ratio was 60%, just a bit lower than the 75% that will prevail over the next decade.
Large scale public construction project undertaken during a depressed economy, like now, lead to accelerated growth, and then sharply dropping debt ratios.
But your claim sounded plausible anyway. Truthiness is alive and well.
-
Re:This is TRAGIC but..
Given that most anti-gummint types declare themselves pro-business, it's amazing how few seem to comprehend the difference between deficits and debt. It's really not that difficult: you run a surplus if your annual income exceeds your annual expenditure; if it's the other way round, you have a deficit. If a country were a government, this would be profit (or loss). It is possible to be a profitable country and still owe money to others, just as it's possible to be a profitable company and owe money to a bank, or be a solvent individual and owe money to the bank in the form of a mortgage. You can argue about how much debt a country ought to hold, but conflating deficit and debt is just
CBO figures show quite clearly that the Clinton administration ran a surplus in its final three years (and also in 2001 due to momentum):
http://www.cbo.gov/sites/default/files/cbofiles/attachments/43904-Historical%20Budget%20Data-2.xls
They also give the lie to your assertion that the national debt went up every year he was in office. In fact, debt fell in 1998, 1999, 2000 and 2001. By 2001, it was down to 3.3tn, having peaked at 3.8tn in 1997. That was a fall from 48.4% of GDP in 1996 to 32.5% of GDP in 2001 -- 16% points in 5 years. I wish I was paying my mortgage off that quickly.Then Bush came along and fucked it all up. Royally:
http://www.washingtonpost.com/blogs/wonkblog/wp/2012/09/05/the-three-best-charts-on-how-clintons-surpluses-became-bush-and-obamas-deficits/Honestly, I see no point in your deluding yourself about economic history. Get over the cognitive dissonance and learn to accept the world as it is, not as you would like it to be.
-
Re:Funding isn't automatic now
Indeed. But, then again a Senate budget has no teeth to it; only house budgets do. The senate did try to pass a bill to stop the sequester, since bills actually have teeth in them, which was (surprise! surprise!) filibustered.
-
Re:Total BS
According to the CBO, the cuts will have no signifigant effect on the economy. But the Rise is Social security taxes deffinately will. They also say that:
"We project that debt held by the public will reach 76 percent of GDP this year, the largest percentage since 1950. And, under current laws, we project that debt in 2023 will be 77 percent of GDP—far higher than the 39 percent average seen over the past 40 years—and will be on an upward path.First, high debt means that the crowding out of capital investment will be greater, that lawmakers will have less flexibility to use tax and spending policies to respond to unexpected challenges (like a recession or war), and that there will be a heightened risk of a fiscal crisis in which the government would be unable to borrow at affordable interest rates. "
http://www.cbo.gov/publication/43943etc... etc...
We HAVE to cut spending. Period. If the only way to do it is to let this sequestration process proceed, then fine. -
Re:I say cut the F-35
For 50 years, far more has been collected than was needed to pay current obligations.
The catch is that "current obligations" is simply what's paid out today, not money needed to pay those who paid into it. The money you pay into Social Security isn't put into some savings account where it grows with interest waiting for you to retire. It's paid out almost immediately to current retirees (solvency varies from 1 year to about 15 years depending on program changes). That's why the baby boomers retiring is such a shock to the system - it drastically altered the ratio of SS payers to payees. If it had been structured like a real pension, the baby boomers would just be getting back money they paid in and there would be no shock to the system from the payer/payee ratio changing. But that's not how it works.
Medicare works the same way - current workers paying current retirees. This is why it's very dangerous to think of these programs as getting back money you paid in, or as "solvent and paid for" just because they've been running in the black on the accounting books thus far . They're not run like a regular retirement or pension fund. To compare their health like you would a pension fund, you have to project out about 30-40 years ahead to take into account the current batch of payers turning into payees. And the CBO has been warning for over a decade that these (primarily Medicare) are the biggest threats to the budget when you project out that far.
While I'm sure there's lots of waste in Defense spending which could be cut, it is not growing. It's more or less been holding steady. Even with the uptick from the two wars in Iraq and Afghanistan, Defense spending is still below 1980s levels. The bottom line is that you cannot balance a budget by cutting things which aren't growing, and ignoring the things which are growing. Eventually you're going to run out of things to cut, while the things you're ignoring will continue to grow (which btw is projected to happen around 2070, when SS + Medicare/Medicaid spending are projected to exceed all tax receipts). You have to look at the costs that are growing and do something to get their growth under control. The longer you wait, the harder it will be to implement those cost controls. -
How were all these things paid for?
Just a few years ago, the budget was 2/3 of what it is now, so how were food inspections paid for then?
Most people don't realize that this big deficit spending problem started when the $787B "one time stimulus" became part of the baseline budget and was re-spent (and then some) year after year after year on the biggest government expansion ever seen on this Earth. That $787B is STILL being spent over and over again.
Bond Bubble Ben is still printing Bernanke Bucks at a rate of about $1T/year as well, because the FED is the only entity willing to buy new US debt anymore.
When are Americans going to wake up and realize that you can't spend money you don't have on things you neither want nor need and expect to come out ahead at the end of the day?
I guess "as long as I'm getting mine" is the new American Dream.
Here are some gross, as in disgusting, numbers for US Government Spending:
2006: 2655.1B
2007: 2728.7B
2008: 2982.5B
2009: 3517.7B
2010: 3456.2B
2011: 3598.1B2001: 1862.8B
If you take the 2001 spending figure and adjust it for inflation, it is 2411B, so in 2011 dollars we're spending 1186B more than we were in 2001.
1.2T in government growth, people. That's 49%. And that's just government growth at the federal level. Government is taking fully 50% more money from us (and our kids, and their kids, and probably also their kids after that) than they were 10 years ago.
Sources:
http://www.cbo.gov/sites/default/files/cbofiles/attachments/HistoricalBudgetData.xls
-
Re:120 Million is Pittance
To follow up with some facts:
The article claims 120 million between 2002 and 2010 was funneled toward climate denial. During that time the US Federal Government spent around 2 billion a year on climate science.
That is, the Federal Governemnt was spending about 130 times as much money on research alone, than these groups.
-
Re:Don't follow the Canadian example
We're only 'underfunded' and 'unsupported' in the viewpoint of a country that needs a huge army to bully every one with.
Don't worry, the Soviet Army is gone now. Thankfully NATO was able to outlast the whole rotten system of militant, milatarized, oppressive Soviet Communism.
And what a nasty giant they were back in the day too.
Soviet ground forces are composed of more than two hundred divisions, all mechanized, and organized under army, front and high commands in at least five theaters of military operations. They possess more than 53,000 main battle tanks, 48,000 tubes of artillery, mortars and multiple-rocket launchers, 4,600 surface-to-air missiles and 4,500 helicopters.
The air forces include more than 4,900 tactical aircraft. Air defense forces have an additional 1,760 interceptor aircraft, 9,000 surface-to-air missile launchers, and 10,000 warning systems including satellites, radars and air surveillance systems. Under the terms of the Anti-Ballistic Missile Treaty, the worldâ(TM)s only ABM system has been deployed around Moscow.
The Soviet navy has 360 attack and cruise missile submarines, 274 principal surface combatants, and its own air arm of 390 bombers and 195 fighter aircraft.
After the Soviet Union fell, the US was able to cut its defense spending, which had been falling over time anyway. Even with the cuts, the US was subsidizing Western Europe's defense.
NATO BURDENSHARING AFTER ENLARGEMENT
Or were you thinking of someone else? If so, could you be more specific? It is a little hard to reconcile international relations with playground rhetoric. It is made even more difficult by the tendency of some people to forget who their friends are.
-
Re:Tax avoidance
What you miss is that the quintile is not at 20, 40, 60%... They are at more like 25%, 75%, 90%, 95%. The quintile used divides by slice of pie...
What you seem to miss is that the data I am using, from the congressional budget office, actually states how many households are in each quintile. You miss this so trivial of a thing because you never bothered to care about the facts.
Lowest quintile - 22.7 million households
Second quintile - 23.6 million households
Middle quintile - 23.7 million households
Fourth quintile - 23.3 million households
Highest quintile - 23.6 million households
What I see here is that the defense of the original theory, that "the rich dont pay their fair share" gets more and more convoluted as I repeatedly wreck a succession of justifications for the theory with actual data.
you have two choices..
1) think of something even more convoluted to try to justify a theory that cant be backed up with data, or
2) look at the actual data, from the source, and realize that you are wrong
Clearly you need to be told where the data is, because you never once cared about the actual data. Hopefully now you WILL start giving a shit about having theories that you cannot back up... you really should be embarrassed. Really. -
Re:Profit
Its broken up by quintiles, so already does factor in concentration of income. The top 20% of the people are paying 67.9% of the taxes, the bottom 20% of the people are paying 0.3% of the taxes.
No, those quintiles are even divisions by the number of people, not by income - the same number of people are in the top 20% as are in the bottom 20% regardless of their actual income levels.
In fact, those same CBO numbers show that the top 20% saw a 10% increase in after tax income, while all other quintiles saw a decline of 2-3% over the period of 1979-2007.
That report also states that the equalizing effect of wealth transfer is less in 2007 than 1997 - a direct contradiction of your permise that taxation has become more progressive over that time period.
-
Re:Profit
Tax rates are a record low in the past two decades, and Obama has so far done little to change that.
I don't have figures in front of me for exactly the last 2 decades.. the numbers I have right now are for 1979 to 2009 (XLS spreadsheet), so I am using 1979 to 2009:
The lowest quintiles share of the federal tax liability was 2.1% in 1979
The second quintiles share of the federal tax liability was 7.4% in 1979
The middle quintiles share of the federal tax liability was 13.6% in 1979
The fourth quintiles share of the federal tax liability was 21.6% in 1979
The highest quintiles share of the federal tax liability was 55.3% in 1979
I'm no genius, but it looks to me like everyone is paying less of a share than they used to for their government except for the top 20%, and before you go there, the top 1% went from a 14.2% share of the liability to a 22.3% share of the liability.
People wanted a progressive tax system, and they got it in spades.
Now we have a president that wants to raise taxes "on the rich" because they arent paying "their fair share", and in light of the evidence that "the rich" already pay most of the taxes, its hard not to conclude that this is pure class warfare unless you don't actually know the evidence.
These numbers I give arent from some right wing blog, and they arent from fox news. They come verbatim from the Congressional Budget Office. I didnt "adjust" them, nor am I misrepresenting what the figures are actually of.
I also didn't cherry pick, as is evident because I did not use the individual income tax data (which excludes among other things the social insurance taxes) which puts that bottom quintile at -6.6% (yes, NEGATIVE 6.6%) and the top quintile at 94.1% (yes, 19 out of 20 dollars in income tax is paid by the top 20%)
Your turn. Please argue that Obama is not trying to redistribute the wealth, but do so by using actual data instead of supposition and innuendo, and neither "adjust" nor cherry pick the data. Can you do that, or are you just a bunch of opinion? -
Re:Immigrants... right
Here's a CBO report on illegal immigrants and their effect on taxes. While illegal immigrants do use services, they seem to pay quite a bit in taxes, too. They pay sales taxes and by renting property they are indirectly paying real estate taxes that fund local governments and schools.
-
Re:America's hand is being forced...
I've posted this so many times on
Wouldn't it be great if there were a non-partisan government body which went over all the government accounting books and figured out what's causing the budget to blow up out of control? Guess what? There is. It's called the Congressional Budget Office. Every year or two they put out a long-term budget outlook where they outline where we're headed, and what's causing the problems, and how changes we can make to the budget can change that course. Please read it, or at least read the summary if you can't read the whole thing.
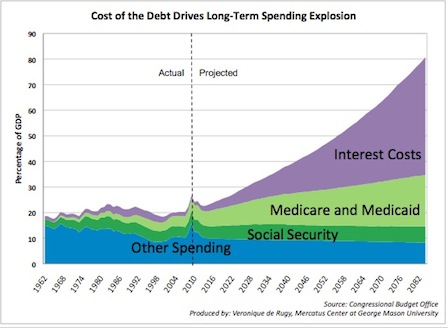
For the last 12 years, they've pointed out over and over that the primary cause of our budget woes is Medicare/Medicaid and to a lesser extent Social Security. The historical average for federal tax revenue is about 18% of GDP. Did you know that on our current course, Medicare/Medicaid will grow to consume 18% of GDP some time around 2050-2070? That's right, 100% of tax receipts will go to pay for Medicare/Medicaid and nothing else. We're not being driven to bankruptcy by banks or the military industrial complex. We're being driven to bankruptcy by voters wanting stuff in their old age without having to pay for (most of) it. -
Re:Right idea, wrong target
Please, for a moment put aside everything you hear your peers say and ask yourself with an open mind: "what if military spending isn't the problem?" Read the link. The vast majority of the $200 trillion is unfunded entitlements (net difference between estimated outlays vs receipts).
This matches with what the Congressional Budget Office reports have been saying for 12 years now. Social Security and especially Medicare/Medicaid are driving us to bankruptcy. That's not saying we have to get rid of them, but they need to be seriously overhauled to keep their costs within realistic levels (e.g. raise retirement/benefit ages to keep pace with life expectancy).
Military spending is a red herring. Yes it can be cut. But even if we completely eliminated it we'd still be on a path to bankruptcy due to the above entitlements. The only route to fiscal solvency is entitlement reform. The longer people refuse to listen to what the CBO has been telling us for over a decade because it's inconvenient to their political ideology, the worse it will get. -
Re:those billions
Read the CBO reports; you know, the recommendations for balancing the budget put forth by a nonpartisan government office whose sole purpose is to analyze the budget and put together budget recommendations. Most of the deficit/debt is due to rising cost of social programs (primarily Medicare/Medicaid). You can read the CBO long-term outlooks all the way back to 2000. They all say the same thing - Medicare/Medicaid expenses are going to blow up and we need to do something about it, Medicare/Medicaid expenses are going to blow up and we need to do something about it. Well we didn't do anything about it, and here we are.
Or you can continue with the misguided belief that everything can be fixed by cutting military spending, thus assuring economic catastrophe (on our present course, Medicare/Medicaid will consume all tax revenue in about 50 years). The annual deficit has exceeded the entire military budget for several years now, so even if you reduced military spending to zero we'd still have a deficit. -
Re:Wait until the end of Obama II
Discretionary spending chart from the CBO. Revenue exceeds mandatory+interest by only 100 billion.
The entire 1.3 trillion discretionary budget must come out of that leftover 100 billion to avoid raising taxes or increasing the debt. Note that 700 billion for the defense budget is included in that 1.3 trillion.
So even if we cut the entire non-defense budget (including veterans benefits since that isn't "defense") We'd still have to cut 600 billion from the defense budget to come in balanced.
Taxes need to go up. There's just no way you can cut enough to make it work.
-
Re:Government roads
It would seem the history of state and federal spending since 1956 disagrees with you. As you can see in figure 2 on page 9 of this paper, there is a clear upward trend in the majority of years. http://www.cbo.gov/sites/default/files/cbofiles/ftpdocs/121xx/doc12173/05-17-highwayfunding.pdf
-
Re:much as I like NASA...
Much as I like NASA, if that's what it takes to get the deficit under control, then that's what needs to happen.
This won't do squat about getting the deficit under control. The cause of the deficit is Medicare/Medicaid. The Congressional Budget Office has been telling us this for over a dozen years. Left as it is, Medicare/Medicaid will consume all tax revenue in 50-70 years. All the savings from cutting defense since the 1960s (when it consumed over 10% of GDP - half the federal budget) has been counteracted by growth in Medicare/Medicaid.
Unfortunately, (1) The most powerful voting block is retired people, who are the primary beneficiaries of Medicaid/Medicare. They vote against anyone suggesting it be cut or restructured to slow its growth. And (2) most members of one of the major political parties absolutely refuse to believe social programs are the cause of our budget woes (they're excluded from the automatic cuts if sequestration hits). They think everything can be fixed by cutting defense spending, even though we'd still be running a budget deficit if we dropped military spending to zero. And no, FICA taxes do not cover Social Security and Medicare/Medicaid. Medicare/Medicaid outlays have exceeded Medicare/Medicaid tax revenue for over a decade, and Social Security outlays began exceeding Social Security tax revenue in 2010. We've known for 3 Presidents exactly what the problem is. We've just refused to do anything about it.
Don't take my word for it, don't take some pundit's word against it. Read the CBO reports. Read their older reports if you like. Then decide for yourself. -
Re:Air resistance.
No such thing as freeway driving, just freeway parking. If the whitehouse could bring freeway speeds up to 50MPH...
That's quite easy. Given that freeway congestion is a type of shortage (too many cars trying to use the same road at the same time), anyone with a basic understanding of economics knows how to eliminate the shortage, even without adding lanes.
-
Re:s/Social Security/the Military
Social Security has been paying out more than it collects in revenue for a couple years now, and is projected to get worse from here on out (unless our politicians do the grossly unpopular but inevitable thing and raise the retirement age so it keeps pace with increases in life expectancy).
Also, the SS fund is not separate from the general fund. The money you pay into FICA taxes is not held in a separate interest-bearing account until you retire, then given back to you. It's used to pay for the SS payments of current retirees. When you retire, your SS payments will come from the FICA contributions of the then-current workers. If you treated SS as a pension plan and did a proper accounting of it, it would be a huge red hole since future liabilities far, far exceed revenue collected at any given moment. (This is a side-effect of the way SS was started - retired people in the late 1930s received full SS payments even though they never contributed a dime. People who retired in the 1940s-1970s received full SS payments even though they only contributed during part of their working career.)
The longer people deny the existence of the SS/Medicare problem, the worse it's going to get. Right now SS + Medicare are projected to exceed all Federal tax revenue (average 18% of GDP) some time around 2050 (figures 1-1, B-1). Something needs to be done to rein them in, and the sooner the better. -
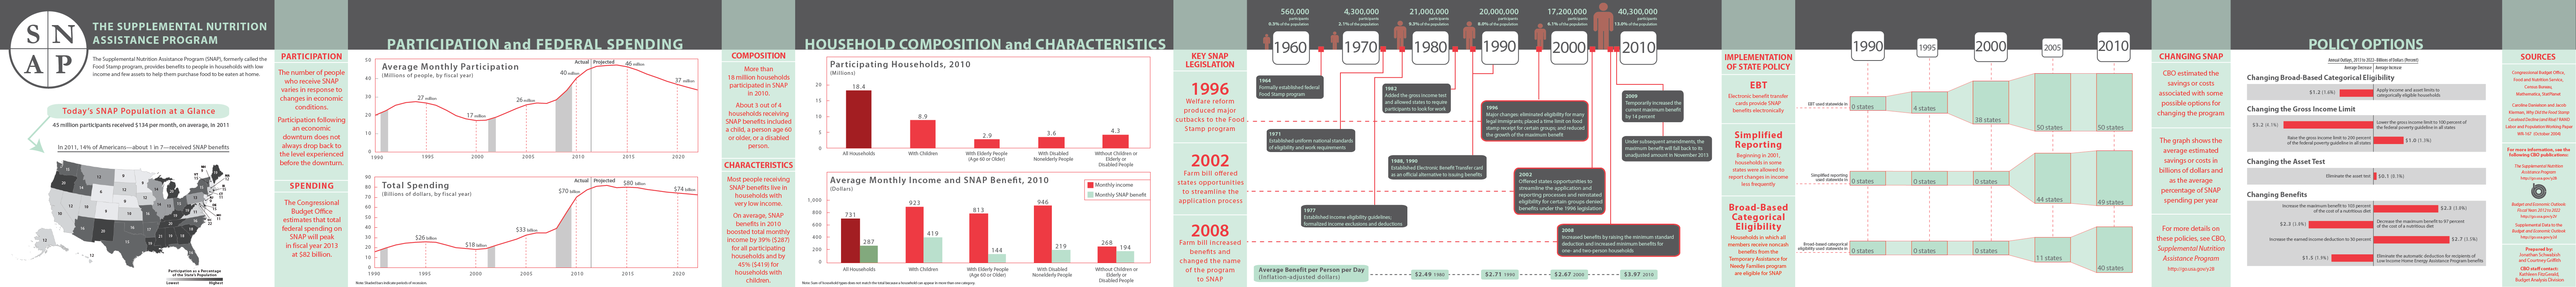
Money better spent on food stamps than science
The number of people on food stamps has more than doubled since 1990. I guess people on food stamps are more likely to keep incumbents in office than scientist so the money goes to them. http://www.cbo.gov/sites/default/files/cbofiles/images/pubs-images/43xxx/SNAP_Infographic_4_18_2012.png Note we went from spending under 20 billion in 1995 to 70 billion in 2010. The shortfall mentioned in the article that is forcing the shutdowns is 75 million.
-
Re:Who decides?
And who decides who's on that office?
I really like the idea, I'm just worried about what the implementation would be.
A normal hiring process. Using the CBO as an example again, here's their "career opportunities" page.
-
Re:Gotta love politicans
Instead of cutting where its needed (gross government pay and military), they cut everything else instead.
The problem with the Federal budget isn't military spending. Yes defense can be cut, but it's already the one budget item which has been cut the most in the last 50 years. Right now, our annual budget deficit exceeds the defense budget, so we could drop defense spending to zero and we'd still have a budget crisis. And FWIW, defense spending is on the chopping block as well if the Budget Control Act kicks in.
Likewise, the U.S. spends pretty close to the most of any country on public education per student. So our education problems aren't because of lack of funding. The "lack of money" for education is an illusion created by school administrators, either to cover up their own incompetence or to attempt to carve a bigger piece of the budget pie for themselves. Cutting defense and shifting the money to education is just swapping one form of wasteful spending for another.
What needs to be cut are the social programs - primarily Medicare and Medicaid. Social Security was a problem too, but its growth was mitigated with some of the reforms passed some years ago. Don't believe me? Go read the CBO reports. They've been saying this for over a decade now - Medicare and Medicaid projected to grow to consume 100% of tax revenue by 2050-2070 (the doomsday date changes from year to year). The notes on the NPR graph mention the same thing too - that the social programs are the parts of the budget which have grown the most. Unfortunately some people refuse to acknowledge that this is the real problem, and jealously guard these programs against any and all cuts - Medicare, Medicaid, and Social Security are all exempt from the Budget Control Act's mandatory budget cuts. And instead insist that everything can be fixed by cutting defense when simple math ($budget_deficit > $defense_budget) says it can't.
Don't trust what I tell you, don't trust what your friends in your political circles tell you. Read the CBO reports and decide for yourself. They're very enlightening. -
Re:Gotta love politicans
The funny thing is, even if the US cut 100% of that spending overnight, it still wouldn't make up the deficit.
It's approximately the same ($1171/$1253B) (depending on whether you use the baseline or proposed budget), and only that bad because of the economy. Projections for the future are $612B/$977B in 2013 down to $175B/$510B in 2018.
-
Re:Let's really have a look at spending
And by far, the single largest contributor to the national debt over the past 20 years would be a certain set of tax cuts that were passed in 2001 by a Republican senate, under reconciliation rules (thus no supermajority for cloture required), without matching spending cuts [crooksandliars.com].
Oh, crooksandliars.com - well there's a credible, non-partisan source of information, for sure.
I shouldn't even reply to this, but this lie has been propagated enough I'm afraid people will actually start to believe it. Of course, it's not true, as pointed out by the Congressional Budget Office in their report:
The tax policies enacted a decade ago are responsible for just 16 percent of the swing from surplus to deficit. Furthermore, given that only about one-fourth of the tax cuts went to upper-income earners, just 1/25th of the decline from surpluses to deficits resulted from upper-income tax cuts. (NOTE: Given that CBO does not take into account any of the positive impact of tax cuts on investment, savings and economic growth, the percentage was actually even smaller than the 1/25th estimate)
The CBO report has shown that new spending and net interest were three times as responsible for the deficits as the 2001 and 2003 tax cuts – and 12 times as responsible as the upper-income portion of the tax cuts.
And here is the full report. Try using math instead of inflammatory partisan rhetoric if you plan to refute it.
-
Re:Obvious money giveaway is obvious
He's already been doing that since he's been in office with no results.
http://www.cbo.gov/publication/42715
Sorry, the CBO disagrees with you.
"The CBO figures released Tuesday estimate that the stimulus package raised the gross domestic product this past quarter by 0.3 percent-1.9 percent.
The CBO report provided a broad range of the estimated number of full-time jobs created because of the stimulus â" from a low of 500,000 to a high of 3.3 million jobs."