 Slashdot Mirror
Domain: eia.gov
Stories and comments across the archive that link to eia.gov.
Comments · 833
-
Re:Show us the data
It's almost impossible to compare because figures for the externalized costs of coal and gas are very hard to calculate. It's difficult to evaluate the value of health and a human life, or how much damage can be attributed to energy production and not other things.
In any case, as wind gets cheaper its capacity factor is rocketing up too.
Wind's capacity factor is basically stagnant. In the US, most utilities have agreements that they have to buy all available wind production before they can purchase electricity produced by other sources. Capacity factor is simply the yearly actual output divided by the yearly theoretical nameplate output. Since wind power must be purchased, the capacity factors we are seeing in wind represent about the maximum possible. Only maintenance outages or no wind will reduce the capacity factor of a wind farm. Wind capacity factors average of about 30%, but of course it varies depending on how good a location the wind farm is in.
A 30% capacity factor means that you need to build about 3x the number of turbines compared to other technologies. You also need to have backup sources which sit idle when the wind is blowing. That costs a lot of money per kw-hr since backup plants have significant fixed costs but can only recoup these costs when they operate. -
Re:From TFA
The capacity factor of a load following coal plant in Germany is also only 40% or less (hint: it is only running between 6:00 and 21:00)
Same for a french load following nuclear plant, as France has a higher base load than Germany their load following plants are perhaps at 60% CF.
As long as you don't knwo what a CF actually expresses it is pretty pointless to use it in arguments.
In the U.S., coal-fired power plants operate at around 60% capacity factor, and nuclear plants at nearly 90% (Source.) The capacity factor of the coal plants you mention in Germany is because they are load-following plants: they turn them off half the time, because they don't need them. The capacity factor for wind and solar is low because of source intermittency: the wind doesn't always blow, and the sun only shines during the daytime. You can't use something to follow load if it is physically incapable of producing energy.
-
Re:From TFA
As the wind capacity factor increase make the natural gaz capacity factor decrease, then there should cross in the future. Actually the natural gaz is at 62% and wind at 37%, so the cross could be somewhere around 50% capacity factor.
Even if you make the (rather dubious) assumption that capacity factor for wind and solar will increase at a linear rate indefinitely, what makes you think the capacity factor for natural gas is declining? According the U.S. Energy Information Agency, it isn't.
Furthermore, the capacity factor for natural gas is relatively low precisely because you can turn on a natural gas turbine any time you want, so they are used to compensate for demand peaks, and left off the rest of the time. You can't do that with wind and solar: the low capacity factor isn't because you leave them off most of the time, it's because of intermittency in the source. Which has to be compensated for by something else.
-
Re:Just
http://www.eia.gov/forecasts/a...
Not even close unless you come up with some other cost to tack onto the fossil fuel generation that doesn't actually exist on people's electric bills.
BTW, those are 2020 rates, not current, so they take into account how much it takes to build the power plants rather than relying on already built plants vs plants that aren't built yet.
-
Re:Unintended consequences
It's not a false dichotomy. There continue to exist coal plants right now, and have for decades in the past, and will be for some time to come. Because renewables haven't replaced them. Therefore we have gone and chosen coal over nuclear for decades. It's a *real* dichotomy. Making the discussion nuclear vs. renewables is the false dichotomy.
Think of Ahmdahl's law. You should focus your efforts on fixing the big problem, then reassess the situation afterward. Even if I agreed that it's important to transition off of nuclear, it's just not even in the same league as fossils, so we should replace fossils first. Perhaps that will happen naturally as battery and grid transmission losses decrease.
My favorite is when nuke fans include dam collapses from decades before the first nuclear power plant was ever built. Nevermind that if we had nuclear power in 1900, we would have had some more Chernobyl's and Fukishimas.
You don't have to. You can take it per capita, and start it with dams built starting at the same time as nuclear power plants, and get the same results. Hydroelectric dams are much better than coal, but hardly optimal in terms of lethality or ecology. Even aside from human lives, they can be environmental disasters all on their own. However, once built, the damage is pretty much done, so we might as well take advantage of them.
If you replace thousands of coal plants around the word with nuclear power plants, you're going to see a lot more Fukishima's because more plants will be hit by once-in-a-thousand-years disasters just based on statistics.
Yes, you will, and the statistics bear out that this is a better result than continuing to see all the casualties from coal.
Which can be done for a fraction of the cost of nuclear power
Then do it. I'm certainly not stopping you. If you can wipe out nuclear in the free market, then you can just do so and we don't even really have to discuss it. It's not like nuclear power has entrenched backing that's going to sabotage your batteries or whatever.
I have a prediction. If you run the numbers, attempting to be perfectly honest in terms of cost and using only reasonable assumptions about future advancements, but excluding fossil fuels as having unacceptable externalities, then I predict your results will include some renewables and some nuclear. Go ahead and prove it wrong. Not going to stop you.
Some stats I found here: http://www.eia.gov/forecasts/a... show that land-based wind is fairly favourable *when the wind is blowing*, the others don't do so great (certainly not "a fraction of the cost" even when the wind is blowing), except geothermal which is a clear winner in those few cases where it is available. Hydro is in the same ballpark. Other sources: http://www.forbes.com/sites/ja..., http://www.renewable-energysou..., http://nucleargreen.blogspot.c.... Note some of those sources point out, correctly, that fossils are basically the cheapest. That's why we still have them (if they weren't fairly cheap, the problem would basically solve itself). Of course, fossils don't capture all downstream externalities in the way that nuclear and non-hydro renewables tend to.
-
Re:Oh boy... Nuclear!
The article explains that at a cost of 19 cents/kwh no one will build any nuclear power plant since solar and wind can be built for much less. So, really, if nuclear isn't subsidized, it isn't going to happen.
The 19 cents/kWh is for a new 1600 MW (net) plant planned in Virginia, which is expected to cost $19 billion.
San Onofre Nuclear Generating Station units 2 and 3 were built for about $10.3 billion in 2015 dollars, and generated 2x1075 MW = 2150 MW (net). It was decommissioned in 2012 after 29 years in operation, 11 years shy of its license expiration, and 21-31 years shy of its expected lifetime. Its decommissioning fund sits at $4.1 billion, which is more than enough to cover the expected $4.4 billion decommissioning cost (the fund will earn interest over the ~20 years), despite the plant only being operational half as long as planned. The fund came from surcharges paid by customers (a couple cents per kWh) during the decades SONGS was operational.
So the question you really should be asking is, why after 30 years of technological progress and advancement, does it cost 2x as much in inflation-adjusted dollars to build a nuclear plant with only 3/4 the power capacity? -
Re:Oh boy... Nuclear!
All power sources have gotten subsidies over the years, mainly because abundant low cost energy is seen a central to a thriving economy. Nuclear has received a lot of subsidies, but has also produce huge amounts of clean air power in return. If you calculated in on a per MWH basis, no energy source has ever been subsidized nearly as heavily as solar and wind are. Its not even close. And that includes estimating future generation from installed sources. If you would give nuclear 1/3 of what solar and wind are getting on a per MWH basis, there would be a rush to get going.
Levelized cost projections from a credible, objective source can be found here: http://www.eia.gov/forecasts/a...
Of course, there is value in being consistent and dispatchable rather than variable and non-dispatchable that is not reflected in these numbers, nor are the cost of overcapacity required if were were to be fully wind and solar based. What is included in the levelized cost for nuclear is waste disposal and decommissioning, just in case you were wondering. -
Re:Of course
I'm sure it does sound like bulk scale... until you know the total size of the market...
In June 2015, the US generated 361,698 GW of electricity.
The total US pumped storage is equal to 0.0059% of 1 month of US power generation. That isn't even 1/100th of 1/100th of a percent.
It is not "bulk", it isn't even a rounding error, it is random noise.
-
Re:Its all in the taxes and incentives.
And that's the tragic part... wind/solar are currently a massive waste of resources.
Source? With coal units finally having to significantly reduce their negative externalities, it is more expensive for a new coal asset than a wind asset. People aren't building many new coal plants (in the US), most of the new installed capacity these days is natural gas or wind.
According to the US Energy Information Administration (EIA), looking at the Total System LCOE column (which excludes the subsidies column) of Table 1 Estimated levelized cost of electricity (LCOE in 2013 $'s) for new generation resources, 2020:
Wind $73.60/MWh
Conventional Combined Cycle (natural gas unit) $75.20/MWh
Conventional Coal $95.10/MWh
Solar PV $125.30/MWh -
Re:Apple TV = xbox?
The average US power rate is 12.22 cents/kWh. There are an average of 730 hours in a month, so an average cost of $89.21/kWMonth
$5/mth is 0.056kW, or 56 Watts. That means the console is using an average of 56 watts over the month. This chart suggests an average of 80W between PS4 and XB1 when streaming 1080, and negligible when idle. That means the console is being used 17 hours per day, the console is faulty, or the poster is lying (or excluding the TV / stereo power usage).
I'm surprised these devices use so much power. I'm pretty sure my Chromecast uses less than 5W while streaming Netflix.
-
Re:cause Alaska's huge in resources, not in popula
I think that you're forgetting that Texas produces about 8x as much crude as Alaska. If they had setup a similar fund we would be talking about at least $400 per year. Not too shabby.
Sorry, but you are being fuzzy with the math. According to that page, the total for the semester was 635,251 for Texas and 89,695 for Alaska, so the factor is 7.08. So the amount each Texan would receive would be just over $316. That is not only 21% less than your estimate, but also 1/6 (more precisely 16.8%) of what the Alaskan's received.
And if you look at the year in question (2014), the numbers become 1,157,262 for Texas and 181,425 for Alaska, the factor becomes 6.38 and the amount received under $285 or just 15.2% of what Alaskans received. The point is that the numbers become far less impressive when you look at a normal state that isn't severely underpopulated as Alaska.
About the Norway thing... yeah, I agree with you. In fact we should do a lot of things like Norway, although lots of people would kick and scream if we did.
-
Re:cause Alaska's huge in resources, not in popula
If this had happened in Texas (another state that produces a lot of oil, though in general doesn't have all the natural resources Alaska has), those $1.2 billion would amount to... less than $45 for each of it's 27 million inhabitants.
I think that you're forgetting that Texas produces about 8x as much crude as Alaska. If they had setup a similar fund we would be talking about at least $400 per year. Not too shabby.
Now, if either state had followed Norway's lead and kept most of the oil profits for themselves, we would be talking about substantially larger amounts of dividends or savings. Norway's fund is now approaching a trillion dollars in value -- for a country with a population one fifth that of Texas's, and approximately the same level of crude production.
-
Re:This is kind of a trope
New York State:
11,131GWh / month http://www.eia.gov/state/?sid=...
8,525GWh/ month non Renewables
82 GW of solar required for 3.5 hours
At 10% efficiency = 820 km^2
At 20% efficiency = 410 km^2
Area of New York = 1,214 km^2(Although 789 km^2 is land)
Metro Area of New York = 34,490 km^2 -
cognitive dissonnance
Of course congress-folk don't listen to congressional testimony, it would cause cognitive dissonance with their belief system (well actually their top campaign contributors belief system), it's a human (and I use the term loosely in the context of congress-folk) failing that we all suffer. We don't listen to evidence that doesn't fit our world view.
FWIW in this case, sadly, the biggest lever we seem to have to control AGW is to create recessionary economic conditions (which is how the US achieved a net reduction in green-house gasses between 1997 and 2012). The question we need to ask ourselves is it worth causing recessionary conditions to achieve a reduction in green-house gasses and hope this keeps AGW at bay, or should we just batton-down-the-hatches and prepare for climate change as being inevitable.
I'm in the batton-down-the-hatches camp, but I can see arguments for the former, I just doubt it is achievable so we should just spend our limited resources and try to adapt. Unfortunately many folks see this position (i.e., they do you want to cause a recession position) and think you must be a denier, a classic false dichotomy fallacy. I don't deny anything about AGW, except that the premise of clamping down on greenhouse gasses to pre-industrial levels would be a productive exercise.
I have yet to see a policy/model scenario that predicts AGW from ever stopping (most simply attempt to make a reduction and hope for a miracle in future technology) and maybe it's time for us to simply embrace the future. All this gnashing over the minuscule amount of greenhouse gasses we can reduce w/o eliminating a few billion people and cows from our planet is really just self flagellation. If we really wanted to do that, we could release another spanish flu or black plague on the world, but I don't see too many people supporting that position.
-
Re:Look at the prices
Response to your OT thought: It's still probably a net gain, mostly because gas-powered personal vehicles are just horribly inefficient. Consider this: it is more efficient to use the gasoline intended for your vehicle in a full-size gasoline-fueled power plant, generate electricity, send that electricity across power lines across long distances and incur lossage there, store it in a battery, incurring additional lossage, then use that to power an electric vehicle. All of those extra losses are still more efficient than just using the gasoline directly.
So, let's look at electric car usage (which, as noted, is more efficient than a gas car). The average EV uses around 30 kWh for 100 miles. Helpfully, this is pretty close to the average daily usage for an American home, which is around 30kWh as well. Average driving is ~33 miles a day. Given that your major usages for power are likely to be heating or cooling related (e.g. refrigeration, A/C, washer/dryer), I don't think minor increases from a larger TV and such will match the significant difference of reducing the initial consumption by 1/4.
-
Re:Great, but
Storage always costs more than production, and always will. Decreasing trends don't last forever, and it will slow down, and in fact, it can only get so cheap.
Any arguments why it only can get so cheap? It doesn't make any sense to me. Sure trends can change, but it doesn't look likely with all that increasing funding in battery research and increasing demand for storage. I can get a quote from local home solar PV installers with or without battery backup (Tesla Powerwall or whatever). Cost difference for 5.5kW is just $16k vs $23k, plus you have backup in case of grid outage. It isn't enough for seasonal storage, but enough for daily.
Only if you build fusion plan right now for the fraction of the cost of fission plant.
So, what you are doing is moving the goal posts. Fission already costs a fraction of solar and offshore wind, without the storage requirement. Why would you expect that fusion should cost a fraction of a fraction of all other power generation methods?
http://www.eia.gov/forecasts/a...
You are contradicting yourself, first you say that solar is on par, than that fission costs fraction of solar. Which is right? You source gives numbers 95 nuclear vs 125 solar PV. But it is obviously not a full price, it doesn't include taxpayer provided nuclear liability insurance (Price-Anderson Act). This cost is huge and nobody would be building nuclear plants without this subsidy. It doesn't include nuclear waste storage for thousands of years, which is impossible even to calculate, while operational time is just few decades. It doesn't include backup plants that are required to balance grid in case of reactor shuts down unexpectedly. It doesn't include lost opportunity cost - nuclear plant license is for 40 years, and capital payoff takes decades, and how exactly you predict energy costs for 40 years? Nobody builds nuclear plants in the US anymore for these reasons, natural gas is cheaper and much more flexible. Some of these unaccounted costs would apply to fusion as well.
Sure I agree that if fusion would provide $95 MWh cost right now, it would be competitive to some extent. Now. Or maybe not, as natural gas in your source is around 60, and you can store gas and quickly power on when there is demand. But it is like arguing about pie in the sky, you will not have any fusion cost number for decades, and when you will have, situation will be completely different.
-
Re:Great, but
Storage costs are going down rapidly, around 8-14% per year. At that speed, storage will use increase and it would fund further development of storage technology. By the time fusion will be ready, storage costs will be irrelevant.
Too cheap to meter huh? Or perhaps you don't understand that what you say is impossible?
Storage always costs more than production, and always will. Decreasing trends don't last forever, and it will slow down, and in fact, it can only get so cheap. Solar is about on par with nuclear without the storage, and is getting cheaper, but can only be so cheap.
BUT, what you tried to say which I was responding to was this:
Only if you build fusion plan right now for the fraction of the cost of fission plant.
So, what you are doing is moving the goal posts. Fission already costs a fraction of solar and offshore wind, without the storage requirement. Why would you expect that fusion should cost a fraction of a fraction of all other power generation methods?
-
Re:Wow
Except that it doesn't make sense without subsidy. Solar is still one of the most expensive per megawatt of any of the various energy sources. Even with projected costs reducing the price, the forecast by 2020 for solar is not bright. http://www.eia.gov/forecasts/a...
-
Re:Good for experiments, not powerplant ready
http://www.eia.gov/forecasts/a...
Coal is only cheaper than natural gas when comparing the cheapest coal technology against the most expensive gas technologies. The cheapest gas technology is well below the costs of the cheapest coal and at the expensive end the two are pretty much competitive in costs.
-
Re:Good riddance, Tesla
1) That's oil that could have been left in the ground or used to produce electricity or some other use.
2) That's almost entirely accounted for. The calculation takes the BTU of a barrel of crude, refining efficiency (~85%) and the BTU of the resulting refined products and converts the difference to kilowatt-hours.
Keep in mind that's only the energy consumption of the refining process. If you do a full "well-to-wheels" analysis of the various energy sources, fossil fuels start to look ugly very quickly.
http://www.plugincars.com/refi...
http://www.eia.gov/energyexpla... -
Why solar?
Solar is currently the most expensive renewable by far. I know the dream is to power everything in your house with solar panels on the roof, but the technology just isn't there yet (at least without tremendous expense).
The latest complete electrical production stats (2013) put renewables at 12.8%. 6.6% of that is hydro, 4.1% is wind, 1% is burning wood (yes it's a renewable), 0.5% is "other biomass" - mostly natural gas captured from landfills, 0.4% is geothermal, and only 0.22% is solar (thermal and photovoltaic). Solar isn't last because of some grand conspiracy. It's last because it's the most expensive.
Why would you want to put the most expensive technology on the fast track for widescale adoption? Because it taps into the wishes and dreams of those who don't know better? The whole point of being an elected official is that your sole job is to learn this stuff so you can make better decisions about it than the voters who elected you who don't have the time (or sometimes the capability) to learn this stuff. A more well-reasoned approach would be to encourage wider adoption of wind (hydro is pretty much tapped out in the U.S., and wind is just a hair's breadth more expensive than coal), while continuing subsidies into solar R&D. Encouraging wide-scale adoption of PV solar at current levels of technology and cost is wasteful and foolish when better alternatives exist. -
Re:Efficiency
Can the electric grid handle charging that many cars every night?
In 2014, the United States produced 4,093 billion kilowatthours of electricity. There are 254 million cars in the United States. It takes about 30 kilowatthoursto charge a completely drained small electric vehicle. Assuming that a car needs to be charged only every other day, this represents 3.75 billion kilowatt hours of electricity every night, or over the year, about 334 times our current electrical usage.
-
Re:Or let us keep our hard-earned moneyThis is an interesting assertion that I would like to know more about. can you provide any sources for reference?
In the case of coal power, it's often found that the external costs per kWh is actually DOUBLE that of the internal costs. So if you get $50 of electricity from coal, it's actually costing you $150. This translates to you, on average, getting one extra upper respiratory tract infection each year, plus a small chance of lung cancer or other serious illness that can lead to death.
Yes, it's actually cheaper to spend $100 on cleaner electricity in the first place.
I live in coal fired power land and in my 4 decades I've never had an upper respiratory infection and neither has any of my immediate family. I also don't see respiratory issues in my friends and coworkers outside of those that smoke. For reference I can see a natural gas power plant out my window and I could drive 50 miles either way to a coal power plant - 100 miles to nuclear. My electricity cost is $.10/kwh.
Also, the following article give some insight to the high energy usage by at least hospitals: http://www.eia.gov/consumption... quote from article: "The 2003 Commercial Building Energy Consumption Survey (CBECS) data showed that large hospitals (greater than 200,000 square feet) accounted for less than 1 percent of all commercial buildings and 2 percent of commercial floorspace, but consumed 4.3 percent of the total delivered energy used by the commercial sector in 2003" -
Is it like Romney's 2$ gasoline?Romney in 2012 made dramatic and what he thought would create shock value by promising 2$ a gallon gasoline. Obama actually saw 2$ gasoline for a brief period! Free market has a way of doing things no one predicted.
The current trend is 500 million new solar panels without any special action by any legislator/executive. Simple market forces and trend lines. Residential solar is becoming competitive with subsidies and net metering. Utility scale solar is on track to become competitive with natural gas in a few years. It is already competitive with coal for fresh installations. No new coal plant has come on line this year and last. The pipeline is dry too. Number of coal plants have fallen from 633 to 518 in the last decade. Coal has lost 20 GW of capacity in that time, and is on track to lose another 40 GW. Natural gas providing base load and solar meeting the peak load is going to become the norm in the next 10 years. No new breakthrough in energy storage, no battery wall made by Elon Musk, no widespread investment by home owners needed. Simple existing technologies, free market forces, interest rates and world flush with 2 trillion in capital not knowing where to invest for good returns.
So half billion new solar panels might happen no matter who wins, Hilary or Jeb! or Walker or Trump or Bernie. We might even look back and see Hilary's half a billion solar panels the same way we look at Romney's 2$ gasoline.
-
Re:What are they going to replace with?
Numbers?
Current EDF tarrifs are 0.144 EUR/kWh (flat rate, or you can go for the night rate deal, 0.1572 daytime, 0.1096 off peak).
I've seen claims that average US prices are around 12.64 cents/kWh, http://www.eia.gov/electricity/monthly/update/end_use.cfm which is more or less exactly the same amount.
-
Re:Economic factors are my priority
It's not the 1970s any more. America is close to being a net exporter of oil now, and is a net exporter of energy overall.
Not according to the U.S. Energy Information Administration, U.S. energy exports are only 43% of your imports. Crude exports are a mere 5% of your imports. The total amount of exports is also overstated because the U.S. imports crude oil from Canada, refines it and then exports it to other countries, thus inflating your export total as a percentage. So, America has a 5 million barrel a day deficit between imports and exports. Total U.S. production is about 8.7 million barrels a day, so you'd need to increase U.S. production by about 60% before you could become a net exporter of energy, which would put your production target at about 4 million barrels a day more than the U.S produced at it's previous peak production.
-
Re:Blame the far right and left for this.
Actually, no.
Actually, yes. Your solution may or may not be ideal, unfortunately, it has no relevance at all to what I was talking about. If you would like to comment on why your plan would be better for the poor than a tax refund, please do so. However, you neglected to provide any reasons why your solution would be actually be better for anyone, and since I was merely explaining how a carbon tax could actually be beneficial rather than detrimental to the poor people of America, your comment seems a little lost.
would drop our use of fuel oil (which mostly comes from venezuela)
Assuming you're American, according to the U.S. Energy Information Administration, that doesn't seem to have been true since the early 90s, it seems to mostly come from Canada recently (6.5 million barrels per month out of total imports of 7 million barrels).
-
Re:Flawed research, garbage in garbage out
There has not been much change in coal plant output since 2010/2012
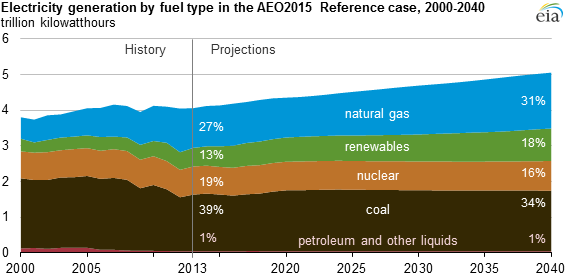
"Some in the know" -- like the Energy Information Administration -- disagree. Have a look at Electricity Generation by Fuel Type, 2000-2013, and know that coal generation has fallen since then -- in April 2015, natural gas fired plants generated more electricity than coal fired plants since, well, since ever.
or at least not enough to significantly change the conclusions
Nonsense. The decline in coal-fired generation comes in two ways. In the first way, all plants reduce their output some. For "average" coal plants, that's what's happened everywhere in the country, and it might not be enough to significantly change the conclusions. For a number of coal plants, however, they were generating electricity in 2010 and they have since retired. For the region in which those particular plants operated, the conclusions may be very different now.
The trend will continue for a while. Another 20 percent of coal-fired electric generating capacity is scheduled to retire in the next few years, to be replaced by renewables, natural gas, energy efficiency, and in Tennessee, South Carolina, and Georgia, nuclear power (in the early 2020s).
-
Re:"Replace large-scale coal generation"? With WHA
And it's not just replacing current electrical generation - there would probably have to be a two or three ORDER OF MAGNITUDE expansion of electrical generation capacity.
100 to 1000 times more electricity? Really?
2014: 136.78 billion gallons of gasoline consumed.
At 33 kWhr/gallon, that's 4,514 billion kWh if you completely ignore any differences in efficiency.
2014: 4,093 billion kWh of electricity produced.
So at the absolute WORST case, it's a little more than double. But when you figure that an electric vehicle uses that energy nearly three times more efficiently, it's under 50% more.
And that's if you go ahead and replace *everything* that burns gasoline with electric, which of course you wouldn't.
Then after all that, producing ~50% more kWh does not translate into needing ~50% more power plants. You would need to factor in some diversity factor as not all power plants are running all the time nor at full capacity.
=Smidge= -
Re:Politics: SCGNews
That is very dated, a lot has changed since 2012. Our imports are down significantly in 2014, lowest levels since 1985.
-
Re:My concerns
The first point has been addressed many times already - even if you're powering your electric car on 100% fossil-fuel electricity you're still doing better than burning gasoline.
Do you have a link? A document dump is not helpful - just a clear link from an authority.
Googling led to these links:
What is the efficiency of different types of power plants?
Maximum theoretical efficiency of internal combustion engine
-
Re:Deceptive wording
Why so negative? This is a feel good article, and there's nothing wrong with that. It is pointing out quite rightly that solar has achieved a new milestone in adoption rate which is a good thing.
Yes it is well known that solar installed capacity does not correspond to generating capacity. And there is the problem of storing energy when intermittent renewable sources like solar become larger percentages of total capacity. But the solutions to these problems are available now if we choose to dedicate the resources.
Your numbers are also way off, solar has risen over 50% over the past year:
So yay. We went from half a percent to 0.51% total power input.
And oh darn. We maybe stayed around 20% at coal.The correct numbers Source:
March 2014: Solar 0.4%, Coal 41%
March 2015: Solar 0.6%, Coal 33%Most of the drop in coal usage came from the sharp uptick in natural gas. That same uptick is probably why solar outpaced coal. Solar is rising rapid though still very minimal, but accelerating the rate of install will get us to total renewable energy faster.
-
Actually much sooner
We will definitely be off fossil fuel by 2100, because we will be out of coal in 23 years http://www.dailykos.com/story/... out of oil in 50 years http://www.cnbc.com/id/4222481... and out of natural gas in 87 at the current rate http://www.eia.gov/tools/faqs/... (much faster assuming consumption goes up when we run out of oil and coal)
The world is going to become a very different place, in our lifetime. OK so we all have electric cars, but how do you travel to Europe without oil ? In an electric plane ? A battery powered boat ?
-
Re:Yeah, BUT
Drinking water comes from wells under 1000 feet down Fracking oil and gas wells are 5k feet deep or more where water is not normally found. http://www.eia.gov/dnav/pet/pe... Yeah if they don't do a good job sealing the wells you can get seepage. Most are done correctly.
-
Re: Cost effectiveness
You can't have a large proportion of houses in the neighborhood pulling 40 amps at 240VAC continuously for four to six hours every night at the same time.
I disagree. Homes currently pull quite a bit of load during the afternoon and evening - AC running, stove running, clothes dryer running, etc. That's when all of the generation capacity is running full-tilt. 40A at 240V is just under 10kW - not a whole lot of power, really. There's no real reason (other than cost) that the peak demand curve can't be extended out over additional hours, as long as the peak demand GW figure doesn't increase.
From this page:
Across the United States, but most pronounced in New England, the ratio of annual peak-hour electric demand to average hourly demand has risen over the past 20 years. In New England, the peak-to-average demand ratio has increased from 1.52 in 1993 to 1.78 in 2012. In other words, the highest peak-hour electric demand for the year in 1993 was 52% above the hourly average level while in 2012 peak-hour demand had risen to 78% above the hourly average level.
This higher ratio translates into decreasing average utilization levels for generators in New England and other regions. Electric systems maintain sufficient capacity to meet expected peak loads plus a reserve margin. As the peak-to-average ratio rises, generators called on to meet peak-hour demand are running fewer hours and/or at lower output levels the rest of the year. Because energy payments are generator's primary source of revenue in regional transmission organization (RTO) systems such as New England's Independent Systems Operator (ISO), the rising ratio of peak-to-average hourly demand is likely cutting into generator revenues and increasing the importance of capacity market payments to generators.
From this, it looks like the peak-to-average demand ratio was lower in the past and has been increasing lately, making the additional capacity needed to hit peak load run less often (the peak curve is much sharper/taller than it used to be). "As the peak-to-average ratio rises, generators called on to meet peak-hour demand are running fewer hours and/or at lower output levels the rest of the year." This is very costly, so I bet the generators would welcome additional load at off-peak times to recoup the cost of the additional capacity.
-
Re:I'll pay for subsidies here any day.
They forgot the benefit that it gets us out of the Middle East. That sandtrap is a massive waste of resources that I hate is being subsidized.
If only the Middle East were our main source of oil... it isn't.* And even with the shift to electric vehicles and solar power, petrochemicals are still vitally important industrial feedstocks, and thus a stable Middle East is still of prime economic interest to the West.
If we quit burning oil/nat gas, America will not need to import any oil. We have plenty for all of the other uses.
-
Re:I'll pay for subsidies here any day.
They forgot the benefit that it gets us out of the Middle East. That sandtrap is a massive waste of resources that I hate is being subsidized.
If only the Middle East were our main source of oil... it isn't.* And even with the shift to electric vehicles and solar power, petrochemicals are still vitally important industrial feedstocks, and thus a stable Middle East is still of prime economic interest to the West.
-
Re:LOL; What a fucking bozo you are
Oops on 1. It was roughly 1980 when America started to emit more CO2 than Europe. Prior to that, Europe emitted more.
I stand by #2, based on the above. You can see that starting in 2008, America's emissions started dropping, and has continued since that time. More importantly, it will continue for the next 4 years, if not longer. And here is EIA saying that much more will close. And IER thinks that 72 GW of 321 GW of coal plants are going to shut down before 2020. Note that Coal plants account for about 3/4 of electricities CO2 emissions in America. Shutting down that 72 GW, which are the worst, will take out roughly 1/4 of that CO2 of Electricities CO2 emissions.
This data from Europe, shows that America's data starts in 1992 at 5.0. hits highest point was 2007 (5.9 billion tonnes) drops to 5.3 in 2013. Likewise, Eu28 data start in 1992 at 4.3 and then sits at it until 2007, where it also drops to 3.7.
Sadly, this article does not do justice to the amount of emissions that Europe kicks out, but the map in it shows how much is really coming out of Europe AND CHINA.
And as to 4 above, that stands on its own. Again, OCO2 shows how much China emits, which is far far more than is generally admitted since Chinese leaders are lying.
and you can look up 5 and 6, or even think about it. China's emissions from 1850 on, exceed America's total. And considering that China and Europe have been burning coal for multiple millennium as well as have been the most populated areas of the world for the last milenium, it makes sense that they account for the majority. -
Re:Of course, there's this
Considering that solar alone gets more subsidies than coal, gas, and nuclear all combined, I think it would be solar that crumbles without them. And the only resource getting more subsidies than solar is wind, so that's two renewables down the drain without subsidies. It was true a few years ago that solar wasn't getting as much subsidy love, but the world's changed. Maybe Avory Lovins and people like him should try to keep a little more up to date before passing judgement.
-
Re:Does This Make Sense?
Start with a few facts rather than opinions pulled from the nether regions:
Coal accounted for 35% of electricity production in the US in 2014. This is down from 50% in 2005.
http://www.eia.gov/electricity...Thermodynamics:
Efficiency: Large power plants (such as coal powered plants) are very efficient. Internal combustion engines are very inefficient.
"According to a range of studies doing a ‘well to wheels’ analysis, an electric car leads to significantly less carbon dioxide pollution from electricity than the CO2 pollution from the oil of a conventional car with an internal combustion engine.[1][2][3] In some areas, like many on the West Coast that rely largely on wind or hydro power, the emissions are significantly lower for EVs. And that's today. As we retire more coal plants and bring cleaner sources of power online, the emissions from electric vehicle charging drop even further. Additionally, in some areas, night-time charging will increase the opportunity to take advantage of wind power -- another way to reduce emissions."
[1] Union of Concerned Scientists. “State of Charge: Electric Vehicles’ Global Warming Emissions and Fuel-Cost Savings Across the United States.” April, 2012. http://www.ucsusa.org/assets/d...
[2] MIT Energy Initiative. "The Electrification of the Transportation System." April, 2010.
[3] Electric Power Research Institute and Natural Resources Defense Council. "Environmental Assessment of Plug-in Hybrid Electric Vehicles." 2007. Cited February 16, 2011.
I charge my electric car from solar panels... YMMV -
Re:Does This Make Sense?
In 2014, 39% of US Electricity came from coal, and that percentage is declining.
http://www.eia.gov/tools/faqs/...
Coal isn't competing well with natural gas, and they're closing down a large number of older coal plants, and aren't building new ones. Most new plants are natural gas or renewables.
http://about.bnef.com/content/...
That said, it's still easier to control emissions at a single source than at thousands.
-
Re:Does This Make Sense?
no it does not make sense. Because it's wrong. 39% comes from coal.
http://www.eia.gov/tools/faqs/... -
Doesn't square with simple fact check
This US gov't site - http://www.eia.gov/state/?sid=... - lists New York state #50 in terms of per capita energy consumption. I recall reading elsewhere - sorry, no citation - that the energy consumption of a resident of NYC is 60% of the average in the USA, which makes sense based on personal experience. I, like many New Yorkers, don't own a car; most of my travel is by foot, bike or public transit, like most people I know who live here.
-
Re:Backup Generator replacement? Not so much
Of course, in America, we use less than 11,000KWH / year for the average home or about 30 KWH / day.
Of that, about 1/2 is used by HVAC (50 KWH / day when AC is going, and less than 20 KWH when AC is not going). And how much gets used at nighttime? Maybe 10-15 KWH.
So, the 10KWH makes a GREAT backup for the average home, if you are very easy on the electricity (i.e. just 2-3 circuits, and only important things like refrig, a string of lights, comm, Furnace/House Fan, maybe microwave ).
And that is with say decent solar on your home.
OTOH, if you have batteries, you can combine that with a lightweight generator, such as yours, so that it can be ran part time, with battery back-up. -
Re:Seems he has more of a clue
While you are facepalming you should wipe the egg off your face. And try googling for "USA oil production"
The US produced 3.1 billion barrels of oil last year.
http://www.eia.gov/dnav/pet/pe...The US imported 3.3 billion barrels of oil last year.
So I guess my statement wasn't perfectly accurate as we don't produce more than 50% of our own oil, and a significant portion of what we do produce is distributed internationally.
Although, if you look at the trend, over the last 5 years we've reduced our oil imports by 900 million barrels a year while increasing our oil production by 1.2 billion barrels a year. At current rate by 2016 we will be producing more than we are importing.
So while I would admit to embellishing the statement a little, I think your dramatization is a bit much.
-Rick
-
Re:Seems he has more of a clue
You seem to be the dumbest US citizen I have ever seen.
We buy most of our oil, from ourselves. The vast majority of the rest is bought from Mexico and Canada. The largest of the insignificant provider nations is Venezuela. The amount of oil we buy from countries that, "Do not like us", is insignificant.
This is so false on all dimensions it is hard to believe you even wrote that.
The USA are the biggest oil importing nation of the world.
Your own oil would not even last you 10 years
How can a person be so retarded?
http://www.eia.gov/dnav/pet/pe...Or simply google for "USA oil imports"
(*facepalm*)
-
Re:Seems he has more of a clue
We buy most of our oil, from ourselves. The vast majority of the rest is bought from Mexico and Canada. The largest of the insignificant provider nations is Venezuela. The amount of oil we buy from countries that, "Do not like us", is insignificant.
The major supplier is in fact Canada. Saudi Arabia and Mexico are essentially tied for second, followed by Venezuela, then countries like Ecuador, Colombia, and Russia. Imports from Canada and the Persian Gulf countries account for a little over half of our total imports.