 Slashdot Mirror
Domain: knoema.com
Stories and comments across the archive that link to knoema.com.
Comments · 19
-
Re:So why are some countries so successful at drop
Hmmm... US emissions are down, so we must be exporting it to Mexico? I guess that's why Mexico's emissions are also trending down. Couldn't be we've let that "evil invisible hand" of capitalism work, could it?
-
Re:China cant invent anything
Do you have some citation for China's per capita CO2 emissions?
While your right about all those Chinese adding up to number 1 in total, the figures I find put the US about #12 with twice the per capita emissions of China. Places like Qatar, Kuwait and Saudi Arabia are top per capita producers.
Most of what I find is a bit old, such as Wiki, https://en.wikipedia.org/wiki/... only going to 2011 though I don't think the US has dropped much since. This, https://knoema.com/atlas/China... claims 7.45 tonnes per capita for China while the latest for the US from Wiki, says about 16 tonnes per capita for the US -
Re:ReGuLaTiOn... read between the lines
CO2 is on a downward trend in Germany (at a much smaller per capita level than the US):
https://knoema.com/atlas/Germa...For 2017 to 2018 CO2 emissions decreased by 6%. https://www.ag-energiebilanzen...
Electricity prices also didn't really increase it seems:
https://www.energy-charts.de/t...Of course, residential electricity price are rather high.
https://www.statista.com/stati...But the renewable surchagre is onlyl part of this:
https://1-stromvergleich.com/p...It will go down in the future as it is mainly for old installations whose garantueed feed-in tariff will run out sooner or later while the cost of new wind and solar is much lower now. It is also important to understand that is was an intentional political decision to support renewables by a feed-in tariff which is paid directly from electricity prices. Coal and nuclear also got (and still get) a substantial amount subsidies but those are hidden in general taxes. Still, the high electricity price is a problem because it hits the poor, but one has to keep in mind that German households also consume much less electricity (due to better efficiency) than US households, so the overall energy bill is not as high as one might expect. Also the percentage of households who have trouble paying their electricity bills is still smaller than most of the rest of europe and certainly much smaller than in the US.
Finally, the exit from nuclear power had wide support in the German population:
https://www.unendlich-viel-ene...Having said all this, shutting down nuclear plants first instead of coal plans was clearly a mistake.
-
Why are you still lying about this?
America will very likely be below 10 before 2025, if not sooner
How? Following this data, even a continued linear trend extrapolated from the most favourable scenario of -0.35 per year would put the US at around 12 in 2025, with only falling under 10 in the 2030s.
Disregard the linear trend. That assumes that everything remains the same, which will NOT be the case.: 1) Nearly all of America's CO2 cuts has been caused by the killing of the coal plants and replacing with Nat Gas and Wind. That will likely continue in spite of Trump's push.
You idiot. you can't just say it's likely with no evidence whatsoever.
After declining by 0.9% in 2017, EIA forecasts that energy-related carbon dioxide (CO2) emissions will rise by 2.0% in 2018. The increase largely reflects higher natural gas consumption because of a colder winter and warmer summer than in 2017.
2) Because of the massive focus that America has had on cutting CO2 from electricity, that has dropped as %, while Transportation % has risen. That does not mean that emissions from transportation has risen, just the % of our output has.
You liar, I've already showed you before that transport is increasing. Not just as a percentage, but the level of CO2 is increasing as can be easily seen on the graph. Last time I showed you the t of CO2. Why still lie about it now?
3) Over the next 3-6 years, the west and china will be moving heavily to EVs. In America, Commercial and passenger vehicles are all moving to these. We have lots of new buses that are moving to EV with both BYD and Proterra. This is forcing other bus companies, even school buses to switch. Tesla producing a Semi truck that does 600 MPC is going to put a LOT of pressure on ICE version of semis. Delivery starts in less than a year. BYD is producing a Semi that gets less than 200 MPC, though lots of quality issues with. THis is leading to multiple other companies producing EV semis, as well as new ones. In addition, we have Rivian about to introduce both a pick-up truck and a 3 row SUV in 2020(to be shown in Nov at LA show) with more to follow afterwards. What does that mean? It means that by 2024, EVs will almost certainly occupy at least 1/2 of ALL road-based vehicle sales, if not more. The average passenger vehicle in America is around 11.5 years. Basically, ppl have been holding off on buying cars, which is why Ford decided to kill sedans here. Point is, come around 2020/1, lots of vehicles are going to be bought and I would guess that few will want an ICE. Ideally Rivian and Tesla will be able to convince most F1, F2, F3 buyers to switch.
Electrified vehicles continue to see slow growth and less use than conventional vehicles
-
Re: Alas, it won't get past the anti-nuke hysteric
America will very likely be below 10 before 2025, if not sooner
How? Following this data, even a continued linear trend extrapolated from the most favourable scenario of -0.35 per year would put the US at around 12 in 2025, with only falling under 10 in the 2030s.
Disregard the linear trend. That assumes that everything remains the same, which will NOT be the case.:
1) Nearly all of America's CO2 cuts has been caused by the killing of the coal plants and replacing with Nat Gas and Wind. That will likely continue in spite of Trump's push.
2) Because of the massive focus that America has had on cutting CO2 from electricity, that has dropped as %, while Transportation % has risen. That does not mean that emissions from transportation has risen, just the % of our output has.
3) Over the next 3-6 years, the west and china will be moving heavily to EVs. In America, Commercial and passenger vehicles are all moving to these.
We have lots of new buses that are moving to EV with both BYD and Proterra. This is forcing other bus companies, even school buses to switch.
Tesla producing a Semi truck that does 600 MPC is going to put a LOT of pressure on ICE version of semis. Delivery starts in less than a year.
BYD is producing a Semi that gets less than 200 MPC, though lots of quality issues with.
THis is leading to multiple other companies producing EV semis, as well as new ones.
In addition, we have Rivian about to introduce both a pick-up truck and a 3 row SUV in 2020(to be shown in Nov at LA show) with more to follow afterwards.
What does that mean? It means that by 2024, EVs will almost certainly occupy at least 1/2 of ALL road-based vehicle sales, if not more. The average passenger vehicle in America is around 11.5 years. Basically, ppl have been holding off on buying cars, which is why Ford decided to kill sedans here. Point is, come around 2020/1, lots of vehicles are going to be bought and I would guess that few will want an ICE. Ideally Rivian and Tesla will be able to convince most F1, F2, F3 buyers to switch. -
Re: Alas, it won't get past the anti-nuke hysteric
America will very likely be below 10 before 2025, if not sooner
How? Following this data, even a continued linear trend extrapolated from the most favourable scenario of -0.35 per year would put the US at around 12 in 2025, with only falling under 10 in the 2030s.
-
Why the lies Windy?
Thanks for the link Windy. It does show the dirty 3 (USA Canada Australia) are far above Germany and even further above China.
OOPS, But it also points out your favourite lie is a lie doesn't it. "My nation" (I Assume you mean China here), peaked in 2014 and is clearly not "continuing to add massive amounts".PS: I had to choose a country below 6 to show the impossibility. So you could fully understand the point Windy. Maybe you still failed to get it...
-
Re: Alas, it won't get past the anti-nuke hysteric
Germany went from 13.59 in 1970, down to 9.47 in 2016 (and has been flat/growing for the last 7 years). That is a 30% cut. America went from 21.74 in 1970, down to 15.56 in 2016 (and America went down again in 2017). That is a 28% cut. So, no, there really has not been much of a difference.
Most C02 cuts per capita in both countries were due to efficiency improvements, and not all is tied to electrical generation. The topic here is improvements in electrical generation emissions. Germany's per KWH generated CO2 emissions have not improved since they started adding solar and wind. In US, per KWh improvement have been mostly due to replacing coal generation with natural gas.
France has by far the lowest per KWh CO2 emissions due to high percentage of nuclear. They also have the lowest per capita CO2 emissions. -
Re: Alas, it won't get past the anti-nuke hysteric
Germany went from 13.59 in 1970, down to 9.47 in 2016 (and has been flat/growing for the last 7 years). That is a 30% cut.
America went from 21.74 in 1970, down to 15.56 in 2016 (and America went down again in 2017). That is a 28% cut.
So, no, there really has not been much of a difference. -
Re: Alas, it won't get past the anti-nuke hysteric
Actually, no. Both have gone down similar in %, and America has done more in actual numbers.
Since you love to normalize on a BS number, lets go with it.
Germany went from 13.59 in 1970, down to 9.47 in 2016 (and has been flat/growing for the last 7 years). That is a 30% cut.
America went from 21.74 in 1970, down to 15.56 in 2016 (and America went down again in 2017). That is a 28% cut.
So, no, there really has not been much of a difference.
And no, the average german household pays similar to the low-end of American areas. For example, I know that I pay a lot less than most Germans. Why? Because even though we have wilder climate than you do, I also insulated my home far more than what you do.
Where America is missing is we still have LOADS of old homes from pre WWII, which Europe does not. In addition, we have AC/various heating, rather than using geo-thermal HVAC. However, that is changing. We will see loads of changes coming to America. Not due to our president ( traitor ), but due to states pushing this. -
Re: Taxes and control
Let's check some more...
https://knoema.com/atlas/China...
And as China got richer the CO2 goes up...
Notice also that America, richer and higher than Germany, which is higher and richer than China, also higher and richer than India.
It's like there is some obvious pattern that Windy just refuses to see.
https://knoema.com/atlas/India...
India also goes up as it gets richer...still much lower though, because it's still much poorerIt's almost as if developing countries increase their CO2 levels up towards rich country levels, as their economies develop and the people become richer.
Can't have those poor people being like you though can we. It's bad for the environment. -
Re: Taxes and control
-
Re: Taxes and control
-
Slow, but real [Re: Runaway effect? Nope.]
Look, stop waving your hands and read the literature. The "basic physics" model is described by Manabe and Wetherald (1967), a widely accepted and respected paper. It models both water and carbon dioxide and calculates that every doubling of carbon in the atmosphere leads to a 2C increase in global average temperatures, i.e., a logarithmic dependence.
Right. That logarithmic dependence is what the earlier comments in this thread labelled "saturation". The effect doesn't actually saturate, but additional increases have very much less effect per amount added (2.4 degrees C per doubling, for the constant-humidity model of Manabe and Wetherald, turns out to be within the error bars of the current IPCC "best estimate" of 3 plus or minus 1.5 degrees C per doubling. Remarkably good job by Manabe and Wetherald over fifty years ago!)
It's consistent with measurements so far. When you extrapolate that to 1000 ppm, that means a temperature increase of about 2.6C. Of course, 1000 ppm is not realistically achievable even if we wanted to reach it. I believe there is 3x10^12 t of CO2 in the atmosphere
Looks about right.
and about 1x10^12 t of known fossil fuel reserves (not all of them recoverable;
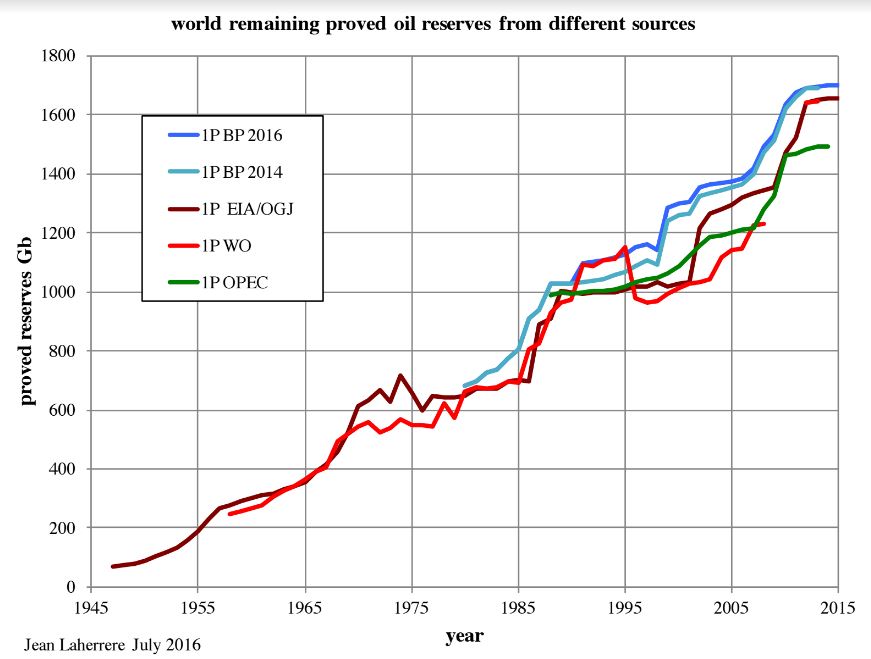
Right on the number, wrong on the "not all of them recoverable". That number is the "proven reserves" of coal. Proven reserves are by definition extractable with today's technology; if they weren't believed to be extractable, they wouldn't be counted as reserves. (oil and natural gas add some to that, but not all that much-- there's a lot more coal known than oil and natural gas. Here's a link. https://knoema.com/smsfgud/bp-...)
The wild card, however, is that proven reserves refers to coal that's already been found and geologically mapped. (That's the "proven" part).
Here's a start, though, for an estimate of how much fossil fuel there is that we haven't found and mapped, if you like basic physics. According to what we know about planetary atmospheres, all of the oxygen in the Earth's atmosphere was produce by reduction of carbon dioxide. So, somewhere below the surface or sequestered in biomass, there's enough carbon to convert all of the oxygen in the atmosphere back into carbon dioxide.
I leave it to you to convert carbon to CO2).
multiply by 44/12. Carbon dioxide is 27% carbon by mass.
So, that's what basic physics tells us: if we even could burn all of our fossil fuels, global average temperatures would go up maybe 2.6C,
Again: all of the proven reserves. The amount of proven reserves increases as more geological prospecting is done. (Here's a nice graph of how the proven oil reserves changs with time: http://peakoilbarrel.com/wp-co... . Coal has a much shallower slope, though, since coal is less valuable than oil.)
and most of that increase occurs at high latitudes.
Careful there. That number is average over the surface. What you mean to say is "with more increase at high latitudes".
Pardon me for not panicking.
Panicking is unnecessary. It is nice, however, to understand the basic science.
You're welcome to propose more complex models, but if you assert that people should believe those more complex models because they are "basic physics", you are misrepresenting them.
No, more complex models give you some error bars, but the basic constant-humidity model is pretty close to the current best guess.
You're misattributing decreases in carbon emission growth to governmen
-
Re:Job Creation
More than a hundred of countries have greater economic dependency on tourism than the US. Those that are at the top are much more dependent on tourism, and therefore logically more interested in keeping it.
-
Re:19th and 20th century powerhouse
I have to take you up on one of your points; Coal is still absolutely abundant in the UK and by no measure exhausted. Worth a look: https://knoema.com/smsfgud/bp-... PS I'm not a proponent of fossil fuels by any stretch...
-
Re:Wait until they start making a bit of money
Not to mention that the wealth of a nation lies in the general public.
It does not. Half the world' wealth is held by the top 1% of individuals PBS
There are 120 nations with less wealth each than Bill Gates alone Knoema
400 Americans have more wealth than half of all other Americans PolitiFact
If you look at the detail of those 400 richest Americans you find that a small percentage of those have more than all the rest of the 400.
Getting the picture? -
Re:Then Leave
I won't comment on value, but rather just inject some harder numbers into this debate:
OECD National Accounts at a Glance, 2012
http://knoema.com/OECDNA2012France taxes at a rate of (roughly) 51% of GDP and spends at 56%
The USA taxes at 32% and spends at 42% (2010 accounts)
UK: taxes at 40% and spends at 49%
Germany: taxes at 44% and spends at 45%
Korea: taxes at 31% and spends at 30%France is something of a world-leader when it comes to both taxing and spending, especially least among developed nations. The USA is a big world-leader when it comes to government living outside its means.