 Slashdot Mirror
Domain: nasa.gov
Stories and comments across the archive that link to nasa.gov.
Comments · 16,365
-
NASA Langley
Drop testing with the same gantry they've used since the 60's and Apollo. http://www.nasa.gov/centers/langley/news/factsheets/fs-2007-08-138-larc.html
Now named a National Historic Landmark. -
Re:More info
Ice is fairly transparent to certain frequencies of radio waves, as are most materials to varying degrees. Why do you think that wifi and cellphone signals can travel through walls? For conventional radar use in the atmosphere (say, for tracking planes) you're only interested in the "hard" returns/reflections from the very first interface between the air and some other material, but nothing stops you from continuing to record radio signals after the first reflection to see if there are any reflections from "deeper" interfaces further away. The same techniques can be used to actively scan through walls, or in this case through kilometres of glacial ice to see the reflection off bedrock. Ice is transparent enough that you can see a long way down, and the contrast between ice and bedrock is strong, so it shows up well. The same technique can be used on ordinary ground (ground penetrating radar), but the depths aren't as good due to greater attenuation in typical ground materials rather than ice, especially if liquid water or other conductive material is present. In mathematical principle it's a similar technique as is used for medical ultrasound images or seismic images except that instead of using sound waves you are using radio waves, and the reflections therefore come back a LOT faster (close to the speed of light).
You want to know something *really* cool? You can even do it from orbit, around another planet.
-
Who Missed The Climate Change Memo?
It appears some people still haven't read the climate change memo. Global warming debunked: NASA report verifies carbon dioxide actually cools atmosphere
Practically everything you have been told by the mainstream scientific community and the media about the alleged detriments of greenhouse gases, and particularly carbon dioxide, appears to be false, according to new data compiled by NASA's Langley Research Center. As it turns out, all those atmospheric greenhouse gases that Al Gore and all the other global warming hoaxers have long claimed are overheating and destroying our planet are actually cooling it, based on the latest evidence.
As reported by Principia Scientific International (PSI), Martin Mlynczak and his colleagues over at NASA tracked infrared emissions from the earth's upper atmosphere during and following a recent solar storm that took place between March 8-10. What they found was that the vast majority of energy released from the sun during this immense coronal mass ejection (CME) was reflected back up into space rather than deposited into earth's lower atmosphere.
The result was an overall cooling effect that completely contradicts claims made by NASA's own climatology division that greenhouse gases are a cause of global warming. As illustrated by data collected using Sounding of the Atmosphere using Broadband Emission Radiometry (SABER), both carbon dioxide (CO2) and nitric oxide (NO), which are abundant in the earth's upper atmosphere, greenhouse gases reflect heating energy rather than absorb it.
"Carbon dioxide and nitric oxide are natural thermostats," says James Russell from Hampton University, who was one of the lead investigators for the groundbreaking SABER study. "When the upper atmosphere (or 'thermosphere') heats up, these molecules try as hard as they can to shed that heat back into space."
Almost all 'heating' radiation generated by sun is blocked from entering lower atmosphere by CO2
According to the data, up to 95 percent of solar radiation is literally bounced back into space by both CO2 and NO in the upper atmosphere. Without these necessary elements, in other words, the earth would be capable of absorbing potentially devastating amounts of solar energy that would truly melt the polar ice caps and destroy the planet.
"The shock revelation starkly contradicts the core proposition of the so-called greenhouse gas theory which claims that more CO2 means more warming for our planet," write H. Schreuder and J. O'Sullivan for PSI. "[T]his compelling new NASA data disproves that notion and is a huge embarrassment for NASA's chief climatologist, Dr. James Hansen and his team over at NASA's GISS."
Dr. Hansen, of course, is an outspoken global warming activist who helped spark man-made climate change hysteria in the U.S. back in 1988. Just after the release of the new SABER study, however, Dr. Hansen conveniently retired from his career as a climatologist at NASA, and reportedly now plans to spend his time "on science," and on "drawing attention to [its] implications for young people."
Sources for this article include: Be sure to read this one... http://principia-scientific.org/ http://science.nasa.gov/science-news/science-at-nasa/2012/22mar_saber/
-
Re:That 97% again...
http://climate.nasa.gov/scientific-consensus
Ninety-seven percent of climate scientists agree that climate-warming trends over the past century are very likely due to human activities
-
NASA has a website
and NASA is apparently an app, not an aerospace agency
NASA is an aerospace agency, but it's also the website of the aerospace agency. That and the Toki Pona word for crazy or foolish.
-
Real NASA Data
It's excellent to see the NASA data about the surface of Mars being used to model the terrain for a game. I'm personally a big fan of software that gamifies real data. NASA itself has "Eyes on the Solar System which is an open world flythrough of the solar system with accurate 3D models and telemetry for satellites, planets, moons asteroids and exoplanets.
Disclaimer: I work on the NASA software.
-
Re:Two peas in a pod
A Category Five hurricane, the strongest class on Earth, has winds raging at more than 155 miles per hour, and they usually max out around 200 miles per hour. Jupiter's Little Red Spot could blow them away with winds of about 384 miles per hour, some of the highest wind speeds ever detected on any planet. Nearly the size of Earth, the Little Red Spot (LRS) could easily consume the largest terrestrial hurricane.
-
Re:The rest of the criticism remains valid
I just came across this animation of world-wide weather-station measured temperatures from 1880 to the present. I know it's only 130 years, but unless one can prove a bias in early hand-made thermometers, it seems to show a hockey stick.
-
Re:Makes Perfect Sense...
Why use a multibillion dollar tried and tested launch facility, like the ones in Florida and Califorinia, when you can build a new one in a poor location?
Dude, they've been lighting off the big fireworks from Wallops since 1945.
-
Re:You can see this from a distance
-
LADEE Launch Visibility
For those of you on the east coast of the US.
-
Re:You have to wonder how much that atmosphere...
Even though there's a thin atmosphere on the Moon it is constantly hammered by Solar Heating and the Solar Winds. It's really an exosphere rather than an atmosphere. I doubt any dust raised by impacts would last there very long at all but also remember that it's constantly pelted by all kinds of cosmic detritus hence all the craters so it would be difficult to discern if any debris co-mingling with the gases was man-made or a natural occurrence.
-
Re:Uhm... why?
Wallops Island is where the US rocket program started.
-
Re:Good work Dr Hobbs!
When you've located a person with that name, here is a link to Warp Field Mechanics 101, by NASA:
http://ntrs.nasa.gov/archive/nasa/casi.ntrs.nasa.gov/20110015936_2011016932.pdf -
Re:My god, what has science wrought???
Mankins worked on some of this earlier when he was at NASA; I seem to recall he was even paid to write up a study. I expect it would be easy enough to find out at least ballpark figure. Or you could ask him, or visit the website. A start:
http://www.nasa.gov/pdf/716070main_Mankins_2011_PhI_SPS_Alpha.pdf
The NASA grant was NNX11AR34G; I don't know offhand how one would find out how much that cost taxpayers.
A related bit, from http://useconomy.about.com/od/usfederalbudget/p/nasa_budget_cost.htm
"A 2002 study by Professor H.R. Hertzfeld of George Washington University showed there is a large return to the companies work with NASA on its research contracts. These companies are able to commercialize the products developed and market them. The 15 companies studied received $1.5 billion in benefits from a NASA R&D investment of $64 million."
The link for the 2002 study is http://www.ncbi.nlm.nih.gov/pubmed/14983842
I didn't look to see how one would get the full report. Further, this relates just to life sciences tech transfer.From the same site,
"A report by the Space Foundation estimated that NASA contributed $180 billion to the economy in 2005. More than 60% of this came from commercial goods and services created by companies related from space techonology. This means that each dollar of NASA spending creates $10 of benefit in the economy. NASA spending created the satellite communications which allows not only radio and television, but also telemedicine, GPS navigation, weather forecasts, and defense."
The link given goes here, to a press release (and not to the mentioned one from the Space Foundation),
For the pdf of Griffin's speech,
http://www.nasa.gov/pdf/189537main_mg_space_economy_20070917.pdf
One may object that Griffin as then-head of NASA was tooting his own horn but there's no automatic reason to doubt the figures or conclusions - there are plenty of people who spend time looking for errors and outright lies, especially from NASA.
-
Re:Huh?
A modest suggestion - whenever you feel like someone has made a basic math error in their own field, or doesn't know basic facts about the technology in their own field, and they are a high-level professional in that field, say, a mission manager talking to the press, and you are not, you should consider the possibility that you might be the one who is mistaken.
OTOH, the Terra press kit distributed by NASA includes the following statement:
The science data recorded onboard will be transmitted via Kuband at 150 Megabits per second.
-
Re:Ocean, the next frontier
Living under the sea has been tried 50 years ago already. The problems are pressure, damp, mold, rust and barnacles. NASA still has a deep water habitat: http://gcmd.nasa.gov/records/GCMD_dgomb.html
-
Re:Why a suit at all?
Another solution might be a force field to stop radiation and a method to trap air around a person like some ants do when going underwater. We can in theory also do wireless power transfer, so maybe this could provide the juice to keep a system like this going on a backpack like device you could use in space, Mars, titan, or any other sufficiently low g environment that you could move on. Wonder why sci-fi doesn't do this much?
-
Re:Read NASA's "Dressing for Altitude"
An excellent historical perspective (with plenty of photos) on the development of pressure suits for both aviation and space use.
http://www.nasa.gov/connect/ebooks/dress_for_altitude_detail.html
Yes, this is hard to do.
An awesome ebook that really details what the big problems are with spacesuits, or a pressure suit, really.
It's mobility - and it's not mobility while deflated (when you see those photos of early astronauts playing golf or baseball), but when inflated.
So much technology has been used in controlling ballooning, ensuring the helmet doesn't rise above your eyes, trying to get breathing air to where you want it, and also trying to minimize extra exertion because the suit wants to conform to the shape in which it was sewn, so every deviation costs energy.
And how trying to get zippers to seal right, or bearings that roll without leaking too much air (very hard problem), etc. etc.
It's easy to make an airtight suit. You can make one easily at home using stuff you probably already have. But make one that can keep you from sweating excessively or getting cold extremities, to allow you to move as free as possible when inflated 3-5psi above ambient, takes a lot of work.
And the first attempts were basically practically iron-maiden like devices - when deflated they were hot and uncomfortable. When inflated they were stiff and inflexible.
-
Read NASA's "Dressing for Altitude"
An excellent historical perspective (with plenty of photos) on the development of pressure suits for both aviation and space use.
http://www.nasa.gov/connect/ebooks/dress_for_altitude_detail.html
Yes, this is hard to do.
-
Re:I got him beat
If we use a linear best fit:
Cat "11" - winds in excess of 439 km/hour. Unless you're Superman, flying is probably not recommended.
Cat "12+" - the highest wind speeds ever recorded on Earth occur in tornadoes; doppler radar has measured speeds exceeding 500km/hr in the tornado's trunk (speeds at the tornado's base are difficult to measure due to its tendency to destroy the instruments).
Cat "16" - the highest wind speeds ever recorded on a planetary body clock in at 620 km/hour, in Jupiter's "Little Red Storm" (well, as of 2008 anyway, there's probably more recent data somewhere).
Cat "35" - the speed of sound at Earth's current sea level - Mach 1 - is roughly 1225 km/hour at Standard Sea Level conditions.
Cat "64" - winds in excess of 2136 km/h.
Cat "One Million" - the highest "wind" speeds recorded (so far) in the universe clock in at about three percent of the speed of light: http://www.nasa.gov/mission_pages/chandra/multimedia/igr.html
-
Re:What to do? Some science, please.
NASA does not agree with you. They seem to believe that water vapor is a "major player in climate change".
-
Re:Ready...Set....
In fact, natural events like volcanic eruptions gave us a rest, we should been far worse by now.
Regarding being expensive, put it this way, the rich responsible of this (and that influence government) will keep living comfortably, even if thing go wrong badly, so, why slow down the income? "After me, the deluge", is the motto for them, and probably will be accurate for most of the populated world if sea rises enough. And if they still live and things are becoming not comfortable here, they always can invest in Elysium instead of fixing what they broke.
-
Re:Reliance on magnetic fields?
You better let Nasa know that then Geenyus
-
Thrust vector control
We used to call it "thrust vector control". I worked in the Morton-Thiokol TVC lab for a while. The video shows a really excellent example of the technique, which is not new or controversial.
You can do TVC with hydraulics (heavy, but parts are easy to source and last longer) but you'll get better impulse numbers for the vehicle as a whole if you can divert some proportion of the pressure from the combustion chamber into mechanical actuators that change the direction the nozzles are physically pointing. With multi-nozzled rocket motors (regardless of whether they have multiple combustion chambers or not) you can point some thrust down and some to the side (which appears to be happening in the video) and get this kind of behavior.
Similar things can be done with moving vanes in the exhaust plume, but those will erode even faster than the mechanism described above, and will be far slower to change the thrust vector. Erosion of parts that have high pressure hot gasses flowing through them is a huge issue in rocketry, although fairly well understood at this point. External aerodynamic vanes like the space shuttle's wings will obviously work too, and won't erode much (during liftoff) but they are also slow and clumsy.
When I say the technique's not new, I do not mean to denigrate the achievement. I can confidently state that it's really, really hard to do it as well as is being shown in this video. I would love to be able to work with these guys, because they are clearly just full of the right stuff.
Another alternative system to TVC is separately fueled ACMs - Attitude Control Motors - such as vernier thrusters or the solid fuel ACMs on hypersonic crusie missiles. When you use gimballed nozzles to achieve TVC, though, you can potentially have the entire force of the main thrusters available for attitude control, and the fuel delivery system can be much more concentrated and simple.
Graphical overview of the common methods of TVC here
-
Re:Yes, it is impractical
TL;DR: Heat shields aren't going away because they are efficient.
And the rocket equation is not. People need to be aware what they are looking at in these videos. This is not a spacecraft coming back to the Earth to land after it did some awesome mission. It is a depleted lower stage of a rocket, where the upper stage(s) has separated and continued on. Now the light lower stage has just enough fuel to fly home (because it is so light after burning up most of its fuel). It is a really, really clever idea for reusable lower stages. But it does not allow rockets to reenter the Earth's atmosphere at orbital velocities, slow down, and land. A phrase scientists and engineers use when they talk about the rocket equation is tyranny. Tyranny is right. It took a rocket the size of a skyscraper and weighing as much as a diesel submarine to go to the Moon and back. Without the heat shield, the rocket would have to be the size of an aircraft carrier.
-
Re:Are they confused?
Do they mean orbit (around the Sun) or revolution (around the Earth's axis)? I know the Earth's revolution has changed quite a bit in the past, but I thought the orbit was pretty stable. The use of the term "wobble" also leads me to believe they are talking about the revolution of the Earth, and not it's orbit.
Trying to decipher what was happening in both the summary and the article was difficult for myself. The lack of clarity seems to be due to the article's informal explanation; their not being concerned about the accepted definitions of the terms they were using. I don't know if it was laziness or confusion on their part or my understanding about present day astronomy.
The original article in Nature probably does a better job.
Although I haven't seen the Nature article (due to the payed wall), I suspect it's about, or related to, observations by Milutin Milankovitch, his understanding of orbital variations and the resulting climate theory explaining how the very long term cycles interact and affect the climate in major ways.
The theory, in excruciating mathematical detail, points out positions, cycles and temperature correlations over the past 600,000 years occurring between axial obliquity, axial precession and orbital precession caused by the eccentricity of the Earth's elliptical orbit. Interesting stuff in itself, even if it turns out to not be related to the Nature article.
Because of many successful correlations, including with deep sea sediment cores, Milankovitch theory has been accepted by the U.S. National Academy of Sciences.
-
Re:Dog and cats! Living together! Mass hysteria!!!
It appears a slight change in the planetâ(TM)s surface luster has caused its temperature to rise.
Earth CO2 has nothing to do with it. There is no mechanism in play to cause both.
-
Re:they said they did
They discarded 15% of the days because they clearly didn't fit. Why would they include some clearly anomalous readings, or exclude some clearly normal readings? And what would happen even if they included them? The graph would get noisier, but the trend would be the same. (*)
Look at the graphs:
http://earthobservatory.nasa.gov/blogs/climateqa/mauna-loa-co2-record/
It's pretty easy to see which days are affected by volcanic CO2 increases.
These periods of elevated and variable CO2 levels are so different from the typical measurements that is easy to remove them from the final data set using a simple mathematical “filter.”
But you think there is an amazing conspiracy. This tells us more about what's going on in your head than what's going on in the atmosphere.
((*) Note that the readings are only discarded in the sense that they are not included in this series, they don't actualy throw the readings away - the "discarded" readings have been used for other research, for example into how volcanic C02 mixes with the atmosphere).
-
Re: on a volcano spewing CO2Science and political advocacy, which is what you're really about, are incompatible. I suggest you stick to trolling "Skeptical Science" and other political websites to get your kicks.
Whilst I'm at it:A new NASA study shows that from 1978 to 2010 the total extent of sea ice surrounding Antarctica in the Southern Ocean grew by roughly 6,600 square miles every year, an area larger than the state of Connecticut. And previous research by the same authors indicates that this rate of increase has recently accelerated, up from an average rate of almost 4,300 square miles per year from 1978 to 2006.
Fascinating. I'm sure you'll explain that away as some kind of warming induced cooling, or other moronic hypothesis to keep your failing thesis alive. Please note that the last paper I read about Antarctic temperatures was by Steig et al. It got pole position in Nature (front cover too) but was shown to be complete and utter bollocks soon afterwards by O'Donnell et al. Of course as is normal in Climate Science, it wasn't retracted despite being shown to be rubbish. And you probably won't read about it on the euphemistically named Skeptical Science website.
-
Re:on a volcano spewing CO2
or this one
http://earthobservatory.nasa.gov/blogs/climateqa/mauna-loa-co2-record/>Most of the time, the observatory experiences “baseline” conditions and measures clean air which has been over the Pacific Ocean for days or weeks. We know this because the CO2 analyzer usually gives a very steady reading which varies by less than 3/10 of a part per million (ppm) from hour to hour. These are the conditions we use to calculate the monthly averages that go into the famous 50-year graph of atmospheric CO2 concentration.
We only detect volcanic CO2 from the Mauna Loa summit late at night at times when the regional winds are light and southerly. Under these conditions, a temperature inversion forms above the ground, and the volcanic emissions are trapped near the surface and travel down our side of the mountain slope. When the volcanic emissions arrive at the observatory, the CO2 analyzer readings increase by several parts per million, and the measured amounts become highly variable for periods of several minutes to a few hours. In the last decade, this has occurred on about 15% of nights between midnight and 6 a.m.
-
Re:Please stop supporting the CSM
If Nasa.gov is broadcasting it why not watch it there
http://www.nasa.gov/connect/chat/perseids_2013.htmlIf you go to the " Go the the Marshall Space Flight Center Ustream channel" link there's (obnoxious) music being played; had a lot
of links opened and took awhile to find where it was coming from. -
Re:Please stop supporting the CSM
If Nasa.gov is broadcasting it why not watch it there
http://www.nasa.gov/connect/chat/perseids_2013.html -
Re:Dog and cats! Living together! Mass hysteria!!!
Not fifteen years. About 8 years (since 2006).
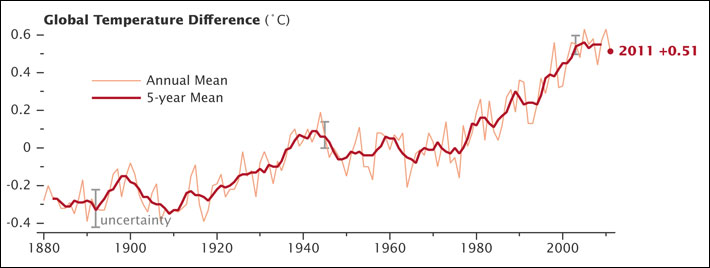
http://climate.nasa.gov/images/616910main_gisstemp_2011_graph_lrg.jpg
There was a peak in about 2005, then temperatures fell down until 2001 when they had a similar temperature high (not a new high).
It was actually surpassed by 2010, which was apparently the hottest on record according to the same dataset from NASA used for that graph. Given the 2013 data isn't in yet, we're talking 2 years, not 15. The 5 year average high point is still centred on 2005.
I dislike many of these graphs because they are scaled to make the increase look very dramatic. Convincing people of the reality of global warming is as much political as scientific so I suppose such tricks are necessary.
That is true in one way, but the graphs can also be misleading in the other direction as well. Many people will look at the temperature scale and think, "Oh, thats just 0.7C in 130 years, nothing to worry about". These are only graphing surface air temperatures. They do not include the fact that the ocean (1.3 billion cubic kilometers of water!) is also heating up, albeit more slowly for most of it than at the surface. And there is ice melting at the poles: the latent energy it takes to melt ice into water is the same amount it takes to heat the same mass of liquid water from 0 to 100 degrees C. These are massive heat sinks, but still of finite capacity, and slowly filling up/disappearing. The actual amount of energy retention change in our climate is in fact under-represented by an analysis of the surface air temperature.
-
Re:Dog and cats! Living together! Mass hysteria!!!
Not fifteen years. About 8 years (since 2006).
http://climate.nasa.gov/images/616910main_gisstemp_2011_graph_lrg.jpg
There was a peak in about 2005, then temperatures fell down until 2001 when they had a similar temperature high (not a new high).
It was actually surpassed by 2010, which was apparently the hottest on record according to the same dataset from NASA used for that graph. Given the 2013 data isn't in yet, we're talking 2 years, not 15. The 5 year average high point is still centred on 2005.
I dislike many of these graphs because they are scaled to make the increase look very dramatic. Convincing people of the reality of global warming is as much political as scientific so I suppose such tricks are necessary.
That is true in one way, but the graphs can also be misleading in the other direction as well. Many people will look at the temperature scale and think, "Oh, thats just 0.7C in 130 years, nothing to worry about". These are only graphing surface air temperatures. They do not include the fact that the ocean (1.3 billion cubic kilometers of water!) is also heating up, albeit more slowly for most of it than at the surface. And there is ice melting at the poles: the latent energy it takes to melt ice into water is the same amount it takes to heat the same mass of liquid water from 0 to 100 degrees C. These are massive heat sinks, but still of finite capacity, and slowly filling up/disappearing. The actual amount of energy retention change in our climate is in fact under-represented by an analysis of the surface air temperature.
-
Re:Dog and cats! Living together! Mass hysteria!!!
And then you can compare the butterfly diagrams posted by the parent to the surface temperature readings from the last 130 years. The Earth is undergoing significant climate change.
I wouldn't blame the GP entirely though. Scientists are so bad at actually relaying information to regular folks that it partially ends up in the domain of moneyed cranks that can afford to pay for good animations and pseudo-documentaries. Also, it doesn't help that many of the politicians and influential business people are old and don't care what happens in 50 years time.
-
Re:Dog and cats! Living together! Mass hysteria!!!
http://www.ncdc.noaa.gov/sotc/service/global/global-land-ocean-mntp-anom/201101-201112.png
So these guys must be oil shills too? Or do you disagree with that the blue line has any significance after about year 2000? Do you chant to the mirror or something?
A graph with poor granularity. How about a look at the raw data?
-
Re:Dog and cats! Living together! Mass hysteria!!!
Not fifteen years. About 8 years (since 2006).
http://climate.nasa.gov/images/616910main_gisstemp_2011_graph_lrg.jpg
There was a peak in about 2005, then temperatures fell down until 2001 when they had a similar temperature high (not a new high).
The five year mean temperature increased about
I dislike many of these graphs because they are scaled to make the increase look very dramatic. Convincing people of the reality of global warming is as much political as scientific so I suppose such tricks are necessary.
Anti global warming folks do the reverse and set the scale such that the fluctuation looks meaningless.
Ice remains at freezing a long time but eventually it does melt.
Fundamental problem is TOO MANY PEOPLE.
And we are not going to address that so the rest is just pointless.
-
Re:Dog and cats! Living together! Mass hysteria!!!
Nasa http://solarscience.msfc.nasa.gov/SunspotCycle.shtml
But don't let real science get in the way of your research via Wikipedia.And don't let real science get in the way of your misconceptions, either. The nature of the link between solar cycles and climate is largely unknown, and is a topic of ongoing research (as you would have gleaned by actually reading the article you linked to). Variation in solar output is a bit more complex than merely noting the range of sunspot numbers or coverage of the solar disk over a cycle. The total output varies by less than 0.1% over a cycle, but its spectral content also varies.
If one were to give your "theory" any credence, then the world must have been cooling for the last half century, as solar cycle 19 was more intense than any since then. FYI, here are the butterfly diagrams for the last century or so of solar cycles.
-
Irrelevant data
Could you give a citation for that "lowered solar output?" Because wikipedia disagrees with you.
Nasa http://solarscience.msfc.nasa.gov/SunspotCycle.shtml
(And just so you dont have to read that long complicated article here is a link to a nice picture)
http://solarscience.msfc.nasa.gov/images/ssn_predict_l.gifThat is a graph of sunspot number. The question was about "lowered solar output."
This is amazingly typical of internet arguments, especially by the greenhouse-effect denying community. When asked to show data supporting their assertion, they show something else entirely, but since it's a graph with numbers and such, it looks scientific. It's a win-win argument for the deniers: readers who aren't familar with the field say "oh, they have data: they must be right." And for people who do understand that the data is irrelevant, in the worst case, it sidetracks the argument onto a completely irrelevant discussion of what the connection between sunspot number is to solar output.
This data addresses your argument.
-
Re:Dog and cats! Living together! Mass hysteria!!!
Nasa http://solarscience.msfc.nasa.gov/SunspotCycle.shtml
(And just so you dont have to read that long complicated article here is a link to a nice picture)
http://solarscience.msfc.nasa.gov/images/ssn_predict_l.gifBut don't let real science get in the way of your research via Wikipedia.
-
Re:What patents?
Tell that to the holder of the 10 patents for the Hilbert-Huang Transform (8th paragraph).
- T
-
Re:3% velocity
Probably just that this is a friggen PROTOTYPE (FTS), indicating that they WILL build a deadly version of this. Shit, who the fuck doesn't understand how "progress" works?
I'm pretty sure our first ICBM prototype wasn't a water-pump model with a warhead on the top of it.
Apples and oranges - an ICBM is based on long existing and well-vetted technology rocket-based weapons technology; it's more akin to the not-yet-existing "deadly version" mentioned by OP than the prototype. Even the "first ICBM prototype" was based on pretty well known, time tested stuff.
You'd be more accurate if you compared this prototype to, say, Goddard's rockets from the early 20th Century.
-
Feb. 2001 called, it wants its Armageddon back
For those of you too young to remember, it happened before and it will happen again.