 Slashdot Mirror
Domain: nasa.gov
Stories and comments across the archive that link to nasa.gov.
Comments · 16,365
-
Why pick such a bad article?
Instead of going to some half-assed article from networkworld, why aren't we linking to the actual NASA WISE site? Original sources, people. It's not that hard.
-
Re:Bathing?
No. It is a passive device, as you suspect.
However, TFS can’t be entirely blamed for this mistake. It was copied and pasted directly from TFS.
Better article – from the horse’s mouth, as it were. Some interesting tibits:
Because the instrument sees the infrared, or heat, signatures of objects, it must be kept at chilly temperatures. Its coldest detectors are less than minus 447 degrees Fahrenheit.
"WISE needs to be colder than the objects it's observing," said Ned Wright of UCLA, the mission's principal investigator. "Now we're ready to see the infrared glow from hundreds of thousands of asteroids, and hundreds of millions of stars and galaxies."
WISE will see the infrared colors of the whole sky with sensitivity and resolution far better than the last infrared sky survey, performed 26 years ago. The space telescope will spend nine months scanning the sky once, then one-half the sky a second time. The primary mission will end when WISE's frozen hydrogen runs out, about 10 months after launch.
Just about everything in the universe glows in infrared, which means the mission will catalog a variety of astronomical targets. Near-Earth asteroids, stars, planet-forming disks and distant galaxies all will be easy for the mission to see. Hundreds of millions of objects will populate the WISE atlas, providing astronomers and other space missions, such as NASA's planned James Webb Space Telescope, with a long-lasting infrared roadmap.
-
Re:re Time for open discussion
"The weather exhibits chaotic behavior
And climate doesn't What's the Difference Between Weather and Climate?"The Earth has been getting warmer [wikipedia.org] since about 10,000 years ago....."
Let's take a look at the Holocene Temperature Variations -
Re:Oink! Oink!
If I recall correctly, Jerry Pournelle estimated that the energy requirement to get mass into orbit is similar to the energy requirement to fly the mass around the world twice. But as you noted, the shuttle takes a whole lot of fuel. What's up with that?
First, let me rant for a moment. The major cost of the space shuttle is not in fact fuel, but the cost of all the man-hours of service required. A 747 can land, unload passengers and luggage, load fuel, more passengers and more luggage, and take off again. A 747 spends much more time flying than being maintained. The shuttle, on the other hand, requires a standing army of 10,000 people to service it, with months of labor-intensive work to prep for the next flight. Henry Spencer observed that it takes over a million signatures to launch a shuttle flight: as in, run down the checklist, doing the observations/maintenance/whatever, then sign that the checklist is done, times a million.
Okay, back to fuel costs. Let's compare the biggest version of the 747 and the shuttle:
http://en.wikipedia.org/wiki/Boeing_747-8
http://en.wikipedia.org/wiki/Space_Shuttle
Empty and unfueled, the 747-8 is 214,500 kg. It can carry somewhere around 240,000 liters of fuel (the only exact number in the article is for a passenger version of the 747). The maximum liftoff weight is 442,000 kg. The maximum zero-fuel weight is given as 291,000 kg, so the maximum cargo weight possible is 76,500 kg. If you load max cargo and fuel it up to just under maximum liftoff weight (let's say 185,000 liters of fuel) you have a payload mass fraction of 76,500 kg / (442,000 - 76,500) kg == 0.209 or 20.9 percent.
The gross liftoff weight of the shuttle is given as 2,000,000 kg (obviously a rounded-off number). The payload to orbit is 25,060 kg. The payload mass fraction is 25,060 kg / (2,000,000 - 25,060) kg == 0.0127 or 1.27 percent.
In short, the shuttle is freaking huge and freaking heavy, which is why it needs a freaking giant load of fuel to get to orbit and back. You need the fuel to carry the payload, plus the fuel to carry all the other stuff, plus the fuel to carry the fuel off the ground. (And the fuel to carry the fuel to carry the fuel... it does end up as a finite amount of fuel, but I guess you need calculus to calculate how much it would be.)
You could win big if you had a small, one-piece vehicle that could carry a small payload (say, 1,000 kg) into orbit and not need man-centuries of labor to overhaul it between flights. It's important for cheap operations that pieces not fall off during flight, needing to be replaced (or recovered and refurbished). Such a vehicle could theoretically routinely fly into orbit with fuel costs dominating, just as fuel costs dominate aircraft flights. This is the "space pickup truck" often mentioned in space discussions.
Also, for supplies like dried food that can handle horrible accelerations, theoretically you could build a super-cannon that would launch a capsule into orbit. It turns out that the capsule would need to have onboard engines that would fire and alter the trajectory, causing the capsule to stay in orbit instead of returning to the ground; there is no trajactory at which you can fire an inert payload such that it stays in orbit and doesn't return to hit the ground. But if you could make such a cannon and capsule, that ought to be the cheapest way to use fuel to put things into orbit. (I mean cheapest operationally; I'm not estimating R&D costs, or the costs of building the cannon. And if you could build a "space elevator" that should be the cheapest way to put things into orbit, short of new physics such as teleportation.)
http://www-istp.gsfc.nasa.gov/stargaze/SSHARP.htm
And by the way, I'm not a physics expert, so double check me before you trust me; corrections gladly accepted if I screwed anything up.
steveha
-
Re:And that's bad how?
Source code for the GISS ModelE general circulation model are available here. If you look around the site you can find data too. Knock yourself out.
-
Re:Modern-Day Galileo
So your economic concerns trumps the science? Global warming can't be right because it will cost you too much? Now we're getting to the bottom of it!
You're electric bill going up >50% is hyperbole. Estimates for the cap&trade bill say it will cost perhaps $10 a month for the average family. That cost would be spread over not only your electric bill but the cost of other things as well.
When you ask scientists in the field what the number for CO2 emissions should be they say "The correct number is zero" so it's worse than you thought. It'll take us 30 or 40 years to get there though.
The data you're so worried about is but a small and relatively inconsequential piece of the totality of climate science. If you want the code and data for the GISS you can find it here. You'll need a big computer to run it though. Links to other sources of raw and processed data and climate model source code can be found here.
-
Re:These "scientists" weren't
Uhh, please check your facts. There are several proxy records available, such as stalactites, bore holes, ice cores and lake sediments. Tree rings are just one part of paleoclimate observational data. Global temperature records are available from 1850 onwards (from 1880 if you only include NOAA and GISS).
Between 1850 and 1960, all proxy reconstructions fully agree with the direct temperature readings. The only problematic one is the tree rings after 1960. Before 1960, all proxy reconstructions agree with each other, within experimental uncertainty. All proxy reconstructions except for tree rings show a dramatic increase in global temperatures.
It's also well-known and well-documented, and well-published, that some tree rings show a fall in temperature after 1960. This is not a new problem, and you are not the first person to suggest there may be a problem. Mind you, even if we had to scrap all tree ring data, or even all proxy reconstructions, it's still only a drop in the ocean of evidence.
Where is the fraud?
-
Re:Global Warming Philosophy
Start recording temperatures in 1850, and in 1950 look at the trend. Do the same from 1950 onwards. Notice that CO2 increases IR absorption and is increasing in the atmosphere. Create a GCM and run it with and without the anthropogenic forcing. Notice which one fits the data. Download the program and the data from http://edgcm.columbia.edu/ and run it at home if you want to check. Oh, don't believe that data? Use this, or this new one. Want to check the GCM? run against paloclimate proxies, or write from first principles and do it on paper like Arrhenius did.
-
Data sources
They've also refused to disclose their raw data, or even a list of what data they used.
Let's pick on GISTEMP since they've open-sourced their analysis code. From their site:
The current analysis uses surface air temperatures measurements from the following data sets: the unadjusted data of the Global Historical Climatology Network (Peterson and Vose, 1997 and 1998), United States Historical Climatology Network (USHCN) data, and SCAR (Scientific Committee on Antarctic Research) data from Antarctic stations.
Links to these data sources are provided in the documentation of their freely available analysis software:
Basic data set: GHCN - ftp://ftp.ncdc.noaa.gov/pub/data/ghcn/v2
v2.mean.Z (data file)
v2.temperature.inv.Z (station information file)For US: USHCN - ftp://ftp.ncdc.noaa.gov/pub/data/ushcn/v2/monthly
9641C_200907_F52.avg.gz
ushcn-v2-stations.txtFor Antarctica: SCAR - http://www.antarctica.ac.uk/met/READER/surface/stationpt.html
http://www.antarctica.ac.uk/met/READER/temperature.html
http://www.antarctica.ac.uk/met/READER/aws/awspt.htmlFor Hohenpeissenberg - http://members.lycos.nl/ErrenWijlens/co2/t_hohenpeissenberg_200306.txt
complete record for this rural station
(thanks to Hans Erren who reported it to GISS on July 16, 2003)They've gone as far as ignoring FOIA requests to the point where NASA will soon be facing litigation.
The FOIA requests do not request data or data sources. CEI is asking for documentation, such as memos or e-mail, of discussions related to several topics including RealClimate.org and the error McIntyre discovered. Read it in their own words.
They can open-source all the algorithms they want, but without showing their data, it's completely useless.
Now that you have the data as well, we look forward to your analysis.
-
Re:psuedo-skeptics
It's possible that you were talking about something interesting, but it seems you weren't able to link to anything supporting your claims
The only paper I see posted shows, which fits well with established science, that ocean living creatures have no problems with small fluctionations in CO2 levels. And yes, over their evolutionary lifespan, the current fluctuations are very, very, small.
Did I link to a source for that before? Don't remember, I'll simply do it again:
http://www.geocraft.com/WVFossils/PageMill_Images/image277.gif
From Geocarb III, talked about in detail here:
http://gcmd.nasa.gov/records/GCMD_NOAA_NCDC_PALEO_2002-051.html
If you want to debate proper science, and your posts imply that you do, you need to source your statements better than random web portals and google searches where the contents don't match up with your sayings.
-
Data and algorithms
Other research centers also collect similar data, and some have open-sourced their algorithms.
And yes, their conclusions are similar to those of the CRU. That's what the GP means by saying that criticisms have been answered.
-
Data and algorithms
Other research centers also collect similar data, and some have open-sourced their algorithms.
And yes, their conclusions are similar to those of the CRU. That's what the GP means by saying that criticisms have been answered.
-
Video link and more details
-
Re:Nice try
Here are the global annual mean temperature anomalies for the 1930s, 1990s & 2000s in 0.01 degrees Celsius with 0 being the mean from 1951-1980 (you can divide the number by 100 and add 14 degrees C to them to get absolute temperatures):
1930-1940: -4, 2, 3, -12, 2, 3, -12, 2, -9, 1, 11, 14, -2, 14
1990-2000: 48, 44, 15, 18, 32, 45, 36, 40, 70, 43, 40
2000-2008: 40, 56, 67, 65, 59, 77, 64, 72, 54
2009 looks like it will be around 71.
Those numbers are from the GISS and are available here here. The records start in 1880 but you could make a case for extending the record back before 1850 based on the level of data collection. If you're going to dispute the numbers you have to make a cogent scientific argument about it, not some hand waving about insufficient records.
The only thing I'm aware of climate scientists accusing the Bush administration of is trying to silence them or distorting their reports on the subject. I don't have a problem with scientists discrediting poor science and boycotting journals that publish it. The paper the emails refer to is Soon & Baliunas 2003 published in Climate Research. The editor-in-chief and several other editors resigned over it being published and even the publisher eventually admitted it suffered from serious flaws. The only data that was deleted was their refined and normalized data, not the original data it was derived from which came from a bunch of sources. It could be recreated if there was a reason to.
What is the World Weather Bureau? I can't find anything about it. But Al Gore doesn't matter. He just disseminates the information that climate scientists give him. It's the scientists who matter.
If we would just let forests burn naturally the would thin themselves, after all they survived just fine for a long time before we showed up on the scene. But it's probably too late for that after a century of fire suppression. That's kind of peripheral to issue of climate change though so I'm not sure why you brought it up.
Water vapor is by far the most important greenhouse gas contributing 36%-72% of the total effect but it's not all of it. CO2 is 9%-26%. If CO2 only causes a 1% rise in retained heat that's equivalent to nearly 3 degrees Celsius in temperature.
Again, I'm not aware of any primary data that was thrown out and I don't have a problem with discrediting poor science. The Earth's climate has been scientifically studied for a long time. It's been pretty intensively studied since WWII. The possibilities of CO2 having an effect on climate have been known since the late 1800s. Lyndon Johnson had a briefing on the possibility of human releases of CO2 causing global warming in 1966 or so. There's a lot of science from thousands of scientists on the subject so what "real scientific study" are you asking for? I think you just want it explained in simple enough terms that even you can understand it but that's probably not possible because it isn't simple.
If you think the science on ozone was all a hoax because DuPont's patent on Freon was running out I don't know what to say to you. The ozone depletion of the stratosphere is a measured fact and there is a measurable increase in ultraviolet radiation on the surface of the earth because of it. The chlorine atoms in CFS have been shown to cause the breakdown of ozone. Freon wasn't the only CFC that was banned and I doubt all of their patents were running out at the same time. As people like to say here on
And people aren't getting rich off the current fossil fuel regime?! It's just the people you don't agree with that you don't want getting rich I guess. If we don't spend "trillions" now responding to climate change and it turns out we needed to it will cost us far more later and may cost us our civilization depending on how the biosphere responds. If we do spend "trillions" and it turns out we didn't need to we still have ren
-
Re:Apparently NASA does not obey the laws of physi
Uhh, physics troll? h = gt^2/2; t = sqrt(2h/g); v = gt = g(sqrt(2h/g)) = sqrt(2gh) = 47 feet per sec = 32 mph. Not sure yet how you get more energy out of an inclined plane, but work it. Anyway, http://www.nasa.gov/topics/aeronautics/features/helo-droptest.html says: "We crash-tested the helicopter by suspending it about 35 feet (10.7 m) into the air using cables. Then, as it swung to the ground, we used pyrotechnics to remove the cables just before the helicopter hit so that it reacted like it would in a real accident," she explained. The test conditions imitated what would be a relatively severe helicopter crash. The flight path angle was about 33 degrees and the combined forward and vertical speeds were about 48 feet per second or 33 miles per hour (14.6 meters per second, 53.1 kph).
-
Rocket gone wild.
Here is a well documented launch of an Minotaur rocket from Vandenberg AFB in 2005 which has some similarities:
http://www.spacearchive.info/minotaur-streak.htm
As for the spiral in I my opinion, depending on the perspective of the viewer relative to rocket you can see this pattern if you are looking at the exhaust end of the rocket and the rocket started to spin so that exhaust plume started to create a spiral. As the rocket lost total directional control, the rocket controller ordered a self-destruct so the sudden "hole" in the middle of the spiral as the rocket exhaust stops at the end of the event.
Here is another link about rocket trails with an expert description http://antwrp.gsfc.nasa.gov/apod/ap020926.html -
Reflected Sunlight
I don't see why this is so far-fetched - it would make sense that a missile at high altitude just before sunrise would shine, since "sunrise" has already occurred at high elevation where earth's shadow no longer obscures the sun. (The event happened around 8:00am) Compare it to a view of a shuttle launch just after sunset:
-
Video
This site has a video and some more information.
-
Re:Once again ...
... we're missing critical information in the report. The keep mentioning "levels of methane" but they don't tell us what these levels are
The usual sources quote about 10 parts per billion of Methane in the atmosphere. Michael Mumma of Goddard Space Flight Center, with earthbound telescopes, says he's detected up to 200 parts per billion near the equator. Recent observations suggest that the methane is released in plumes, one of which released about 19,000 metric tons of methane [space.com].
-
Re:Nice try
The code from the emails is totally unrelated to the code for General Circulation Models that Jim Hansen and GISS have worked on. The code for the GISS GCM's is available here.
-
Re:Sonic booms out west...
I would say that at Mach 1, the shock makes an angle of 90 degrees with the flow (theoretically). Subsonically, there is no shock at all (again, theoretically). At Mach 1.4 it's 45 degrees. (http://www.grc.nasa.gov/WWW/K-12/airplane/machang.html)
-
Re:Data thrown away
Yeah, like NASA. Those guys put up data from thermometers that clearly shows the hockey stick.
Oh, wait. No, it doesn't. That's odd. Maybe you can find the hockey stick in this data. I can't. What I find in the data is that scientists like to live in cities that get warmer as they get larger.
-
Re:Loss of trust
at the Scientific level the CRU clowns have been CAUGHT in illegality, denying valid FOI requests, for which their University, UEA, will have to answer in both British and European Courts.
When they're taken to court and convicted you can claim they've been CAUGHT in illegality.
Read the e-mails, they are disgusting
I've read plenty and the only disgusting thing I found was how denialists consistently took stuff out of context and misinterpreted it to fit their preconceived viewpoints.
and Prof. "Phil" Jones has already been forced to step down.
That's a rather funny way of saying "he chose to temporarily step down during an internal investigation regarding the leaked emails and data".
At least they have hidden/fabricated/falsified data and used it for fraudulent ends.
I haven't seen anything to indicate that, and apparently neither has Nature. Or is the most prominent scientific journal in the world in on the conspiracy too?
At the Political level the AGW agenda is DEAD.
No, not really. The far-right lunatics will trumpet the death of AGW, sure, but that won't make it so.
Since Global temperatures are FALLING there is no urgency, and there is no chance of re-vitalising this scam.
No they aren't. Have a look at, for example, the GISTEMP data yourself. It's quite clear there's no giant downward trend like the denialists like to claim.
-
Re:Nice try
Except that much of the "glaciation loss" is probably due to lowered precipitation instead of increased temperatures.
That doesn't explain why the Arctic sea ice and the Antarctic ice shelf are melting. As for your claim of predictions that have already been falsified, please provide a source.
-
Re:Nice try
This ignores some of the more obvious ways in which humans can change the atmosphere.
The point is not, that humans don't change the atmosphere at all. It is that our (anthropogenic) contribution to the change is negligibly small — we also "contribute" to Continental Drift... The cooling of the last 10 years, that so frustrated the CRU alarmists (one of them writes in an e-mail: "The fact is we can't account for the lack of warming at the moment and it is a travesty that we can't."), is now explained by the lower Sun activity — even when reminding the faithful readers, that "These changes are not enough to reverse global warming". Well, duh, "It is the Sun, stupid". Whatever we do here — and we didn't reduce our emissions (save for those few weeks in Bejing you observed) over the decade — the Sun will trump that many times over.
Oceans rising? Right... There are ancient cities on the sea floor off North Africa. Did Mediterranean rise because the humans were cooking too much 2000 years ago?
-
Re:Data thrown awayHere's a small portion of the data which is opensource: (see http://www.realclimate.org/index.php/data-sources/#Climate_data_raw)
- GHCN v.2 (Global Historical Climate Network: weather station records from around the world, temperature and precipitation)
- USHCN US. Historical Climate Network (v.1 and v.2)
- Antarctic weather stations
- European weather stations (ECA)
- Satellite feeds (AMSU, SORCE (Solar irradiance), NASA A-train)
- Tide Gauges (Proudman Oceanographic Lab)
- World Glacier Monitoring Service
- Argo float data
- International Comprehensive Ocean/Atmosphere Data Set (ICOADS) (Oceanic in situ observations)
- AERONET Aerosol information
You can follow the original link to realclimate.org to find many other links to data sources. I have posted the data sources above only because many critics of AGW won't even bother with realclimate.org as they are thought to be part of the conspiracy. The data exists and is public as is the source code.
-
Re:Politics
The data is all there (especially from US sources). Here's a very non-comprehensive list:
Data:
NOAA NCDC: http://www.ncdc.noaa.gov/oa/ncdc.html
NOAA sattelite data: http://www.class.noaa.gov/
ARM data: http://www.archive.arm.gov/armlogin/login.jsp
NASA GISS data: http://data.giss.nasa.gov/
NCAR data: http://www.ncar.ucar.edu/tools/datasets/Models:
NASA GISS GCMs: http://www.giss.nasa.gov/tools/
NCAR models: http://www.ncar.ucar.edu/tools/models/ -
Re:Politics
Extremely non-comprehensive list based on sources I've used:
Raw Data:
All of NOAA's satellite data http://www.class.noaa.gov/
NCAR's Data http://cdp.ucar.edu/home/home.htm
ARM data http://www.archive.arm.gov/armlogin/login.jsp
NASA data http://data.giss.nasa.gov/Models:
NASA GISS GCMs http://www.giss.nasa.gov/tools/
NCAR models http://www.ncar.ucar.edu/tools/models/ -
Meanwhile, back in reality...
You are quite right: this is pure politics, and has no impact on the actual science. People are making a big deal of this who do not understand that scientific theory rests on multiple, independent, reproducable lines of evidence and does not depend on the credibility of one particular institution. The laws of physics don't change because someone hacked someone's email.
This "scandal" is a tempest in a teapot, with much political but little scientific significance.
Meanwhile, back in reality, the ice caps are melting, the oceans are warming, the last decade was the hottest on record, and the current warming is unprecedented for at least 1300 years. I am a big fan of The Hitchhiker's Guide, so I don't think panic is ever an appropriate reaction, but there is plenty of cause for strong action to reduce the risk of catastrophic climate change.
-
Re:PoliticsIt's hard to follow your rant and what I do follow is backed up by dubious evidence at best.
Al Gore isn't poised to become a multibillionaire if Cap-And-Trade becomes law.
First, it isn't clear how Al Gore would instantly become a billionaire if cap and trade becomes law. Second, you really think one man is more influential than several, already, multi-billion dollar industries?
Western mega-corps won't have complete dominance in commerce if the developing world has to retool its entire production and delivery system to comply with international CO2 limits.
While this may be true, they already are the completely dominant force in commerce and so they'll make even more money if they don't have to retool anything.
So while you "deniers" stick your fingers in your ears, screaming "lalalalala...", so you don't have to acknowledge the thousands of respected scientists who disagree with the Anthropomorphic Global Warming theory
What? Are you counting yourself and all the other posters on slashdot?
the obvious evidence that all the models failed to predict the past decade of cooling
What cooling? The temperatures may be slightly cooler than the absolute peak, but to say there is a cooling trend is simply not true. http://data.giss.nasa.gov/gistemp/graphs/
There have also been two periods in western history where global temperatures were significantly higher than today: the Roman Warming Period, and Medieval Warming Period. Rome and London didn't flood under the melted icecap water.
Maybe because those periods weren't as warm globally as you think they were. http://en.wikipedia.org/wiki/Medieval_Warming
The Medieval Warm Period was a time of warm weather between about AD 800-1300, during the European Medieval period. Initial research on the MWP and the following Little Ice Age (LIA) was largely done in Europe, where the phenomenon was most obvious and clearly documented. It was initially believed that the temperature changes were global.[2] However, this view has been questioned; the 2001 IPCC report summarises this research, saying "...current evidence does not support globally synchronous periods of anomalous cold or warmth over this time frame, and the conventional terms of 'Little Ice Age' and 'Medieval Warm Period' appear to have limited utility in describing trends in hemispheric or global mean temperature changes in past centuries".[3] Global temperature records taken from ice cores, tree rings, and lake deposits, have shown that, taken globally, the Earth may have been slightly cooler (by 0.03 degrees Celsius) during the 'Medieval Warm Period' than in the early- and mid-20th century.[4] Crowley and Lowery (2000) [5] note that "there is insufficient documentation as to its existence in the Southern hemisphere."
I'm surprised a bunch of claims like yours can get modded up at all. Oh, wait... nevermind.
-
They're using Eucalyptus
The best thing about this is that they are, allegedly, using Eucalyptus: http://nebula.nasa.gov/blog/2009/nov/how-eucalyptus-enables-ec2-compatibility-with-nebu/
-
Re:Oh, hey,
If carbon dioxide increases global temperature, did carbon dioxide stop increasing since 1998?
No, the CO2 level continues to rise. The issue is that there is significant year-to-year variation in the global temperature. The climate question is whether or not CO2 will (and has) over the long term affect the climate, and how, and how much. The consensus is that the overall trend is that the temperatures are going up significantly over the long term and will continue to go up.
So, why is 1998 higher than the years since? Because of the statistical variation along with a very strong El Nino (see: El Nino). An analogy, since they are popular on Slashdot: If the stock price of a company has been going up for the past 10 years with significant fluctuations, had a spike because someone tried to buy the company, but went down in the last week, it is not evidence that the stock has lost value over the longer term, or that the stock will continue to lose value. It _might_ go down in the future of course, but you can't tell from a short term fluctuation. Similarly, the global temperature has rising for the past 100 years or so, and a single year spike in 1998 doesn't change that.
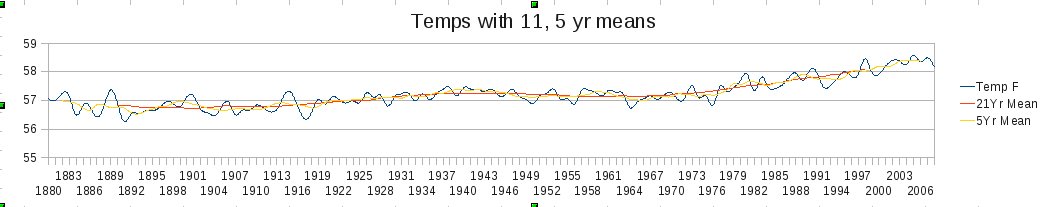
The temperature data is fundamentally noisy. That's the nature of weather data. Take a look at the data that NASA produces. There's lots of noise. See the big spike in 1998? Well, that doesn't mean the "globe is cooling". The trend is definitely up. The deniers will claim that the data in that plot is 'cooked', or 'manipulated', or 'corrected' to show a politically-desired outcome. The scientists who produced it will say that they are handling huge volumes of data, from different data sources, and have to be combined, and they are doing it the correct way. And that's the fundamental argument in this entire page. Are they, or are they not, cooking the long term data? The "whole globe is cooling because 1998 was hottest" is a complete red herring. What the data really says about the long term is the question. -
Re:Oh, hey,
Meanwhile, the global temperature record has shown no rise in temperature since 1998.
Stop repeating this mis-information. Please look at the data from NASA.
Look at the 5-year average. Hasn't that gone up since 1998? Also, aren't the years 2005 and 2007 both higher than 1998?
Now, explain to me how your statement is correct in any way.
-
Re:Why are people getting so worked up
Sorry, Climate "Skeptics" are using the data from NASA GIS incorrectly. As I specifically said, 1934 is in the U.S. top ten warmest years, but not the global top ten. If you don't believe me go look for yourself:
-
Re:Why are people getting so worked up
The only source of truly uncooked data currently would be the raw satellite data, but NASA doesn't give that out until they massage it.
My research uses satellite measurements of trace gases and aerosols in the lower atmosphere. I can tell you that:
- at the bottom of that second link is the raw satellite data. It is free for you to download. Or anyone, for that matter. I always end my conference presentations with a proud note that any highschool student with enough hard drive space and a strong will could sit down and do the research I am doing. I don't know if NASA is as open with all their satellite products, but at least with OMI and MODIS and MISR and MOPITT they are.
- the "raw satellite data" as you call it comes in terms of spectral intensities of reflect and radiated light. Without several fairly advanced courses in physics, or a lot of time at a library with books from said courses, you would be hard pressed to do any kind of useful analysis. I have been working with this stuff for quite some time and I still use the L2 products.
-
Re:Wow...
If 1:1000 is achievable with the same budget as 1:129 then it'd be evil not to do it - but if it increases costs by even 2:1 it is stupid to even suggest it.
This is especially the case when you consider that the committee meeting will probably only be discussing launch ascent safety, with perhaps a small portion devoted to reentry safety. Considering that NASA's plans for the new vehicles are for beyond-LEO exploration, it's a good bet that the most dangerous part of exploration won't be the launch, but the time that you spend voyaging to (e.g. Apollo 13's near-disaster) and exploring the Moon, Lagrange Points, Near-Earth Asteroids, comets, Phobos, Mars, or whatever. If you assume that there's even just a 1 in 50 chance of loss of life during the period of time after you've launched but while transiting to or exploring the Moon/Mars/whatever, the 1:1000 launch vehicle gives you an overall probability of dying of 2.1%, while the 1:129 vehicle gives you a death probability of 2.8%.
I guess that's worth something, but I'm not sure if it's worth tens of billions of dollars for a launch vehicle like the Ares I which will only launch a few dozen times at most. This is particularly so when you consider that the same money could be spent on launching commercial space vehicles many more times (with both unmanned and manned payloads), leading to improvements in safety and potentially creating much safer vehicles overall.
This point was well-stated on page 78 of the Augustine Committee's report:
-
Original HD footage
Why on earth does this look like it has gone through a VHS conversion?
And also many here does not seem to know that all NASAs imagery is free and available on the net: http://spaceflight.nasa.gov/gallery/index.html -
Re:SRB separation
Does anyone know the altitude that SRB separation occurs?
Around 150000ft (source)
-
Google is your friend. Sorta.
177,000 feet [flash] (about 54 km). However, this NASA site says 50 km (about 164,000 feet), while this source says 24 nautical miles (about 146,000 feet, or 44 km). My guess is that the differences are due to variations in mass and trajectory of the shuttle for various missions, and in improvements in the design (less weight, more thrust) over the years.
Apogee of the SRBs is at approximately 220,000 feet (about 67 km).
-
Re:Ahh, shuttle
Slightly more than that, but not by a whole lot. NASA's FAQ says each flight costs around $450m, which averaged over 138m taxpaying Americans (the 2007 taxpaying population) is $3.26 per flight per taxpayer. Figure three flights per year and it's still dirt cheap at $9.78/year/taxpayer. That's about what I spend on gasoline over a period of two days, and less than a single meal at Arby's.
I don't begrudge this expense at all, given what the program has given us.
Your argument is valid, but your numbers were slightly low-balled.
-
Re:Huge photo of "shuttle flying over rugged terra
Why is this linked from a bible site? Are you trying to save NASA's bandwidth costs?
Original here:
http://spaceflight.nasa.gov/gallery/images/shuttle/sts-129/html/iss021e032919.html
-
Re:Great...
It is fortunate that CRU is not the only organization computing global temperatures.
NASA/GISS has an independent global-temperature program, and they've been much more open with the general public than CRU has. All of the information you need to replicate (or "audit" if you prefer) NASA's work is available at http://data.giss.nasa.gov./ They use publicly-available raw temperature data, homogenize it with their open-source code, and compute global average temperatures. Their global temperature computations show a bit more warming than CRU's computations do.
This shows the value of having multiple, independent organizations performing the same (or similar) work. If one organization's credibility is in doubt, then its results can be cross-checked with the other organizations' results.
CRU definitely did "step in it" in their dealings with "gadfly" skeptics. Had they taken NASA's approach ("here are all the data and code -- knock yourselves out"), this would not have blown up as badly as it did.
-
Skeptics here -- how many of you have contributed?
There's lots of climate-model source-code available on the web. Much of it has been publicly available for years.
Examples:http://www.giss.nasa.gov/tools/modelE/
http://www.ccsm.ucar.edu/
http://www.mi.uni-hamburg.de/Projekte.209.0.html?&L=3
http://www.sciencemag.org/cgi/content/full/317/5846/1866d/DC1
http://geoflop.uchicago.edu/forecast/docs/Projects/modtran.htmlNow for all the skeptics out there -- those of you who have downloaded and tested any climate code, submitted patches, constructive suggestions, etc. to the code developers, please stand up and give us a shout-out!
Don't be shy or modest -- even if you've done nothing more than submit a one-line change to a makefile, let's hear about it!
-
Cool, but there's cooler from Cassini
Cassini just did another flyby of Enceladus a week ago and got some amazing pictures of the ice plumes/geysers found there.