 Slashdot Mirror
Domain: noaa.gov
Stories and comments across the archive that link to noaa.gov.
Comments · 2,602
-
Re:What about our fine feathered friends?
Negligible. Humans use, on average, about 11 Terawatts of power at a given instant; the sunlight hitting the planet at a given instant is something resembling 100,000 Terawatts(that's ballpark, the exact number is going to be quite different than that, but I am lazy).
That's (surface area of a disk the size of the earth in meters) * 1000 w/m, which is going to be close enough to demonstrate that we use a trivial amount of energy, in terms of the weather.
Individual hurricanes dwarf human power consumption, if that helps:
http://www.aoml.noaa.gov/hrd/tcfaq/C5c.html -
Re:X3 is nothing..
I don't even know why this is news. Sun activity is very low right now, we're at the bottom of the cycle right now: http://www.sec.noaa.gov/SolarCycle/
A few years ago we had that X28 flare!
It counts as news because CMEs occur with equal probability in all directions.
The Earth, from the Sun, counts as a very very VERY small target - Given a straight-line probability of hitting us, the Earth only occupues 0.00005% of vectors heading outward from the Sun. Granted, a CME takes the form of a rather large cloud, so boost that by a factor of a thousand (give or take an order of magnitude), but we still have an exceptionally small chance of getting hit by any given CME.
Well, this one hit us, and as I write this, we have a Kp of >8, with a G4 intensity geomagnetic storm going on (the scale only goes to 5, much like hurricanes). To get an idea of what that means, I live a mile south of a international airport, my neighbor (to the North) has a brazillian watts worth of christmas lights out, and the sky still looks bright frickin' green (unfortunately we have some serious cloud cover here, or I'd have a hell of a show and certainly wouldn't waste it writing on Slashdot).
Or to put it another way - if an X28 CME actually hit the Earth straight on, we wouldn't have any functional satellites left to tell us about it, nor would most of us hear about it on the news for a week or so due to massivly widespread blackouts. -
X3 is nothing..I don't even know why this is news. Sun activity is very low right now, we're at the bottom of the cycle right now: http://www.sec.noaa.gov/SolarCycle/
A few years ago we had that X28 flare!
-
Re:Look north tonight
Check out this page for the "energetic particles" count in the atmosphere. Basically, you have a decent chance of seeing Northern Lights if you are being covered by a yellow or red pixel.
-
X-ray flux raw data
Real-time X-ray flux data is available here. A good site (for BOFHs or just curious laypeople) on this subject is SpaceWeather.
-
Re:Journalism?NOAA, in fact, publishes hurricane season predictions as well. Their forecasts were in line with those from Gray's team at CSU.
Final predictions prior to the beginning of the 2006 Atlantic hurricane season:
NOAA (22 May 2006)- Named Storms: 13-16
- Hurricanes: 8-10
- Major Hurricanes: 4-6
CSU (31 May 2006)- Named Storms: 17
- Hurricanes: 9
- Major Hurricanes: 5
- Named Storms: 13-16
-
Conspiracy Theories
So you, with absolutely no references and a head full of conspiracy theories, know better than NASA, the ESA, the NOAA, the WMO, and the EPA -- all of whom believe in the theory of anthropogenic ozone depletion caused by CFCs, and publish research that supports that theory?
Seriously, here in reality, science supports the theory of anthropenic ozone depletion. It supports the theory of anthropogenic global warming. It supports almost all the theories that scientists and environmentalists endorse, and that paranoid antigovernment sociopaths bitterly decry as attempts to destroy the US economy.
The ESA's research has found ozone-depleting clouds containing CFC-derived radicals. But Europeans are automatically wrong since they try not to fight unwinnable $500 billion dollar wars of attrition in the middle east anymore, right?
The NOAA is pretty sure that ozone depletion is caused by Humans. Are your tax dollars being used as part of a grand conspiracy to destroy America? Better start writing more threatening letters to the government.
NASA's ozone depletion FAQ. But everyone knows that NASA is a liberal conspiracy developed by socialists to undermine industrialism in all its forms.
To summarize: don't be such a fucking idiot. Anthropogenic ozone depletion is completely real.
-
Re:What does bias mean?Ummm...AFAIK last year climatologists (and former VP Gore) predicted a stronger hurricane season than last year due to global warming, even though Philip J. Klotzbach and William M. Gray, et al. of Colorado State University found "no physical basis" to link the +0.5C change over the last thirty years and more intense hurricanes (abstract here). The NCDC's own statistics show a far more mild season than the one predicted a year ago. While there are predictions for the next five, ten, thirty years out, they are also predicting, at least in this field, for a year or less in the future. This won't falsify a theory, but it does allow for the tracking of predictions you were talking about.
Chr0me.
-
higher res, different wavelengths
Hinode (SOLAR-B) is in may ways an upgrade to the previous Yohkoh (SOLAR-A) mission.
The main difference is that Hinode uses 4 megapixel cameras over the 1 megapixel cameras flown in other space-based solar observatories. (note -- ground based solar observatories have higher resolutiion cameras, but they can't observe these frequencies as x-rays can't make it past the atmosphere. (RHESSI observes in hard x-ray, but it's not a full-disk imager. SXI on GOES is full disk, but it's on soft x-ray)
Now, a couple of weeks after Hinode launched, STEREO also launched -- which is not only 4 megapixel cameras, but two observatories, and besides Ulysses, the first (two) solar observatories not in the sun-earth line. (I'm not a solar physicist, so I don't know what sort of instrumentation package Ulysses carried. Due to the flight path not staying a constant distance from the sun, and because our group doesn't track it*, I can only assume it's insitu and not remote sensing). The more impressive solar observatory will be the Solar Dynamics Observatory, aka SDO.
The reason that SDO is impressive, even though it's in the sun-earth line and isn't as useful as STEREO for solar weather, is that it will be flying 16 megapixel cameras. Because it will be in an inclined geosyncronous orbit, it will have its own ground station for constant data transfer at a full data rate without making use of the Deep Space Network. This allows it to not only send larger pictures, but more of them -- AIA will be taking images every 10 seconds. No space based solar observatory even comes close to that sort of a data rate. (STEREO is estimated at 1.5GB/day, while SDO will be 1TB/day)
* By 'our group', I'm referring to the Virtual Solar Observatory, for which I'm a programmer.
** Please be aware that these are the things that I hear in passing while doing my job. Although I think I'm right on all of this, it wouldn't hurt to get a second source that actually is a solar physicist and deals with the instruments directly. -
Re:Space Colonies: A Waste of Good Planets?
Simply put, most of the planets and other celestial bodies in this star system cannot support life at all.
You left four words off near the end of your sentence. The other celestial bodies in this star system cannot support life as we know it at all. Scientists have found life forms in volcanic vents on the sea floor, where the temperature can reach 400 degrees Celcius. Who's to say that similar life forms don't exist somewhere on Venus, for instance? -
Re:20yrs is not a geological timeframe
I am 54 years old. 44 years ago, I remeber walking home from midnight mass in a blizzard. This was in NY City, and garbage trucks had to pile snow and the end of the streets since there was no where to plow it all. We had snow mountains for a month or so. All of this is anecdotal, and certainly not a "geological" time period.
And yet, I have noticed changes which seem to be born out by hard data that something is happening over a period of 29 years, namely that in certain key areas, such as Alaska in the western hemisphere, things seem to be warming significantly.
While I don't think anyone here is saying it's still okay to buy a Hummer because CO2 cannot be proven as yet to increase global warming, I think we need to take a really hard look at what we can do planetwide to decrease CO2 emissions at the very least.
Other comments in this thread sarcastically decry the "religion" of global warming. Let's see, I drive a Prius, have replaced all light bulbs in my house with low energy flourescents, and hope to be trained in the Climate Project's slide show that was the basis for "An Inconvenient Truth." Give me that old time religion...
-
an unconventional theory about climate changeThere's so much back-and-forth on this particular topic that it's hard to be sure who's full of BS.
It's easy to make the correlation/causation fallacy. A scientist observes a phenomena (climate change), then tries to find the cause thereof. "What has changed in our little world that might be driving the trend?", and the 20th century's rapid industrialization and uptake of petroleum-based fuels is easily noticed and studied.
Carbon Dioxide is also a red herring. There are also factors that aren't nearly as commonly considered which have much more of an impact on global climate change. I am specifically refering to underwater volcanism. We tend to not notice much that goes on under the oceans' surface.
From a June 8th email:Levitus, who has become one of the old men of oceanography and related earth history, cited in oceanography lit. and esp. related to global warming, is very soft spoken but is clearly telling his colleagues in the backhanded way academics often say things that greenhouse gas theory is a crock. The climate change mostly is being induced by the heating of the ocean, he says....which he does not explain directly in this latest article, but he sure does lay the ground work for a lot of other oceanographers who are very very close to getting bold enough to talk about the extensive underwater volcanism they have found during the last 15 years.
For those of technical bent, get his article and try letting it frame your thoughts about how global warming really does work: Warming of the world ocean, 1955-2003
(emphasis added)
Another email from the same source, from August 15th, 2006:Global Warming is unequivocably being caused by underwater volcanism which is heating the bottoms of the oceans which is changing currents and radiation and reflection characteristics of the oceans which is changing the climate regimes.
In March I could make strong claims related to such, but by spending more time slogging through the obscure sources of scientific information and reading between the lines, I CAN PROVE IT BEYOND A SHADOW OF A DOUBT. The oceanographers, bless them, for the most part do not undersand how the immensely important data they are sitting on adds up. I do and all of this is sitting in rough draft form in a new title, some 280 pages of text and graphs, called:
Major World Trends 1875-2025: A Strategic Brief on Global Warming & The Eight Geophysical Changes Which Are Profoundly Altering The Earth
Haven't heard anything about this specific project recently, though Mandeville said recently that his projects are starting to come to conclusion...
I'm not trying to defend oil - while certainly useful, it's also quite nasty - nobody likes oil spills, or getting squeezed dry by multinational oil conglomerates. Luckly we're only a short scientific revolution away from making oil obsolete. Like vacuum tubes, oil will still be useful, but we won't be dependant on it for mechanical mobility. -
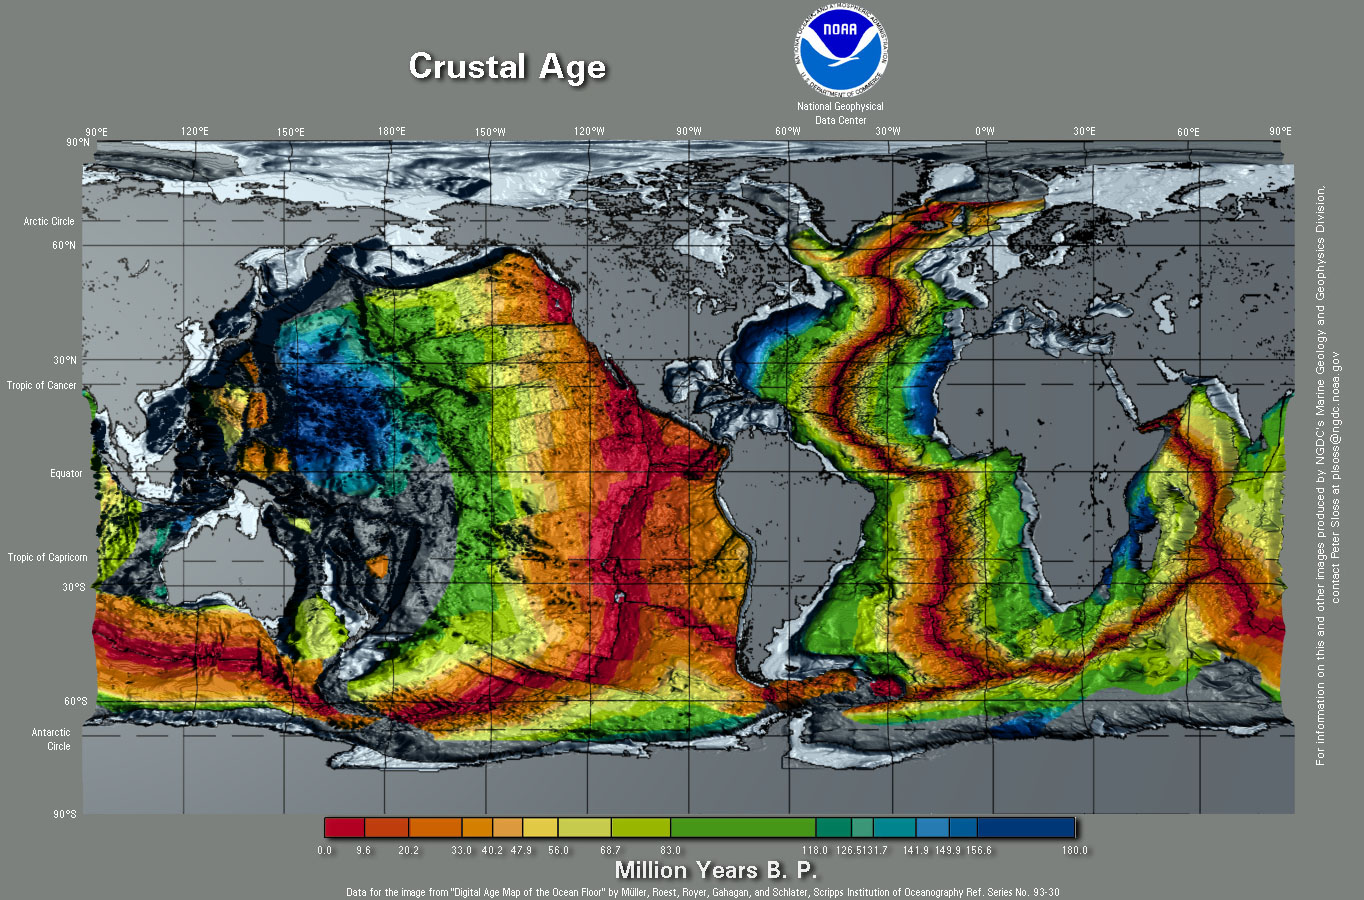
Re:Lots of water
Oceanic crust recycles itself much faster than continental crust. You'd have a hard if not impossible time finding ocean crust older than 200 million years, but there are areas of continents over 3 billion years old. Thus one should expect to find less than 3/4 of all impacts in the oceans.
-
Re:Unstoppable Global Warming: Every 1500 Years1) There is the idea out there that the medieval warm period wasn't so warm after all. See also http://www.ncdc.noaa.gov/paleo/globalwarming/medi
e val.html/. Use that as a starting point.2) That's one hell of a funny cycle that occurs exactly once (two data points) over a 100K year time period. Or did everyone miss the warm periods 3000 years ago, 4500 years ago, and so on? I'm gonna go out on a limb and say the guy is a crackpot. Just because someone has an opinion doesn't mean I need to take it seriously.
-
Re:Shows how old those damn satellites must be :-)I think it will be interesting to see how the usual historic inaccuracies will be dealt with.
I recently spent several months looking over historic maps around Newark Bay in New Jersey. Most of what we looked at came from NOAA and while I have a great deal of confidence in the abilities of the mapmakers, there are still many issues having to do with datums and resolution that I never thought about before I started working with historic maps. When you deal with charts and maps you really have to start thinking about things like accuracy verses precision.
Here are a couple interesting documents about the accuracy of charts
Behind the Accuracy of Electronic Charts--What Every Mariner Should Know about Electronic and Paper Charts
Chart Accuracy -
Re:Reported on Election Day, Coincidence?
The parent comment is an amusing narratve, but if we wanted to find some holes in it....
1) The article is in regard to a large stellar flare, not a solar one. Currently the Sun is at solar minimum, and while large solar activity can occur at this time of the cycle, such activity is rare. For those that are interested, the National Solar Observatory has images of the current solar activity, and a current space weather report is available from the Space Environment Center. Besides all of that, the flare the article is referring to was detected close to a year ago.
2) Even if the storm referred to were from our own star, most of the effects of solar activity do not reach Earth for several days (especially those that affect our electronics). Coronal mass ejections (CMEs) are large amounts of charged particles that can interact with our magnetic field causing geomagnetic storms. These particles take numerous hours to several days to travel from the Sun to Earth. On the other hand, radio interference can happen as soon as the storm is detected (8 minutes after the event). But even then, the antennas usually need to be pointing toward the Sun in order for the SNR to be low enough for problems. -
Sure, I'll back it up
-
Re:More debunkation.
I don't know why this keeps being quoted. Try this instead: 'The idea of a global or hemispheric "Medieval Warm Period" that was warmer than today however, has turned out to be incorrect.' http://www.ncdc.noaa.gov/paleo/globalwarming/medi
e val.html
And this is exactly the data the article tries to prove wrong. From TFA:
The first mistake made by Mann et al. and copied by the UN in 2001 lay in the choice of proxy data.
The UN's 1996 report had recommended against reliance upon bristlecone pines as proxies for
reconstructing temperature, because 20th-century carbon-dioxide fertilization accelerated annual growth
and caused a false appearance of exceptional recent warming. Notwithstanding the warning against
reliance upon bristlecones in UN 1996, Mann et al. had relied chiefly upon a series of bristlecone-pine
datasets for their reconstruction of mediaeval temperatures. Worse, their statistical model had given the
bristlecone-pine datasets 390 times more prominence than the other datasets they had used:
To debunk this you will have to debunk his arguments on why the data by Mann is wrong. Not by simply quoting the disputed data and simply saying it is right.
Nyh -
Who are you going to trust?
NOAA (with their obvious liberal agenda - I mean after all aren't they part of that left-wing Bush administration?) or some author that actually believes that in "1421 a Chinese Imperial Navy squadron sailed right round the Arctic and found no ice anywhere"? (I downloaded the PDF that is supposed to have references and found no references for this ludicrous claim. Granted, he did not invent this claim himself, but I guess he's afraid to provide a citation for that.)
-
Re:More debunkation.
We have historical records of viking farms in Greenland circa 1000, where now we have glaciers, and of the Chinese expedition that sailed around the North Pole during roughly the same period without seeing all that much ice.
I don't know why this keeps being quoted. Try this instead: 'The idea of a global or hemispheric "Medieval Warm Period" that was warmer than today however, has turned out to be incorrect.' http://www.ncdc.noaa.gov/paleo/globalwarming/medie val.html
There may have been the odd local effect but it was not global warming. -
Another polemical dissertationJust a couple of points on his "reference paper" is enought to cast doubt on this article.
Greenland has not been ice-free for millenia. The ice cap is up to 3km deep. It was not ice free in the middle ages.
His graphs on atmospheric concentrations do not include recent figures such as Mauna Loa Research Station
It is sad that this person has gone to such lengths to mine any information that supports his pre-ordained view. This is hardly a dispassionate investigation.
-
Re:My Two Cents
Since this is science, that information *should* be publicly available somewhere.
There are vast amounts of data available from the NOAA, from tree rings, to coral, to pollen, to ice cores, complete with search engines and mapping systems to help you locate the dataset you want. All of it is freely available for download and analysis. As for modelling - a quick search pulled up this page which provides R code for the MBH graph. Feel free to grab that, check their assumptions, and redo whatever you wish. -
Re:Great Site For DebunkingThat site is called junkscience, and it is. We've seen this before, when a major problem becomes evident, a certain proportion of people simply cannot cope with the scale of the problem, nor what is required as a response to the problem. For example, when science revealed that smoking causes lung cancer, many people with a lot to lose denied it - some people still justify smoking to themselves. Despite (almost total) consensus in the scientific and medical community, they refuse to acknowledge the harm they caused to themselves by smoking (albeit unknowingly), and consequently the harm they continue to do. The same principles apply to denying global warming: it's frightening to have come to the end of our credit spree of fossil fuel usage, it's frightening to consider that we have damaged the environment in a way that dwarfs whatever achievements we had thought we had made. So, frightened, we deny, deny, deny.
I've read the article. The same old debunked myths: Medieval Warm Period? Debunked.
Variations in the output of the Sun? Debunked.
It's all a left wing myth perpetrated by the UN to set up a World Government? - Left as a exercise for the reader.
-
Re:Just a minute...
a) Is "global warming" really happening?
Unless you are being perversely skeptical, the answer to that is "yes". We have historical temperature records going back to 1850. You can read the FAQ for such datasets and download the data for yourself if you like, or read the articles detailing data collection, analysis, and uncertainties. There is an obvious upward trend.
Going back further requires use of proxy data such as tree rings, ice cores, coral data, glaciers, etc. There have been numerous different studies by different scientists collecting, and cross referencing such data to create historical temperature reconstructions. Here is a plot showing 10 different reconstructions by various authors. There is some variability, but the recent upward trend is again clear. Again, you can get the datasets yourself, and read more reports detailing how they are analysed. At about this point skeptics point to Greenland being green, or Wine growing in Europe in 1000AD, but I've discussed those before, so I won't go into detail again.
The result is that, to claim that the earth is not presently getting warmer requires either a belief that limate scientists are almost universally incompetent, or that they are colluding en masse in a grand conspiracy to falsify data and delude the public. Either of those options would seem, to me, to be a much greater leap of faith than simply assuming that the world is, indeed, getting warmer. As I said, it requires a rather perverse skepticism more on par with 9/11 conspiracy theorists like the maker of Loose Change.b) If "global warming" is really happening, is it due to anything mankind is doing?
An interesting question. Certainly mankind is doing something: since 1850 atmospheric carbon dioxide levels have risen from around 280ppm to 385ppm. That's a significant change - in fact given atmospheric carbon dioxide levels over the last 650,000 years (via ice core data) the current levels are 5.5 standard deviations from the mean; that's significant! Are humans responsible for this change? Certainly it correlates with the industrial revolution, but still... As it happens we can do isotope analysis of atmospheric carbon dioxide, since isotope ratios for fossil fuels are different from thoses of the rest of the carbon cycle. It turns out that indeed, the sudden increase in atmospheric carbon dioxide is from humans burning fossil fuels. Now a little basic physics and the absorption spectra of carbon dioxide is enough to tell us that we should expect greater atmospheric carbon dioxide to result in a warmer planet. It turns out that is indeed what we are seeing, and that it correlates well. There's more than just that however. Have a read through the chapter on attribution of the IPCC Third Assessment report. A wide variety of techniques are used to attempt to attribute the observed warming to various potential causes. The end result is that the IPCC found that while warming prior to 1950 could possibly be accounted for by other factors, including solar variation, warming since 1950 can only be reasonably accounted for via anthropogenic atmospheric carbon dioxide. Feel f
-
a brief response from a person involved...
I wouldn't call this project abandoned as much as it is still under development. Reading the previous comments, my answer to having easier ways to find the temperature outside is "YES."
NOAA and ESRL are looking at Second Life as a possible platform for educational outreach as well as visualizing some of our data much of which is inherently 3D rather than 2D. Our island, which will have more of a focus on education rather than data visualization is slated for opening in the middle of November. If you are interested in more information you can visit our web site (also under construction) at http://www.esrl.noaa.gov/outreach/sl/
Eric
-
Yup...
... like when some aide lined out the entire Space Environment Center from NOAA's budget a few years ago -- after all, space is outside NOAA's bailiwick, so what are those goons doing? Turns out they're only ensuring the ongoing safety of the electrical grid and all of our comsats, phone systems, and aviation network...
Unfortunately, the vast majority of laws and regulations are composed in a hurry by college interns or harried public servants. -
Re:Voyager worked (still works?) like that
Early space cameras were single pixel and scanned their surroundings by their rotation.
Low-orbit weather satellites work this way too. They have a rotating mirror that scans the image on to a single-pixel sensor, then the spacecraft's motion provides the Y dimension. These things take really cool pictures. I use a modified Radio Shack scanner and my computer (with its sound card) to receive them.
I've toyed with mechanical scanning for a couple of applications: making a high speed camera, and turning an infrared thermometer into a FLIR imager. The price tags on real FLIR cameras (like the one they used on Mythbusters when they were screwing with infrared alarms) have too many digits.
...laura
-
Re:Sadly it is true...
or the recent below-average temperatures
Sadly, you're not up-to-date. Go to this page, then select the plot for mean temperature departure, year-to-date. Then, just for the sake of argument, look at the annual plot for 2005, 2004, 2003, etc.
After doing that, explain how having a large swath of North America registering at or above normal constitutes "below-average temperatures."
Global warming is real.
-
Re:Plenty of Room
Of course, NYC and Boston both have respectable winters, so they tend to invalidate the idea that weather is the issue in this migration. For whatever reason, half of everybody in the country lives in a coastal county.
-
Hurricane seasonA little off-topic, but since the posting does mention it...
Just as we near the end of the hurricane season in the Atlantic Ocean
The National Oceanic & Atmospheric Administration still has this headline on their front page:
NOAA Continues to Predict Above-normal Hurricane Season
So what kind of hurricane season have we had?
- Tropical Storm Alberto
- Tropical Storm Beryl
- Tropical Storm Chris
- Tropical Storm Debby
- Hurricane Ernesto
- Hurricane Florence
- Hurricane Gordon
- Hurricane Helene
- Hurricane Isaac
Four named storms and 5 hurricanes. Not shabby, but way short of the (revised, even ) forecast: 12 to 15 named storms, 7-9 hurricanes, and 3-4 major hurricanes.
And thank goodness they were so wrong. Some of those hurricanes were pretty stiff, but fortunately none made landfall.
-
Ice Cores
I did some quick analysis of ice core data and I see a flaw. Looking here, I see that they can see C02 data starting a couple of decades before before 1950. I would like to see ice core data covering 1980 to now. How do we know that the PPM is being read right? Lets see the Ice Core to Modern temperature reading corrolation. How about ice core to atmospheric CO2 concentrations? Anyone know where some more modern data sets are?
-
Re:real time feeds + hi res = coolness
Here's your weather, Radar and watch/warning outlines: http://www.srh.noaa.gov/ridge/kmzgenerator.php
-
Awesome!
Wow. That's incredible. Especially this picture! (currently using it for my desktop background)
-
More high altitude eye candy
A group at the NOAA Climate labs in Boulder did something similar recently. Duct taped a digital camera set to take pictures every 25 seconds to an atmospheric sounding balloon. Nice pictures of the Colorado front range from up to 90,000 feet.
http://www.cmdl.noaa.gov/gallery/balloon_flight -
Error level in the ice core data is +/- 2-3 ppm
"The most common omission I find is the error level on charts. Take the ice core samples, what is the error level? Most I have seen have stated that the current PPM of CO2 is at an all time high! It has been stated that the current CO2 levels are 330+ ppm and from ice cores we know it has never been higher, or do we? What is the error level of the ice cores? +/- ??? If it is +/- 500ppm than the charts are junk, if it is +/- 2ppm then they may mean something. To date I have not been able to find anything that states the accuracy of the reading or the error level of the ice cores."
I did a quick Google search. The uncertainty in the Vostok ice core data is plus or minus 2-3 parts per million by volume.
Here's the data: http://www.ncdc.noaa.gov/paleo/icecore/antarctica
/ vostok/vostok_co2.htmlFrom the description:
"CO2 and CH4 measurements have been performed using the methods and analytical procedures previously described (Barnola et al., 1987, Chappellaz et al, 1990). However, the CO2 measuring system has been slightly modified in order to increase the sensitivity of the CO2 detection. The thermal conductivity chromatographic detector has been replaced by a flame ionisation detector which measures CO2 after its transformation into CH4. The overall accuracy for CH4 and CO2 measurements are ± 20 ppbv and 2-3 ppmv respectively. No gravitational correction has been applied."
If anyone wants to see what the Vostok ice core data looks like, here's an open letter I sent to the Canadian environment minister, including a graph of the ice core data: http://www.geocities.com/rwvong/future/greenhouse
. htmlYou may not be too worried about a CO2 level of 370 ppm, but it's still rising. If we proceed with business as usual, by 2100 it'll be at 800 ppm. (Again, looking at the ice core data, it's never been higher than 300 ppm at any time in the previous 400,000 years, which includes several ice ages. In comparison, settled civilization based on agriculture is less than 10,000 years old.)
If we make a serious effort to stabilize and reduce CO2 emissions in the next ten years--if the EU countries can do it, why can't we?--then we should be able to stabilize CO2 levels at about 500 ppm. There'll still be warming, but it'll be slow enough to adapt.
-
Wii Weather
Interesting feature. Al Roker would be proud.
If it's anything more than a glorifed version of the Weather Channel webpage (and closer to the real weather webpage, complete with other departments), I'll be impressed and probably use it. Otherwise it's probably just a feature I won't use.
-
800,000 years? What?
all 800,000 years of the ice column have been analyzed, and the data show much the same pattern, according to the researcher: 'When carbon dioxide changed there was always an accompanying climate change. Over the last 200 years human activity has increased carbon dioxide to well outside the natural range' -- to 380 ppmv."
What makes you jabbering idiots think that 800,000 years is geologically significant length of time?
Hint: the Earth is BILLIONS of years old.
Hint #2: CO2 levels in the geologic past have often been 5-26 times the current value.
Care to explain how your "well out side the natural range" babble holds up, given that "inconvenient truth"?
Didn't think so.
Fucking innumerates. -
Re:Carbon Dioxide and Climate
If you are going to claim that as CO2 went up, the climate changed, and vice versa, then you are stating, unequivocally, that CO2 drives climate.
So, the question then becomes, if the CO2 varies from 200-300ppm over the last 800,000 years, then what drove those changes?
Wait -- are you saying that their measurements are in error, or are you saying that you believe the measurements, but would like more explanation of the process they reflect?
Once again, this article confuses correlation with causation. If you are going to state that CO2 changes cause climate change, then you must also demonstrate a mechanism for the changing CO2.
The article didn't actually state this, but it is accepted science at this point. All the article really stated was that the level of CO2 is drastically higher now than it has been within the visible past.
If, on the other hand, climate change causes changes in CO2 levels
It does. It works both ways.
, then you need only explain climate change, something which has been adequately explained by solar cycles. http://solar-center.stanford.edu/sun-on-earth/vars un.html and http://www.ncdc.noaa.gov/paleo/milankovitch.html
These are fascinating links. The first is to a discussion on usenet, and the second is to an ice age causation theory from 1941 (which may well be true -- it's just that that being true doesn't magically mean that the connection between CO2 and climate is untrue). I would find them more compelling if they were links to, say, papers published in peer reviewed journals which cast the "CO2 theory" of global warming into question. I can understand that you might have trouble finding one of those, of course, since there aren't any to speak of.
(I know, I know, the scientists are all league in a secret cabal. They all know it's a lie, but they keep saying it is so they can get their grant money. The global warming "skeptics" like Bjørn Lomberg are in it for the pure love of truth, but the poor fellows just can't get their reports published because it threatens the monied orthodoxy. I know. I know.)In fact, it's more correctly stated that CO2 levels tend to lag behind climate changes by up to 900 years. http://www.sciencemag.org/cgi/content/abstract/299
The realclimate.org rebuttal you linked to above is actually pretty good on its own. For the peanut gallery, I'll quote the nut of it: "The reason has to do with the fact that the warmings take about 5000 years to be complete. The lag is only 800 years. All that the lag shows is that CO2 did not cause the first 800 years of warming, out of the 5000 year trend. The other 4200 years of warming could in fact have been caused by CO2, as far as we can tell from this ice core data.
-
Carbon Dioxide and Climate
If you are going to claim that as CO2 went up, the climate changed, and vice versa, then you are stating, unequivocally, that CO2 drives climate. So, the question then becomes, if the CO2 varies from 200-300ppm over the last 800,000 years, then what drove those changes?
Once again, this article confuses correlation with causation. If you are going to state that CO2 changes cause climate change, then you must also demonstrate a mechanism for the changing CO2. If, on the other hand, climate change causes changes in CO2 levels, then you need only explain climate change, something which has been adequately explained by solar cycles. http://solar-center.stanford.edu/sun-on-earth/vars un.html and http://www.ncdc.noaa.gov/paleo/milankovitch.html
In fact, it's more correctly stated that CO2 levels tend to lag behind climate changes by up to 900 years. http://www.sciencemag.org/cgi/content/abstract/299 /5613/1728 Although the folks at RealClimate like to just sweep this little fact under the carpet as unimportant. http://www.realclimate.org/index.php?p=13 To them, apparently, man made CO2 causes instant warming, but natural CO2 takes up to 800 years to have an effect.
Again, be very careful about assigning cause and effect in a system as complex as the atmosphere.
In other words, this extra datum is nice to have, but it changes nothing in any ongoing debate. -
Re:30 years ago?
Do I get to assume that you're an idiot and can't read also? If so, look here. It's a graph, that means pictures so you don't have to read.
-
Re:rebuttal
2. Equipment not working at -40.
Considering that these ships are intended to be used by the coast guard in the gulf of Mexico, I don't see the problem.
Even if operating in the waters off Alaska, an operating temparature of -5 F (-20 C) should be fine. The freezing poing of the sea is -2 C (29 F). The air above the sea is warmed by the sea. I just checked the weather records of a Bering Sea weather station, and for example in 2005 the temperature never dropped below -8 C (18 F). -
Re:No explanation?
Hmm, we've been dealing with this in the Gulf for a while. It's recurrant - it goes away, then comes back the next year, and is caused by too much algae, which is basically fed by nitrogen rich runoff from ground water. IIRC, though, wind actually helps by mixing the water, so global warming shouldn't really enter into this picture. Not to say the article didn't quote somebody saying that, or that different climates won't affect things, but that's just what I heard. For anybody interested, there's a pretty scientific assessment of the phenomenon (in the gulf at least) here (I don't think anybody's linked to this yet, apologies if this is a dupe). Anyway, don't panic, Oregonians, you'll survive! Cheers.
-
volcanic ridge/rift, most likely
I guess it's called the Juan de Fuca Ridge.
This dead zone is "most likely caused by underwater volcanism along the Juan De Fuca Ridge, which is about 20% volcanic along its 500 mile length. Occassional volcanic eruptions occur along the Ridge (Rift) which can create gigantic megaplumes of hot mineral water. Could be there is very little oxygen in the plumes, it most likely would have reacted with the minerals, leaving dissolved oxygen at nil." -
someone's going to blame 'greenhouse gasses'
... when it's really the increases in underwater volcanic activity that are mostly to blame.
See Warming of the world ocean, 1955-2003, published in the Geophysical Research Letters.
The dead zone off the Oregon coast, last season's record-breaking hurricane season, the 2004 super-quake in the Indian Ocean, changes in long-standing weather patterns (because of the change in heat distribution in the oceans) - all are signals of increased techtonic activity. -
Eye "AT" a hurricane...
How are they keeping their eye AT Ernesto?
Maybe not NASA, but certainly NOAA really can literally keep their eye AT a TS/hurricane by flying around and thru it in one of their P-3 Orions.