Slashdot Mirror
Domain: psmsl.org
Stories and comments across the archive that link to psmsl.org.
Comments · 17
-
Re:Where is the Data?
Closest tidal gauge with long term data is Key Eest. The following alt-right false news site pretends the rise has been pretty steady for a century, which because of the complete lack of correlation with CO2 emissions is of course proven a lie by scientific consensus.
http://www.psmsl.org/data/obta...
If you look at some more of their lies there are stations with longer history which show sea level rise has been steady for well over a century.
-
Especially question flooding linked to sea level
If you look at data for Fort Denison in Sydney for example, they show a rise of around 0.25 feet over 100 years.
If you look at that graph even more closely, you'll find something pretty interesting.- the sea level is pretty stable up until 1950 or so, where it takes a large rise and then remains fairly stable thereafter (draw your own fit line from 1860 to 1950, then from 1950 to 2010).
So since 1950 there has hardly been a rise at all, at peaks a 50 *mm* increase - that is just 0.003 feet!
Just how is that much sea level rise supposed to result in any flooding above and beyond the huge variance that is tidal levels?
In any coastal city I have seen it would take feet of sea level rise, at least, to cause any real long term worry for a city and then only during larger storm events (which has not changed due to global warming, despite what people would have you believe).
-
Re:The Seas AREN'T Rising..
-
Re:Why? Data doesn't support
Then you didn't dig far enough. Their article is based on this paper which says its "research builds on a growing body of literature which suggests that SLR is occurring at a more rapid pace than even some of the more liberal projections can account for". So - accelerating sea level.
That's not what the part you quoted says; the rate isn't increasing, it's just that the rate is higher than expected.
Reading further, they actually do claim an acceleration - but it's on the order of mm per year per decade; far to small to readily see on the graphs PSMSL offers. A specific example is given as Virginia Key, FL (From 3+/-2 mm/yr to 9+/-4mm/yr in the past decade) and if you stand back and squint you can kinda see an upward trend. I'm sure analyzing the actual tabular data directly makes the trends easier to see, but that's an exercise for the reader.
=Smidge=
-
Re:Why? Data doesn't support
Battery Park in Manhattan shows effectively ZERO acceleration over the last 150 years or so, but I guess that's not an exciting Gloom And Doom headline...
So Battery Park is a suitable proxy for sea level rise around the world? I think not. Meanwhile sea level measurements from satellites do show an acceleration in SLR.
-
Re:Why? Data doesn't support
Battery Park in Manhattan shows effectively ZERO acceleration over the last 150 years or so, but I guess that's not an exciting Gloom And Doom headline...
It's speculation. It's rarely based on anything real.
-
Why? Data doesn't support
Battery Park in Manhattan shows effectively ZERO acceleration over the last 150 years or so, but I guess that's not an exciting Gloom And Doom headline...
-
Re:silver lining
It takes a lot of massaging to get to that from raw long term datasets like this :
-
Re:6.5 inches by 2100?
You are right. Since the 1906 earthquake sea-level at San Francisco has risen at 2.0 ±0.2 mm/year (7.1 to 8.7 inches per century), and there's been no "acceleration" in rate, at all.
The claim that higher CO2 levels cause significantly accelerated coastal sea-level rise is falsified by the measurement data.
Here's a graph showing sea-level measured at San Francisco juxtaposed with CO2 level:
https://www.sealevel.info/MSL_graph.php?id=san+francisco&boxcar=1&boxwidth=3&c_date=1906/5-2019/12
That includes both global sea-level rise (about 1.5 mm/yr) and local subsidence (my guess is about 0.5 mm/yr, though Prof. Richard Peltier estimates 0.32 mm/yr [ICE6G/VM5a] or 0.42 mm/yr [ICE5Gv1.3/VM2]).
As you can see from the graph, CO2 level has no perceptible effect on the (minuscule) rate of sea-level rise.
The rate of sea-level rise at San Francisco is slightly higher than average (because of subsidence), but the lack of acceleration is typical. Most sites have seen little or no sea-level rise acceleration since the 1920s or earlier. Coastal sea-level is rising no faster now, with CO2 level at 407 ppmv, than it was nine decades ago, with CO2 level 100 ppmv lower.
Although the Earth's climate has warmed modestly, the increase in CO2 level and the resultant warming have had no detectable effect on the rate of sea-level rise. -
Re:read the title at least dipshit
Did you actually read any of those links from WUWT? As usual, what that blog claims and what the papers really say are often quite different. Here, let me list them for you, along with quotes from their abstracts:
Jevrejeva, Moore, Grinsted, and Woodworth 2008:We provide observational evidence that sea level acceleration up to the present has been about 0.01 mm/yr^2 and appears to have started at the end of the 18th century. Sea level rose by 6 cm during the 19th century and 19 cm in the 20th century... the latest Intergovernmental Panel on Climate Change (IPCC) estimates of sea level are probably too low.
Over the same period [1958-2014], the reconstruction shows a positive acceleration of 0.07 ± 0.02 mm yr^2
Dieng, Cazenave, Meyssignac, Ablain 2017:
An important increase of the GMSL rate, of 0.8 mm/yr, is found during the second half of the altimetry era (2004–2015) compared to the 1993–2004 time span, mostly due to Greenland mass loss increase and also to slight increase of all other components of the budget.
Chen, Zhang, Church, Watson, King, Monselesan, Legresy & Harig 2017:
Here we show that the rise, from the sum of all observed contributions to GMSL, increases from 2.2 ± 0.3mmyr1 in 1993 to 3.3 ± 0.3mmyr1 in 2014. This is in approximate agreement with observed increase in GMSL rise, 2.4 ± 0.2mmyr1 (1993) to 2.9 ± 0.3mmyr1 (2014), from satellite observations that have been adjusted for small systematic drift.
The single cited paper that didn't solidly confirm the accelerating rise of global mean sea level was Holgate 2007, who merely found "high variability in the rates of sea level change", and suggested that the first half of the 20th century rose a little faster than the second half. But that study was based solely on just nine "carefully selected" tide level gauges (where the selection criteria are thinly described at best).
-
Re:An interesting prospect, but also an edge case
Yes the horrific sea level rise in Tuvalu is documented here http://www.psmsl.org/data/obta... Note according to the summary the sea level is rising here at twice the global average. By drawing a trend line the people of Tuvalu may need to be worried about the increasing sea levels in about year infinity. There was an article about GW and the rising sea levels where I saw a comment that those who thought such claims may be jumping the gun were told that they had lost 1/2 their school to the rising sea levels. (Sorry I forgot where it is so cannot link it.) This is what is known as ignorance gone to seed. I will say that average sea level is probably not too concerning but rather peak sea level as if you get flooded once a year it could be bad.
-
Cue the World's Smallest Violin
Permanent Service for Mean Sea Level: Christmas Island I
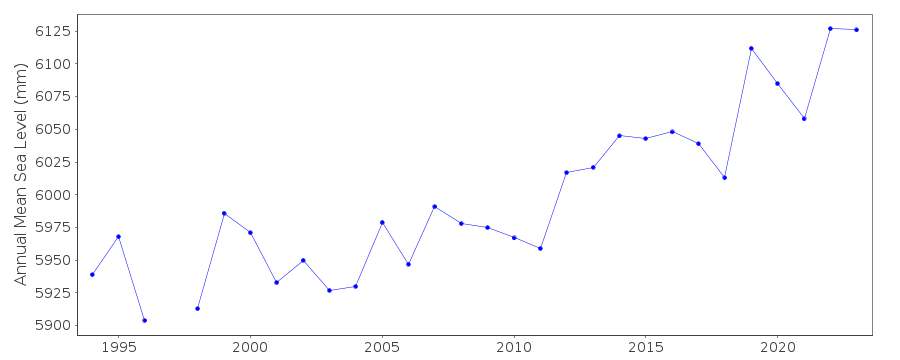
Permanent Service for Mean Sea Level: Christmas Island IISpot the clear blub blub trend, Try hard. ~1mm rise per year. Maybe.
Meanwhile a typhoon could arrive next year with a 8 foot storm surge that swamps the atolls completely.DISCLAIMER: Grew up in the Caribbean, nailed doors shut from the inside and held on tight for Hugo and Marilyn. People died. '~1mm/yr climate refugees' on a coral atoll really sound like whiny scammers to me. In terms of threat level it's like that movie, Frogs.
-
Cue the World's Smallest Violin
Permanent Service for Mean Sea Level: Christmas Island I
Permanent Service for Mean Sea Level: Christmas Island IISpot the clear blub blub trend, Try hard. ~1mm rise per year. Maybe.
Meanwhile a typhoon could arrive next year with a 8 foot storm surge that swamps the atolls completely.DISCLAIMER: Grew up in the Caribbean, nailed doors shut from the inside and held on tight for Hugo and Marilyn. People died. '~1mm/yr climate refugees' on a coral atoll really sound like whiny scammers to me. In terms of threat level it's like that movie, Frogs.
-
Re: Refugees? Not so much.
The actual sea level data shows little if any increases. It's a nice sinusoidal function that tracks a 24 year period. The ONLY way you can get that data to show sea level rise issues is with a linear regression and a terrible R^2 of 0.11 (meaning - you're trying to fit essentially random data with a straight line). The sea level isn't changing.
-
Re:AGW deniers...
Take a look at the actual sea level data from Majuro records. The data fits a nice non-inclining 3rd order sinusoidal function with peaks and dips in the average sea level. And no sign of acceleration (unless you do a linear regression with a terrible R^2 fit of 0.11).The sea level isn't really rising much, if any. If the level of the atoll is falling, it's either subsidence or natural decline that comes from living on a pile of coral in the middle of the ocean.
-
AGW is measurable
The ocean has continued to rise in the meantime at the same rate it has since 1650, about 3mm per year.
Wrong, on at least two counts.
First, the oldest ocean height measurement started in 1700 in Amsterdam, and it recorded no change until 1819 (if 1820 had been picked, then it would have fallen). Second, after 1819, the rise at Amsterdam was less than 1mm per year until 1900.
Second, using more recent measurements, we're told that "For the period between 1870 and 2004, global average sea levels are estimated to have risen a total of 195 mm, and 1.7 mm ± 0.3 mm per year, with a significant acceleration of sea-level rise of 0.013 ± 0.006 mm per year per year." Perhaps your 3mm per year is for the accelerated rate, which corresponds to the end of that period.
-
Re:They're gonna feel like...
Sure thing; as if there wasn't an avalanche of research that anyone with 5 minutes couldn't Google up for consumption. *rolls eyes*
Laury Miller and Bruce Douglas "On the rate and causes of twentieth century sea-level rise" Douglas has several seminal papers on the subject.
Permanent Service for Mean Sea Level -- if you want the raw data itself
Scientific reticence and sea level rise
The Impacts of Sea-Level Rise on the California Coast60+ references on Current Sea Level Rise @ Wikipedia (yeah, it's wikipedia; take the article with a pillar of salt and read the referenced papers and articles instead.. durrr)
With respect to the original gp post, the PSMSL dataset "defined the following criteria for selecting records from the PSMSL which were long, reliable, and avoided large vertical geologic changes:"
1. Each record should be at least 60 years in length
2. Not be located at collisional plate boundaries
3. At least 80% complete
4. Show reasonable agreement at low frequencies with nearby gauges sampling the same water mass
5. Not be located in regions subject to large post-glacial reboundSo, yah, I think the scientists took into account the obvious issues asked about by the gp: "Is the sea level rising? Or are plate tectonics lowering the land level in relation to the sea?".
Need more? Or is that enough to keep you busy reading for a little while?