 Slashdot Mirror
Domain: realclimate.org
Stories and comments across the archive that link to realclimate.org.
Comments · 1,734
-
Re:A wake up call
Yes, the world is warming, on average, but what kills is not the average temperature rising by one or two degrees, its drought,
extreme events such as storms, ocean acidification, etc. The danger is that people think we're heading for a Mediterranean climate here in N Europe, etc. and that global warming might not be a bad thing for chilly Ireland, for example, when massive droughts and crop failures (across Europe and elsewhere) are starting to threaten global food supplies.Any evidence that those are happening on a more frequently scale than usual? I hear the usual fears and I see the usual lack of evidence. Confirmation bias is an ever present threat under these circumstances.
Yes, but it is and will be probabilistic. See for example this on the Moscow heat waves, for example, and the discussions at RealClimate. Attribution studies are very expensive (in time and money, for computing ensembles), but are a key body of work over the last few years, and there is a section of the upcoming IPCC AR5 report summarizing it. The IPCC reports are
the best summary of the science, even though they are very conservative.And the term, anthropogenic climate change mixes a number of human activities. Sure, AGW, desertification, and deforestation (to name three problems with likely global impact which would fall under the umbrella term above) have synergistic effects. But lumping them all under one category as you do here, doesn't help us figure out which activities are causing which problems or how to use our limited resources best to mitigate the effects of what we're doing.
Yes, and I didn't go into details. I didn't mention desertification or deforestation, for example, but you're right about synergistic effects. For example I've been working providing data to a group at NUI Maynooth" studying the effects on forests: the (measured and predicted) lengthing growing season leads to multiple generations of tree-predating insects surviving. Some species may have difficulty surviving this, so foresters need to know 30 years in advance what species to plant.
In particular, bad policy has been a remarkable driver of higher costs and fairly often confused for an AGW-related harm. For example just from the US, food prices have been driven up by ethanol subsidies for corn (which simultaneously drives up the price of corn, the price of gas, and reduces the availability of food) and the total cost of damage from cyclonic weather and flooding has been driven up by US government flood insurance policy (which still subsidizes to some degree construction in flood-prone areas).
Yes. The numbers I've seen say that the shortfall in wheat due to the Russian heatwave in 2010 equalled the crop production in Europe diverted to make ethanol under EU policy for 5% ethanol mix, for example.
Its ironic that the denialists
Yet another anti-scientific propaganda term. I find it a bit hypocritical to complain about the scientific basis of criticism of AGW while simultaneously using language that discourages scientific thought.The problem here is that there is a wide range of criticism of AGW from simply claiming it doesn't exist to disputing the claims of harm from global warming. I agree that some degree of anthropogenic global warming is occurring (though the basis for such a claim is much shakier than proponents are willing to admit), but I don't agree that the harm from AGW is as great as claimed.
Non-scientific, yes. The terms "sceptic", "denialist","AGW believer",etc are not pro- or anti-scientific, they're political.
And I will not shy from the politics. There are simply n -
Re:On the whole
Your ignorance of the topic is monumental. There's not even any reasonable place to begin. You need to educate yourself on the actual facts, then we can talk about options and policy. Until then its pointless. Here, here's a free link. http://www.realclimate.org/ Enjoy!
-
Re:The political construct is unravelingThe source is FF lobbyists, TFA is a A grade bullshit, the author has a track record. The usual suspects in opinion columns around the world will all point to it (or more commonly each other) for the next year. When the report is published they will either ignore the fact they were wrong or insist it was a in "a draft"
The very notion of a secret draft plays into peoples biases, it also depends on people's ignorance of basic facts. Some easily verifiable facts:
The IPCC conducts it's business in the open and are more than happy to respond to a layman who spots a trivial typo in a draft (as I did circa 2001).
They're expecting ~100K review comments this time around.
The thousands of scientists and others involved do not get a dime from the IPCC, all work is donated (aside from 3-4 permanent office staff).
The IPCC's accounts can also be found via that link.
Their $5-6M annual budget comes from donations by the governments of over 100 countries of all political stripes. Somewhat ironically the bulk of it is spent on airline tickets..The political construct is unraveling
The headline hit the nail on the head, but I'm pretty sure it's not the nail the GP was aiming at.
-
Exploding bullshit detector here...
-
Re:Only 8%?
Ah, I see the problem. You've mixed up the "local absence of evidence" with the "global absence of evidence". Allow me to explain:
A "global absence of evidence" is where a person makes a statement for which no evidence supporting their claim exists.
A "local absence of evidence" is where a person makes a statement for which evidence supporting that claim exists, however they did not provide the evidence (or a reference to where that evidence can be obtained from).
To demonstrate the difference I can make the following statement in a Slashdot comment:
"The Earth revolves around the Sun."
The above statement is obviously true, but I have provided no evidence nor any references to evidence. In the example above there is a "local absence of evidence", but if we go to the scientific journals we will find that there is an abundance of supporting evidence is available. The same is true of Black Parrot's comment; the evidence supporting Black Parrot's statements exists, it just wasn't provided in this thread.
To that end I suggest you start looking for evidence at RealClimate. The articles are well written and frequently cite papers published in scientific journals. -
Re:Lack of rigor in sticking to scientific method
And yet temperature are still within the margin of error of the GCM's projections. It might benefit you to read these FAQ's on GCM's so you understand how they work better.
http://www.realclimate.org/index.php/archives/2008/11/faq-on-climate-models/
http://www.realclimate.org/index.php/archives/2009/01/faq-on-climate-models-part-ii/ -
Re:Is there enough data
I used to read WattsUpWithThat some 4 or 5 years ago but found it was mostly a waste of my time. Lindzen and Choi have a history that's not particularly encouraging so I take what they say with a grain of salt. Here's a critique of their 2009 paper.
-
Re:I save money!
No cherry picking involved. rgbatduke talked about Hansen's predictions over 35 years or so and that's the closest I could find. If you want a comparison of Hansen's 1988 model (which was much more sophisticated than the 1981 model) you can find it here along with data comparisons to other models. Scroll down to the "Hansen et al, 1988" heading. Hansen was still more right than wrong especially when you consider that he used a climate sensitivity of 4.2 rather than around 3 which is considered the best estimate today.
-
Re:I save money!
I don't know where you get your information about Hansen but even his simple model from 1981 isn't that far off.
-
Re:Cause?
Global CO2 levels have been this high before...volcanic spikes can be even larger still..
Volcanoes release 130 million tons of CO2 per year, while the burning of fossil fuels releases 9 billion tons per year.
I am talking about the full system models that purport to predict global temperature a distance in the future, care to provide an example of one of those that has predicted within 10% (of the change, not the absolute, of course) over a 5 year window?
Hansen's 1988 model was about 10% higher than actual forcings growth.
-
Re:Sounds more like a slam against Penn State admi
The decline is not hidden from anyone who has enough scientific background to go read the original papers. The "hidden" data is included in the paper and it is explained why they are not used. The words "hide the decline" refer explicitly to not using the data since it was shown to be wrong by other measurements. To quote the scientists over at RealClimate:
As for the ‘decline’, it is well known that Keith Briffa’s maximum latewood tree ring density proxy diverges from the temperature records after 1960 (this is more commonly known as the “divergence problem”–see e.g. the recent discussion in this paper) and has been discussed in the literature since Briffa et al in Nature in 1998 (Nature, 391, 678-682). Those authors have always recommend not using the post 1960 part of their reconstruction, and so while ‘hiding’ is probably a poor choice of words (since it is ‘hidden’ in plain sight), not using the data in the plot is completely appropriate, as is further research to understand why this happens.
-
Cherry-picking == Fail.
Two huge problems with this argument:
+ That tree ring data is for summer temperatures only -- not all year around.
+ Scandinavia (what you call norway) is a poor proxy for the entire world.
This is obviously cherry-picking. See the full story here.
Also, click on the parents link, and note that it fails to offer an explanation. -
Materially false
The hockey stick graph was independently validated by nearly a dozen different reconstructions.
-
Re:Suprising how?
There is something of a data set that can be used for climate models, but such models certainly aren't perfect and have a whole bunch of assumptions in them that deserve questioning as well, particularly because the predictions of those models are frequently unreliable.
I think you fundamentally misunderstand climate models. They essentially don't use data. They are not exercises in statistical curve fittings. As much as possible they use the actual physical relations derived from studying climate. Climate data is only useful to climate models for comparing to climate model output. For the most part climate models are doing a decent job.
Here are a couple of FAQ's from one of the major climate modelers for your edification:
http://www.realclimate.org/index.php/archives/2008/11/faq-on-climate-models/
http://www.realclimate.org/index.php/archives/2009/01/faq-on-climate-models-part-ii/ -
Re:Ice Tea...
If by "minimal warming affect" you mean a few degrees, then yes, that's what all the fuss is about. Well, the few degrees of world temperature, which is an average of more varying data from many locales. There are some predictions of what will happen. How minimal or horrific those are depend on your definition of "minimal" and "horror;" whether we're talking 20 or 200 years; and, for some, whether they live there or not.
-
NSIDC hasn't called the record yet
If you read response #4 of this update from Real Climate, you will see that the National Snow and Ice Data Centre hasn't called the record low yet (as of 26 Aug 2012 at 12:04 PM), since they use 5-day moving averages on their graphs. The graph referred to by the realclimate.org update and I think in the OP is based on daily data. The response is from Walt Meier of the NSIDC. I'll quote it here:
These are daily values, not the 5-day average, which is not quite at a record yet. Using a 5-day average removes some of the noise due to weather and other effects that cause small errors in the daily values. Thus the 5-day estimate is a more robust measure of sea ice changes. We will make an announcement on our web site when we have passed the current record: http://nsidc.org/arcticseaicenews/
Walt Meier
NSIDC
I think however that there are other data series that do agree that the record has been broken, even with 5-day averages. Here is my favourite data compilation for Arctic Sea Ice. It contains many different graphs from different sources. Taken together, the data paints a disturbing picture.
-
Re:Bulletproof cage that accepts no dissent
Seriously, you don't understand models very well. It appears you think models are just an exercise in curve fitting, in other words statistical models. Climate models are physical models in that as much as possible they use the actual mathematics that describe the physical interactions they are trying to model. When the data (aka observations of the real climate) don't match the model's output they investigate the underlying physical reasons it doesn't match and try to improve their understanding. Try these FAQ's for better understanding of how climate models work:
http://www.realclimate.org/index.php/archives/2008/11/faq-on-climate-models/
http://www.realclimate.org/index.php/archives/2009/01/faq-on-climate-models-part-ii/ -
Re:Hansen again?
That just shows you don't have a clue about what climate models do. Read the following and educate yourself if it's not too far above your reading level:
http://www.realclimate.org/index.php/archives/2008/11/faq-on-climate-models/
http://www.realclimate.org/index.php/archives/2009/01/faq-on-climate-models-part-ii/ -
Re:Average the measurements before you take them
Data, in particular temperature records are not data that is input into climate models. Climate models attempt to model the physics of the atmosphere and its interaction with the land and oceans. Generally they are given a starting state and set loose to see what the results are. The only input is various realistic scenarios that simulate changes that would be seen in the real world such as changes in the level of CO2. Everything else is internally generated.
It's kind of hard to take you seriously when you make it obvious you don't know what you're talking about. Here for your edification are two FAQs on climate models by one of lead authors of the NASA/GISS ModelE GCM:
http://www.realclimate.org/index.php/archives/2008/11/faq-on-climate-models/
http://www.realclimate.org/index.php/archives/2009/01/faq-on-climate-models-part-ii/ -
Re:Not entirely.
Actually they are found on the see floor sediment and the arctic permafrost. There are two primary different types.
http://www.realclimate.org/index.php/archives/2005/12/methane-hydrates-and-global-warming/
-
"Objective" = ignorant?
I've observed that people who regard themselves as climate science "skeptics" generally insist that one should disregard information provided by web sites run by experienced scientists who have studied the primary literature in depth and have concluded that the scientific consensus on the nature and hazards of global warming is broadly correct. Apparently, in "skeptic speak," having studied the evidence enough to have formed an opinion constitutes being "biased" (presumably, only ignorant people can be "objective"). So sites such as RealClimate, Skeptical Science, Open Mind, the IPCC web site, and the the NASA GISS web site are all out of bounds. Of course the distinguishing feature of climate science "skeptics" is that (unlike the skepticism of successful scientists) their skepticism is quite one-sided, and they become quite credulous when it comes to anything that seems to cast doubt on climate science--so they will happily cite sites like "WUWT."
But I cite SkepticalScience not as a source of opinion (I've already stated my opinion) but because that it is a site that provides good links to published reports that contain the evidence supporting my opinion. Nevertheless, it happens that I've personally reviewed many of the summaries provided on SkepticalScience and have compared them to the primary literature, and I find that SkepticalScience tends to be reliable and accurate, and a fair reflection of the consensus opinion of working climate scientists. This is in dramatic contrast to my experience at WUWT and other "skeptic" sites, where I often find that descriptions of the published literature are highly misleading, sometimes in ways that appear to me to be intentional.
Take a look at the chart they're using vs a google search [google.ca] for the same chart. Why is their chart different than the rest? All the other charts show that real temperatures most closely match Hansen's scenario C, which involved CO2 emissions ceasing to increase past 1990.
And here we see an example of why a site like SkepticalScience is useful, particularly compared to a Google search, which often turns up frequently-repeated misinformation. If you doubt that SkepticalScience is accurately reporting the models, all you have to do is click on the link, and it will take you to the original paper by Hansen. And if you doubt that the GISS data is accurate, you can click on the link, and it will take you to actual GISS data. Moreover, it is quite obvious just from looking at the short term variation of the models that Scenarios B and C diverge only slightly up to the present day, so it is impossible that we could have temperature data that would differentiate between them. However, the question of whether there is any evidence of the warming trend "leveling off" as described in Scenario C (which was calculated for an unrealistically optimistic scenario of CO2 mitigation that does not at all correspond to reality) can be addressed statistically by mathematically subtracting known sources of short term variation, and the answer is "No."
By the way, one way in which real scientific skepticism differs from climate science "skepticism" is that real scientists are skeptical of even their own work, and often acknowledge errors and revise their conclusions in the light of new evidence and better analysis. So, for example, based on subsequent work, it is now generally thought that
-
Re:One Sided science
Which one? The models keep getting changed every time the predictions fail to match what the climate is actually doing.
Are you saying we should just adapt one final climate model and refrain from improving it when new evidence comes along?
It appears you fundamentally misunderstand climate models, thinking they're statistical models doing curve fitting rather than the physical models that they are. Here's a couple of FAQ's to help enlighten you:
http://www.realclimate.org/index.php/archives/2008/11/faq-on-climate-models/
http://www.realclimate.org/index.php/archives/2009/01/faq-on-climate-models-part-ii/ -
Re:Scientists and "skeptics"
Most of the predictions of temperature change due to CO2 have been far, far off (The Earth should be far warmer if the models were right). Making expensive decisions on the basis of utterly failed prediction models is stupidity itself.
In fact this is not true, as you would have seen if you'd read the article I cited.
This is an excellent illustration of how global warming "skeptics" differ from actual skeptics. A true skeptic would look skeptically at the record of predictions of both sides of the debate. They would note that climate scientists predicted the timing of the temperature increase, the approximate magnitude, the rise in the oceans, the loss of arctic ice, and even numerous details about the pattern of warming, such as that warming would be greater at night than day (whereas the reverse would be the case if a change in solar radiance were responsible), and that surface warming would be accompanied by cooling at high altitudes. In contrast, industry funded professional doubters of science insisted after every new temperature record that the warming was merely a temporary weather fluctuation, that the trend was beginning to turn down, that arctic ice was on its way to recovery. Even now, when the warming trend has become so clear that no rational person can deny it, the same people consider to insist that the warming has some other cause (what? they don't know, but whatever it is, it must be "natural"). As the weather consequences predicted by the scientists begin to emerge (more frequent extreme weather events, and particularly more heat related events, more strong storms, more frequent flooding), they continue to insist that it is only coincidence.
But the climate science "skeptic" says, "Yes, the very earliest global climate models predicted global warming, but they were a bit off on the magnitude of the warming, so therefore climate science is all wrong, and we don't have to worry about mitigating CO2 pollution."
-
Re:Scientists and "skeptics"
Because concerns about CO2 are not based solely (or even primarily) upon curve-fitting the past temperature record. They are based upon the physics of radiation and the physical properties of CO2 and water vapor, the fruits of a huge mass of research carried out in the century since the potential of CO2 to modify climate was first recognized by scientists--science which predicted the modern warming over 3 decades ago, before it became so glaringly evident in the temperature record.
-
Re:Headline should say...
Don't worry, we're doing that experiment at the macro scale right now. The results will be interesting (in the sense of "May you live in interesting times.")
-
Re:Headline should say...
Solar variation is easily measured, in detail since satellites went up in the 1970s, fairly regularly from the surface back into the 1950s and less regularly back into the 1800s. It can also be estimated from sunspot records that go back about 400 years. From measurements we know the Sun currently hasn't varied enough to account for current global warming. In fact if anything solar output is declining right now and has been since a peak around the middle of the 20th Century.
Orbital variation, precession and other Milankovitch Cycle cycles act on multi-millennial time scales (the shortest being over 25,000 years for a full cycle). They are not particularly relevant on century time scales.
I think you have it backwards. Models are tools we use to test our understanding of the physical science we've discovered through observation. Models aren't perfect but they're better than any other method we have and so far they're not doing that bad. Every year Real Climate posts an update and commentary on a comparison of climate model output to actual date. Here is the latest one updated with 2011 data.
-
Re:Headline should say...
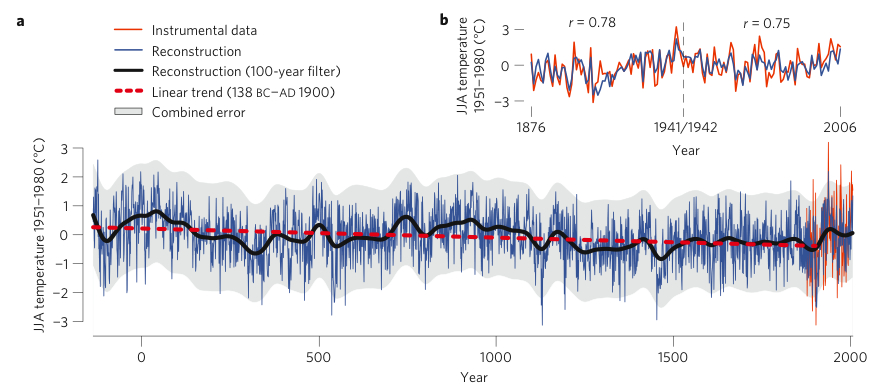
Indeed, RealClimate notes that if you remove dendrochronology records from Mann et al (2008), you actually get a lesser pre-industrial cooling trend. Of the dozens of independent lines of evidence, tree rings have long been one of the *least* suggestive of disproportionately high GHG forcing versus other forcings, so it's always funny to see them called out as though the case for global warming rests on them.
More importantly, while no number of peer-reviewed articles suffice to convince certain people that global warming is happening, a single peer-reviewed article that can be spun as casting doubt on it suffices to convince those same people that it *isn't* happening.
-
Re:Headline should say...
Don't make the mistake of extrapolating the graph to represent the globe. It's derived from a series of Northern Scandinavian proxies using Maximum Latewood Density. It's just a small piece of evidence in a vast sea of data. BTW, here is the graph in more detail with error shading.
-
Re:Headline should say...
Careful there sycodon, the graph you reference is for one series of proxies from Maximum Latewood Density in Northern Scandinavia. To try and extrapolate that to something global is quite a stretch. Here is the same graph with details and error bars included. As Rei noted the recent RealClimate post is interesting on this subject.
-
Try RealClimate's take on the paper
Read RealClimate's coverage.
Basically, there was some growing problem (no pun intended) with tree-ring based temperature studies, and this study helps figure out how to take into account those problems, and a probably cause.
-
Re:Headline should say...
Indeed, RealClimate notes that if you remove dendrochronology records from Mann et al (2008), you actually get a lesser pre-industrial cooling trend. Of the dozens of independent lines of evidence, tree rings have long been one of the *least* suggestive of disproportionately high GHG forcing versus other forcings, so it's always funny to see them called out as though the case for global warming rests on them.
-
Misleading
Real Climate has a much more interesting take on the paper:
Finding the weak points in various temperature proxies and using that knowledge to improve the overall accuracy of the temperature record is a good thing, and a normal part of the scientific process. Sensationalist reporting of the type The Register engages in just serves to inflame the debate without adding anything useful to the discussion.
-
Re:Have they actually found it?
"Who the hell knows. Given the fact that you can't get your hands on the original datasets without the right secret handshake or whatever it is that climate scientists use to identify each other they could be doing just about anything,"
Let me Google that for you.
http://www.realclimate.org/index.php/data-sources/
By the way, remember the Berkeley statistician who was a skeptic about global warming and the methodologies by the climatologists? He got their raw data and processed it in what he believed was the right way. The answer came out the same as the mainstream climate community said. They aren't lying, or faking.
-
Re:Overall rise
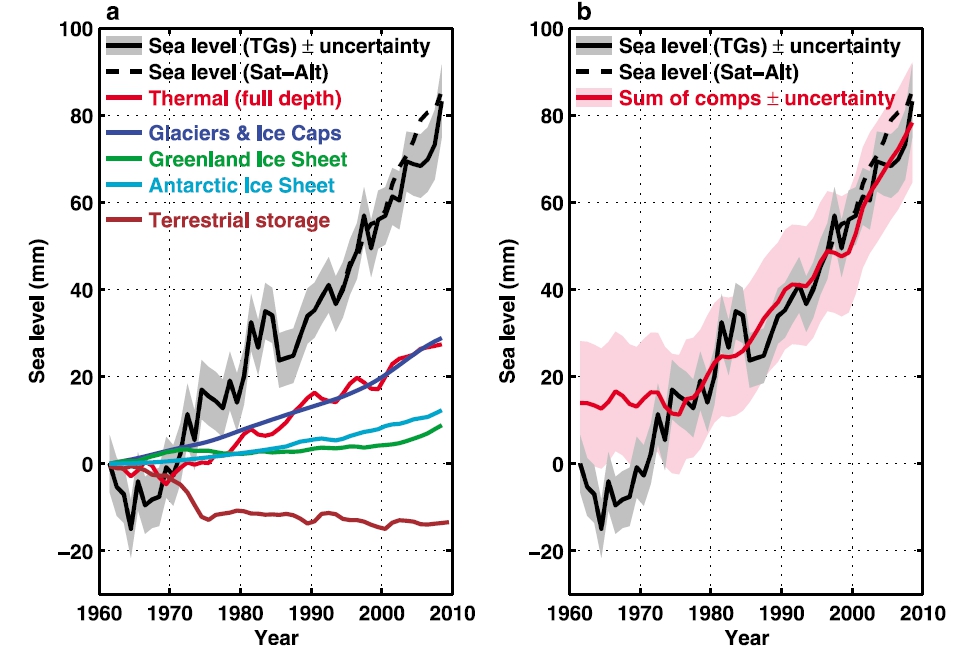
A recent post on RealClimate has a graph of the components of sea level rise. Thermal expansion and ice melt are about equal in their contribution so as a rough guess you can double the thermal expansion number.
-
Re:Error bar or Confidence interval?
That question just shows how badly you misunderstand what climate models do. What they mostly do is project what the 30 year running mean temperature average of the globe will be given the various input scenarios they use. Try reading the climate model FAQs to increase your understanding:
http://www.realclimate.org/index.php/archives/2008/11/faq-on-climate-models/
http://www.realclimate.org/index.php/archives/2009/01/faq-on-climate-models-part-ii/ -
Re:Error bar or Confidence interval?
Climate models are one way of testing climate related hypotheses by synthesizing what we currently think we know about climate into a coherent whole. In general they do better at projecting the future than simpler methods. There may be "trillions" of variables affecting climate but once you get past the 5 or 10 biggest factors the rest are just vernier adjustments. As for the rest of your post, heat (and visible light) reflected from clouds is measurable but it's difficult to do on a global scale, we know something about how solar activity affects the planet and are learning more all the time and the change in pH of the ocean is a direct measurement of carbon dioxide trapped by the ocean. To me it is an example of hubris that you think you know more than actual climate scientists.
-
Anti-science: Winning heats and confusing mindsScientists are not immune to confusion but they're generally more willing than most to own it.
The way the measure temps is laughable
I suggest that what you are doing is trying to understand the issue by reading people like Anthony Watts and their manafactured contraversies are confusing you. Here's a link to a very simple NASA experiment you can do yourself, it anhilates the ashpalt and concrete argument, Watts' recation to that debunking was to start issuing false DCMA take downs to hide it. Watts is just wrong and refuses to aknowledge it for political/financial reasons, however the database that Watts has is the best available survey of the current state of US wether stations, so he has contributed something positive. Unfortunately there is a lot of potential for error in his own survey so it's unlinkely it would be very useful as a way of measuring improvement (or otherwise) of the infrastructure.
This is not to say that the urban heat island effect is a fantasy, it's just that climate scientists discovered it decades ago because it's fucking obvious!!!! In fact the MET reseach center that was at the center of the climategate beat-up and accused of "tampering with the raw data" has spent over two decades maticuosly transcribing the raw data set (multiple times with different transcribers to cross-check) and looking for precisely these kinds of anomolies. Unlike Watts and his army of amature photographers they are world renowned experts in sources of observational error wrt to weather staions and they back that up by frequently publishing in top tier journals such as Nature and Science. It's extremely tedious work and is replicated by an independent team using different statistical methods at NASA. These are the two main historical temprature sets, the enourmous amount of work that goes into verifying them is why the rest of the scientific community trust and applaud them.I am fed up with these idiot scientists
The cure for that is to get your information from the horse's mouth
I blame scientists for this
Which is exactly what the anti-scientists who manafacture these 'contrversies' want you to do, they paint scientists as both complete morons, omnipotent conspirators or grant leeches hoping you will buy one or the other demonization and join their army of useful idiots. The 50 or so stink-tanks in the US who generate most of these climate myths, they have powerfull supporters in congress such as senator Inhofe. They use the exact same play book that was used for decades to deny that smoking causes cancer, it's the same play book creationists use. Why is it the same play book? - Because some of these stink-tanks such as the heritage foundation are paid to do it by the three different groups of deniers. Winning heats and confusing minds, it's how these stink-tanks earn a living.
Now as for the supposed claim (didn't RTFA) that AGW has caused Moose populations to drop dramatically, if the orginal work was published in a peer-reviewed journal I'm inclinded to think the journalist added that bit of confusion all by himself. A hard core cynic might even think it was inserted to distract from the real cause of the Moose decline but it's much more likely that the journalist was just manafacturing his own little contraversy to grab eyeballs and/or appease sponsers. If you want good investigative journalisim that gets to the bottom of these 'climate contraversies' I highly recommend Peter Sinclair's youtube series climate crock of the week. -
Winning hearts by confusing minds.
Cut pollution for the sake of cutting pollution.
Problem is, a large number of people don't consider CO2 to be a pollutant.
There seems to be so much conflicting information out there as to what the cause is or how to reduce it, it seems hopeless
Yep, life is messy and it's often hard to find a candle in the dark, it's full of blatant self serving liars such as the one in the linked video who on the surface appear to be reasonable common sense folk, to deal with with this avalanche of intellectual dishonesty from proffesional propogandists, and avoid being drafted into their particular army of useful idiots, you can either...
1. Pick the side that best matches your politics/religion/fetish/wallet/eye-shadow/whatever and then firmly plant your fingers in your ears and start humming loudly.
2. Try to appease both sides from a seat on the fence. That's just the starting position, until you get past it, it's the equvalent of "who cares, lets just all be friends". If you actually care about the issue go back and re-choose from option 1 or 3 only.
3. Attempt to understand the issue to the point where you can routinely spot bullshit from both sides of the emotional divide, then draw your own conclusions. (see sig for further details).
If you picked option 1, you can stop reading now and use a dart board to negate your (valid) concerns. The third option is a bitch. The modern world is extrodinary evidence that it gives the best answers but stubornly refuses to deliver absolute certainty about anything. It also requires humility, time, work and critical thinking so from a practical stand point every one of us goes for option 2 in the majority of cases. (if you were redirected here from option 2 the only way out of an infinite loop is to admit you don't care enough to throw a dart)
As always if you don't understand a subject the best place to start looking is here. For a more nuanced understanding you need to look at what the scientific community are talking about. As a young man and HS drop out this is where I went wrong, I was interested in science and since the internet had not been invented, my next best option was the public library or the news stand.
All three sources of information on science conflate science with scams, speculation, and metaphysics. Even if you could somehow magically remove all the propoganda from amoral FUD factories trying to win hearts by confusing minds there is no way for an inexperienced amature-researcher to tell the difference between (say) Nature magazine and UFO monthly. So here is some advise from someone who desrted Uri Geller's army of useful idiots 32 years ago, and please feel free to use that grain of salt on it....
1. Find the primary source, if you can't, tag article as bullshit.
2. Compare the primary source to the article that lead you there, if they conflict, tag article as bullshit.
3. What is the track record of the primary source and is it peer-reviewed, ie: does it come from Nasa, the phycic hotline, or a random slashdot post such as this one?
4. Does other scientific literature from different primary sources confirm or debunk the claims?
5. Having done the above work in 1-4 you're now in a position where you actually have a reasonable understanding of the issue and you can pretty much ignore every thing other people say and make up your own mind confident in the knowledge you arrived at your position via reason.
6. Using the decision from 5 you can now apply it to any article discussing that particular 'talking point' and pretty much ignore them other than keeping an eye out for fundemental points you hadn't thought of (if that happens -
Re:If they were climate scientists...
Here ya go. Model to data comparison, 2011
-
Re:How is plankton a good carbon sink?
Is anyone actually recording the carbon isotope ratios in fossil fuels?
Yes.
From:
http://bgc.mpg.de/service/iso_gas_lab/publications/PG_WB_IJMS.pdf
In contrast, current annual fossil fuel burning amounts to about 6 Gt of carbon. About half of this amount is observed as an increase of the atmospheric CO2 concentration. The other half is sequestered by other compartments. Currently, both the oceans and the terrestrial system show a net uptake of carbon [6]. The oxygen and carbon isotopic compositions of individual components, in particular air-CO2 provide a potentially powerful tool towards quantifying the contribution of different components to ecosystem exchange. When this is used in conjunction with concentration or ïux measurements, further insight can be gained into the sources and sinks of CO2 in the ecosystem [7,8].
Plant photosynthesis discriminates against 13 C. In other words, plant carbon tends to have less 13 C than the CO2 from which it is formed (Fig. 1). This discrimination provides a tool for interpreting changes in 13C of atmospheric CO2
Also:
How do we know where the carbon comes form?