 Slashdot Mirror
Domain: climatechange2013.org
Stories and comments across the archive that link to climatechange2013.org.
Comments · 32
-
Re:Coal rockets and a gay ban in space?
During his confirmation hearing, he agreed that human activity “absolutely” contributed to climate change, but sparred with Senator Brian Schatz, Democrat of Hawaii, over whether it was “a contributor” or the “primary cause.”
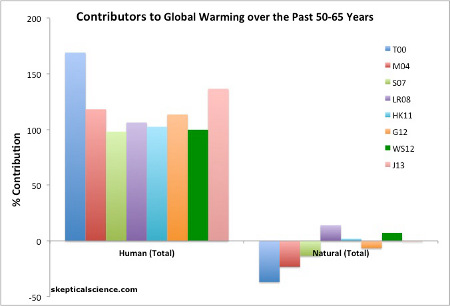
Scientists believe that it is extremely likely that most of the observed increase in global average surface temperature over the last half century was caused by the anthropogenic increase in greenhouse gas concentrations and other anthropogenic forcings together. In fact, some studies put the human contribution higher than 150%. That is, non-anthropogenic factors have had a net cooling effect. Human factors have caused all observed warming and also masked that cooling effect.
Mr. Bridenstine is promoting an extremely fringe position that isn't supported by the evidence. I'm not sure why we should celebrate that.
-
Re:Analyze all of the data
When they analyze all the data that exists, that's the opposite of cherry picking. [Geoffrey Landis]
Indeed. I made this same point after Jane/Lonny baselessly accused Layzej of "cherry-picking" when Layzej loaded all the UAH data. Jane/Lonny then suggested cherry-picking at 1998, and keeps insisting that this somehow isn't "cherry-picking".
Ironically, I even gave Jane/Lonny R code which calculates trends and accelerations of global mean sea level (GMSL) data. That graph accounts for autocorrelation- the red lines are 2 sigma uncertainties. The trends and accelerations are calculated over periods which all end at 2009.5. The new significance.zip (backup copies) contains my R statistics folder, including many data sets.
Again, note that this approach avoids cherry-picking by using the entire dataset. Also note that all the best-fit accelerations are positive.
Once again, that's consistent with this NOAA article:
"Sea level is rising at an increasing rate
And once again, that's consistent with the 2013 IPCC AR5 SPM:
"Proxy and instrumental sea level data indicate a transition in the late 19th to the early 20th century from relatively low mean rates of rise over the previous two millennia to higher rates of rise (high confidence). It is likely that the rate of global mean sea level rise has continued to increase since the early 20th century."
That's also consistent with the US NAS's statement that "Sea level is rising faster in recent decades".
-
Re:Just a PR release
Hmm. According to this article in the Guardian, it's 100% over the period of 1951 to 2010. Why 100%? Because over that period non-anthropogenic climate factors had a net cooling effect, reducing the impact of anthropogenic warming factors. So the net effect of anthropogenic climate factors was larger than the observed warming trend.
Their source for those figures was the IPCC AR5 report.
So, at least some of the time scientists are willing to give a specific answer to the question of "How much of the warming is caused by AGW?"
-
Re:Science versus politics
Point 1: Scott Adams pointed out that when asked the question "how much of global warming is caused by humans, and how much is natural" in debates and televised interviews, no scientist had an answer.
Getting your climate science from people yelling at each other on TV (or Scott Adams for that matter) is a bad idea.
From IPCC AR5, back in 2013: It is extremely likely that more than half of the observed increase in global average surface temperature from 1951 to 2010 was caused by the anthropogenic increase in greenhouse gas concentrations and other anthropogenic forcings together. The best estimate of the human-induced contribution to warming is similar to the observed warming over this period.
-
Re:50 million island people to be displaced by 201
So if someone could please post links to the most persuasive proof that we should all be worried about carbon dioxide levels, I'll take a look.
So far nobody has posted any links to CAGW proof....
I guess part of the problem is in what you consider to be proof.
This probably doesn't count, and if that didn't then almost certainly this won't either.
However, perhaps once you've read them you could let us know what their failures are, as specifically as you can, and what more you'd require for them to be considered 'proof'.
-
Re:icehouse earth
Of course you didn't read any of the material that shows that the postulations that the climate models that are driving the climate change hysteria are built upon are wrong,
Citation? To peer reviewed science, not some "auditor" or blog?
You also are not aware that the IPCC reports consistently say that we just don't know and that it's all speculation,
You want to brush up on your reading skills, what the IPCC actually says is:
It is extremely likely that more than half of the observed increase in global average surface temperature from 1951 to 2010 was caused by the anthropogenic increase in greenhouse gas concentrations and other anthropogenic forcings together. The best estimate of the human-induced contribution to warming is similar to the observed warming over this period.
http://www.climatechange2013.org/images/uploads/WGIAR5-SPM_Approved27Sep2013.pdf
-
Re:Does anyone have a list of the hottest years?
I've seen work from Nir Shaviv before. Right now his solar magnetic variability work is just a hypothesis. There is no known causative factor for that to drive climate. Come up with the causation link and you have a theory.
So I went and read the IPCC AR5 WG1 Summary for Policymakers. (Errata) As an aside I found this statement in it that supports my contention the the MWP wasn't globally well coordinated in time.
Continental-scale surface temperature reconstructions show, with high confidence, multi-decadal periods during the Medieval Climate Anomaly (year 950 to 1250) that were in some regions as warm as in the late 20th century. These regional warm periods did not occur as coherently across regions as the warming in the late 20th century (high confidence). {5.5}
Maybe I'm dense but you'll have to explain to me why the "SPM is at odds with the bulk of the document". If it's about natural climate forcings they get mentioned in the SPM although not particularly prominently. Section 8.4 of the WG1 report is titled "Natural Radiative Forcing Changes: Solar and Volcanic".
The fact that the RWP exists shows that NATURAL VARIABILITY is greater and faster than what we've seen over the last 200 years.
You're going to have to justify that statement scientifically for me to give it any credence. I've never seen any evidence for that.
What the global mean temperature should be is an irrelevant question. The issue is the rate of temperature change is far faster than natural and human systems can adapt to easily. If you took the temperature change expected over the next 200 years with BAU and spread it out over 2,000 years or more it wouldn't be nearly as big a problem.
To bring this back to a single thread I'll respond to your 2nd message here.
Denier is a perfectly good descriptive word that can apply to many types of denial. Holocaust deniers, climate science deniers, anti-vaxxers (vacine science deniers), creationists (evolution science deniers), moon landing deniers and many more. I'll continue to use it when I think it's appropriate.
Perhaps you could learn some statistics and look at the respective probability distributions and look at the expectation values. If you can. 'Cause at the moment you statement shows a clear ignorance of the significant difference. Furthermore, you don't seem to be aware of the evolution of the IPCC's position from insane back somewhat to observational reality as shown by Lewis and Curry.
I went to the WG1 report (it's big, took me over 10 minutes to download) and looked at what it has to say about climate sensitivity. On page 1110 there is a graph of different measurements of equilibrium climate sensitivity. The give the likely range at 1.5 to 4.5 C. They included "Lewis, N., 2013: An objective Bayesian, improved approach for applying optimal fingerprint techniques to estimate climate sensitivity. J. Clim., doi:10.1175/JCLID-12-00473.1." in the graph. The range for that is still mostly within the IPCC range. That apparently isn't the Lewis & Curry paper you are referring to but as I said the range for L&C is 1.04 to 4.05 K, largely within the IPCC likely range.
I'm well aware that the IPCC's position on ECS has evolved over time but an ECS of about 3 C has always been near the middle of the range.
Actually, there was FAR less ice 70 years ago. But you don't know anything about the newspaper reports of the time. This is at the same time that the US experienced its 'dustbowl' conditions that were far hotter and more extreme than temperatures today (based on the real data before NASA and NOAA cooled the past to produce 'Mike's Nature Trick').
-
Re:Geographic redundancy
There are more recent papers (in 2013 and more recently) that debunk the debunkers. We could do that kind of back-and-forth forever. You've proved nothing. The issue isn't settled.
Jane, don't you see the irony here? I repeatedly gave you links and even gave you ready-to-run source code with data included, all showing that Houston and Dean 2011 was a massive cherry-pick. In response, you actually cited Houston and Dean 2011! Why, if all these other more recent papers (which Jane doesn't even name) supposedly exist? Again, read the 2013 IPCC AR5 SPM:
"Proxy and instrumental sea level data indicate a transition in the late 19th to the early 20th century from relatively low mean rates of rise over the previous two millennia to higher rates of rise (high confidence). It is likely that the rate of global mean sea level rise has continued to increase since the early 20th century."
If Jane is hiding blockbuster peer-reviewed papers that overturn that latest 2013 literature review, why would Jane keep them secret? Unless they don't exist, and as usual Jane is just 100% bluster.
... if I am not mistaken the original Humlum paper wasn't even actually published until 2012.
Good grief. Jane, you're slipping again. The Humlum paper you and other Sky Dragon Slayers promoted had NOTHING to do with sea level rise! Here's what the Humlum paper was about:
Paper: atmospheric CO2 *lags* sea-surface temperature change by 12 months or so. Since surface temperature increases occur before CO2 increases, CO2 could NOT be the cause. bit.ly/YTcYvI [Lonny Eachus, 2013-02-25]
Lonny linked to Humlum et al. 2013 which mistakenly claimed that "Changes in ocean temperatures explain a substantial part of the observed changes in atmospheric CO2 since January 1980."
A real skeptic would wonder why Humlum et al. analyzed the long-term increase in atmospheric CO2 by taking its time derivative. Differentiation is a high-pass filter because it amplifies high frequency variations and attenuates slow, long-term variations.
Here's why. If A(w) is the amplitude at angular frequency "w", its time dependence is A(w)*exp(i*w*t). Its time derivative is i*w*A(w)*exp(i*w*t). So taking the time derivative multiplies the amplitude by a large "w" for fast frequencies, and multiplies it by a small "w" for slow, long-term frequencies. This amplifies high frequency variations and attenuates slow, long-term variations.
Since our CO2 emissions increase atmospheric CO2 over the long term, Prof. Humlum's analysis can't even detect the rise he claims to be analyzing. However, his method amplifies the faster annual carbon cycle. Prof. Humlum "discovered" summer and winter.
-
Re: Coral dies all the time
Well, you took the time to write all that out, so I'll do you the courtesy of a response, but I will point out that none of it is worth saying without citations (which was the entire point of this thread).
You call it "common knowledge", but when it contradicts the published, peer-reviewed results from any number of studies, which are compiled, published and endorsed by organisations like NOAA, CRU, CSIRO, and the IPCC in numerous countries, then your "common knowledge" doesn't seem to be all that common at all. I provided linked citations of reputable sources for my claims, so you'll need data at least as reputable (please, no blogs or news articles). I've heard claims just like yours countless times, and nobody has yet provided any reliable data to back them up.
"[surface temperature stations] are mostly not very accurate" - a vague claim, but in aggregate they can still give a very accurate picture of the temperature trend.
"[satellites] have their readings INCREASED every year...The current "correction" is about
"the depths of the ocean are not warming... It rarely goes below 100 meters much less 200 meters." - the data shows that ocean heat content has been rising steadily down to 2,000m. Below that, NASA finds no significant change. But there's a huge amount of energy going into that top 2km of the world's oceans.
"there is no way to know how much [sea level rise] is the result of a climate change and how much is climate cycle." - well, we know that sea level rise accelerated significantly in the last 150 years. We know that it's consistent with predictions based on thermal expansion and measured ice loss. If it's part of a long-term cycle, there needs to be a cause, and there's no credible evidence of any cyclic cause at that timescale.
"There are regions that are losing ice and regions that are gaining ice... How much ice are you saying has melted... just give me your rough estimate." - Shepherd et al 2012 finds a net ice mass loss of over 200 gigatonnes/year for the last couple of decades, using multiple lines of evidence.
"ice extent is very easy to estimate. And ice extent doesn't show a decline." I cite ice mass because it's what matters, for rising heat content and for sea levels. Ice extent is a fairly inaccurate indicator of overall ice melt. That said, ice extent has been declining in the Arctic and Greenland while increasing in the Antarctic (despite overall ice mass decreasing there by around 70 Gt/y).
"if the ice packs were melting over all to any significant degree you'd see a great deal more sea level rise than we have seen thus far... We can look at the volume of water in the oceans and compare the change to your ice loss figures." - Yes, and it matches well with what we've observed, including accounting for thermal expansion (which, if you're tacitly admitting exists, requires significant ocean warming).
Citations - yes please. At this stage, if you have any further claims to make, I want to see only links to reputable published data and peer-reviewed studies, not talk of "common knowledge" or speculation from laymen or reporters.
-
Re:The thankless job of solving nonexisting proble
I don't know which article you're referring to, but honestly it doesn't matter. There is plenty of evidence that the atmosphere is warming, plenty of models that predict or predicted this as a consequence of increased CO2 concentrations, and no credible models that predict otherwise.
I have no idea where you get the idea that "most of the heating we should expect to see has already happened." We are still accelerating our CO2 emissions, and it will take centuries for temperatures to reach their final equilibrium even after we stop. We have seen about 0.85 degrees C of warming already (top of p. 5 here), and if CO2 concentrations reach 2x pre-industrial levels, we can eventually expect something around 3.2 degrees C (middle of p. 1110 here).
Given reasonable grounds to expect serious harm, the correct policy approach is to take action to avert that harm, not to do nothing and hope things will be OK, or to demand exact forecasts of the behavior of a highly variable system.
-
Reviews [Re:Simple and complicated models]
As to the virtue of the green house effect studied on its own, the issue is that the atmosphere just might not work that way.
And that's why we have more detailed models.
But it ends up being a no-win situation, when the objective is to criticize rather than to understand. If the model is simple, they say "that model's too simple! The real world is complicated! You need to include X Y and Z!". And if the model is modified to include X, Y, and Z, they say "The model is too complicated! You can't believe any complicated models like that!"
The actual answer is, you start simple, understand the simple models, and progressively add complexity. This is the way science is done. Planets don't move in uniform elliptical orbits. Nevertheless, starting with Kepler's laws and then adding peturbations is a good way to analyze planetary motions.
As for comparing models to reality, and asking what we know and how we know it, there isn't really time for me to go through this model by model since 1967 (since I do have other things to do). I'll again suggest as a start reading the WG-1 summary report, it goes into detail on this (and has references for more details). The one I'm more familiar with is the fourth: https://www.ipcc-wg1.unibe.ch/... (although there seems to be a more recent one, fifth, here:
http://www.climatechange2013.o... ) -
Re:Science creates understanding of a real world.
I respond to your post because it seems to me you are still suseptible for reason-based arguments.
If you look for evidence or as the GP states a 'textbook' you could simply start with the latest IPPC reports. Start with the SPM (Summary for Policymakers) (find the 5th report of WG1 the physical science basis, WG2 Impacts, Adaptation and Vulnerability and WG3 Mitigation of Climate Change here, here and here respectively. All these links can be found on the main page of the IPPC http://www.ipcc.ch
In it you will find the answers to the most common questions asked by deniers: how big is the evidence for global warming? How sure are we that the warming is the result of human activity? What are the consequences? And last but not least: what can we do to reduce the impact?
If you are unconvinced by the figures, maps, graphs and plain language of these documents: they copiously refer to the full report (also available from the main page) where you can readup on the background for each and every conclusion they make. Still not conviced? The full report refers on it's turn to underlying publications etc. And if you're this deep down into the matter that you feel you can question the validity of individual publications: contact the authors and put forward you questions to them.
-
Re:Science is not consensus
I think every model output graph should include uncertainty ranges. Frankly, seeing the wild amounts of uncertainty there, both with model averages, and between models, would be very informative to viewers.
Many of the ones I see do. For instance Figure 12.5 on page 1054 of the IPCC AR5 WG1 [PDF] report on long term climate change does.
Every time you see a grey patch to the right and down from a diagonal line, it's beating that length of time. On the right hand side of the graph you'll see 1, 7, 13, 19, and 25 diagonals to help guide you.
It's not the color that denotes significance, it's the relative saturation of the color compared to the trend only graph. Flip between the two and you'll see what I'm talking about.
I'm doubtful that we've got even a smidgen of understanding of all the causes of natural variation, or the interdependencies between these drivers. Even identifying a few very big drivers, given a chaotic climate, where digits far, far, far to the right of the decimal place can become significant, you can't assert useful predictions from there. Frankly, it is very likely that climate is a non-computable problem.
Again sez you. You're making big assumptions with no evidence to back them up. What qualifies you to make that judgement better than a scientist working in the field?
Asking me to prove a negative?
The minutiae is called minutiae for a reason. In any complex system there are things that have large effect on down to things that just tweak those larger effects but don't make for a significant difference in the final outcome. For your supposition to work your mystery effect(s) would have to be one of the larger ones. Anything that large would cause the observations to not match the projections in a systematic way.
-
Re:Queue the deniers
I agree, we should stick to the science. Here you go:
- The peer-reviewed Journal "Nature Climate Change" includes and references thousands of scientific papers on the subject.
- The IPCC's 1,500-page "Physical Science Basis" report cites hundreds of references and is authored by hundreds of experts. It clearly states what we know, don't know, and how we know it. It reviews its past predictions, notes where its models have errored, and takes into account an incredible wealth and scope of scientific observations over 150 years.
- The IPCC also makes all of its data and models available for review. So you can see for yourself.
- The US Government also recently updated its regularly scheduled report written by over 300 experts.
- The USGS has a Climate Model Browser that lets you try out all the different simulated predictions for Global Warming. You'll notice the specifics vary widely, but they all predict dramatic temperature rises.
- The NOAA has a National Climate Data Center where you can watch the temperature trends. Here's a visualization based on the data.
- The United States Defense department has several reports on the risks posed by Global Warming (see here, here, here, and here).
- The Center for Coastal Resources Management (CCRM) has produced some excellent reports on sea level rise due to Climate Change to inform local communities like Norfolk VA, where flooding is already a major issue, what to expect in the near future due to Global Warming.
- You can also watch the sea levels rise at the NOAA's Sea-Level Trends website.
- If you don't trust the government, then I recommend The Berkely Earth Project. It was funded by the liberal's favorite bad guys, the Koch Brothers, but its results were so compelling that the lead Climatologist, Richard A. Muller, wrote a piece for the New York Times announcing he was no longer a skeptic.
- Of course, it's always good to have a contrarian viewpoint in the mix, and for that, I recommend AGW skeptic Judith Curry, who presents valid challenges to the consensus with her strong scientific background. I don't find her convincing, but her challenges make for good food for thought.
If you dispute this science, then I recommend publishing your own peer-reviewed papers, your own models, and your own alternative hypotheses in the scientific journals. I see a lot of skeptics nit-picking the science, but not many actually taking the effort to publish in the scientific forums.
I eagerly await one of the skeptics out there to please post an equally substantive list of references to "balance" my citations, so everyone can review and compare them.
-
Re:IPCC says warming not causing antarctice ice dr
The IPCC, normally the bastion of global warming alarmism
Bullshit. The IPCC reports are a synthesis of the existing science. If you are alarmed by the findings of the IPCC reports then you are alarmed by the science.
I notice you are being pretty selective on what you quote (Watts is probably the worst place to go for science reporting). For instance, you quote "There is low confidence that the rate of Antarctic ice loss has increased over the last two decades" (BTW, this means that evidence is sparse but indicates that the rate of mass loss has in fact increased over the last two decades.), but you did not quote the next line "however, GRACE data gives medium confidence of increasing loss over the last decade."
So yes, we have observed that it is currently losing mass. All evidence indicates that the rate of mass loss has been accelerating over the last decade or more. Our confidence in this finding is increasing as newer instrumentation is developed and deployed.
You should also understand that SMB can increase (reducing sea level rise), but if outflow also increases then you will still end up losing mass and increasing sea level overall. This is exactly what they find: "Overall, increased snowfall seems set to only partially offset sea level rise caused by increased outflow," Again, Watts doesn't seem to understand that SMB is not total mass balance and somehow glossed over everything else.
They also presciently warn that tipping points could be hit (and that have since been observed): "outflow from an ice sheet resting on bedrock below sea level increases if ice at the grounding line is thicker and, therefore, faster flowing. On bedrock that slopes downward towards the ice-sheet interior, this creates a vicious cycle of increased outflow, causing ice at the grounding line to thin and go afloat. The grounding line then retreats down slope into thicker ice that, in turn, drives further increases in outflow. This feedback could potentially result in the rapid loss of parts of the ice sheet, as grounding lines retreat along troughs and basins that deepen towards the ice sheet’s interior. Future climate forcing could trigger such an unstable collapse, which may then continue independently of climate.
Here is the full report on the cryosphere: http://www.climatechange2013.o...
-
Re:CO2 and climate: my take
If you're interested in the science of Anthropogenic Global Warming, I suggest you read the science, not blog posts. I've read both WattsUp and SkepticalScience, and they are both very poorly written and lack rigorousness. If you are reading these two blogs, you are reading the work of bias amateurs.
Here's what you should be reading:
- the peer-reviewed Journal "Nature Climate Change," which includes and references thousands of scientific papers on the subject.
- he IPCC's 1,500-page "Physical Science Basis" report, clearly states what we know, don't know, and how we know it. It reviews its past predictions, notes where its models have errored, and takes into account an incredible wealth and scope of scientific observations over 150 years. I highly recommend downloading this 0.5 GIG report and at least skimming it. I consider it the model of good science.
- The IPCC also makes all of its data and models available for review. So you can see for yourself. Take this data and give it to a machine-learning algorithm. The science of AGW is actually shockingly simple.
- The US Government also recently updated it regularly scheduled report written by over 300 experts.
- If you don't trust the government, then I recommend The Berkely Earth Project. It was funded by the liberal's favorite bad guys, the Koch Brothers, but its results were so compelling that the lead Climatologist, Richard A. Muller, wrote a piece for the New York Times announcing he no longer a skeptic.
- Of course, it's always good to have a contrarian viewpoint in the mix, and for that, I recommend AGW skeptic Judith Curry, who presents valid challenges to the consensus with her strong scientific background. I don't find her convincing, but her challenges make for good food for thought.
Science, published peer-reviewed science, not blogs, is where we should keep this discussion.
-
Re:Science requires falsifiability
How about the inter-governmental panel on climate change (IPCC)'s latest report:
http://www.climatechange2013.o...
"It is extremely likely [95 percent confidence] more than half of the observed increase in global average surface temperature from 1951 to 2010 was caused by the anthropogenic increase in greenhouse gas concentrations and other anthropogenic forcings together."
-
Re:It's only "settled" in the minds of zealots...
Wine grape grew in England back then.
The IPCC’s Fifth Assessment Report concedes for the first time that global temperatures have not risen since 1998, despite a 7 percent rise in carbon dioxide (CO2) emissions.
No, actually it doesn't, it actually says the trend over the last 15 years is lower than the overall trend because of the chosen start and end dates:
Due to natural variability, trends based on short records are very sensitive to the beginning and end dates and do not in general reflect long-term climate trends. As one example, the rate of warming over the past 15 years (1998–2012; 0.05 [–0.05 to 0.15] C per decade), which begins with a strong El Niño, is smaller than the rate calculated since 1951 (1951–2012; 0.12 [0.08 to 0.14] C per decade)
If man-made global warming is your religion, it looks like settled science despite the actual results.
Very convenient, anyone who disagrees with you is a religious zealot. However, any time that you are allying with religious leaders and calling scientists zealots, you should really take that as a clue that you need to carefully examine your beliefs.
97% of the scientists who study climate change think it's happening and it's man-made, as does 97% of the published research on the topic. That leaves a mere 3% to split between the undecided and those who think it's either not happening or not man-made. If it weren't actually happening there should be a lot more research showing negative results.
-
Re:There is no uncertainty
A lot of the problem with the stories on global warming is that they respond immediately when warming indicators occur but rarely when cooling indicators do, they also rarely if ever publish the later corrections when mistakes are made.
The image that got me thinking the most is this comparison of climate models to reality; the dots and squares are reality: http://wattsupwiththat.files.wordpress.com/2013/06/cmip5-73-models-vs-obs-20n-20s-mt-5-yr-means11.png?w=640&h=480
Another good example is page 102 of: http://www.climatechange2013.org/images/uploads/WGIAR5_WGI-12Doc2b_FinalDraft_Chapter11.pdf where recent observations are less than the majority of the models that are predicting extreme rise in temperature. That document is from the IPCC.
There are quotes from a climate scientist (sorry I'm not sure which) specifically stating that 17 years without a change in global temperature anomaly would indicate that the models are wrong. We've had 17 years of no change: http://www.woodfortrees.org/plot/hadcrut4gl/from:1997/plot/gistemp/from:1997 -
Re:Double down
Why do you think the IPCC no longer uses the Hockey-stick graph?
They don't use Mann's original hockey stick graph from 1998 any more because it's 15 years old and numerous other newer reconstructions have been done since then. But if you take a look at Chapter 5 - "Information from Paleoclimate Archives" of the IPCC AR5 - WG I report you'll find that figures 5.7 & 5.8 still look remarkably like the original hockey stick graph. So they've got newer versions of it.
-
Re:Eclipse as Propoganda
ocean levels are now predicted to rise something like 4" over 100 years (NOT four feet as the government website sadly parrots)
That can't be right. The current rate of sea level rise is 3.6 mm/year. The rate is accelerating - it was 1.7 mm/year in the early 70's. 3.6 mm/year * 100 years is over 1 foot. With continued acceleration 4 feet sounds reasonable. 4 inches is not. - http://www.climatechange2013.org/images/uploads/WGIAR5-SPM_Approved27Sep2013.pdf
-
Re:Governor Appointed
What makes you think that isn't being done already? In the new IPCC AR5 Working Group I report there are two chapters that address this, "Chapter 8: Anthropogenic and Natural Radiative Forcing" and "Chapter 10: Detection and Attribution of Climate Change: from Global to Regional". The attribution of climate change to it's various causes is an important part of the field already.
-
Re:Computer literacy + social skills
n fact, the richest and most powerful Americans would probably like there to be not so many people who understand math: Those who understand math can understand how badly they're being screwed by the richest and most powerful Americans!
I think you're on to something there.. they certainly wouldn't want American voters to understand figure SPM.5 (Radiative Forcing) on page 31 of the IPCC WG1 AR5 Summary for Policymakers, because that would just stir up trouble for the 1%. Better if the plebs stick to News Corp. soundbytes, prepared before that report was published.
-
Re:Global Warming articles
Why don't we ever get articles like this one on slashdot?
Because it is solly based on a false premise.
Global warming has slowed since 1998 even though humans spewing ever more greenhouse gases are almost certainly to blame for damaging the atmosphere.
This statement is based on, they say a report summary...
That’s according to a 36-page summary of a report from a United Nations panel released in Stockholm today concluding Earth’s temperature since 1998 has increased at less than half the pace of longer-term averages since 1951.
... which they cleverly never cite directly or link to. Here is the link...
http://www.climatechange2013.org/images/uploads/WGIAR5-SPM_Approved27Sep2013.pdfThe statement made by the article is never explicitely made in this report. On the contrary already on page 3, it is explained why a statement such as the one made in the article is, while true in a specific context, is missleading due to local variations in observed trends. If you look carfully at figure SPM-1 and the statement made on page SPM-3 (3), you will not only see that the author of the article missunderstood the statement made, but even inverted completly its interpretation and meaning.
The report states that the trend evaluate between 1998 and 2012 is slower thant the rate evaluate between 1951 and 2012. This trend variation is fully explained by a local change in temperature variation due to a strong El Nino over the 1960-1990 period and has nothing to do with global warming.
Ironically, the journalist missunderstood (deliberatly or not) the explanation why the use of local trend is missleading in understanding climate change and used the missleading trend stated as example of trend not to use to base is thesis on. I couldn't write "Wooooosh" loud enough.
And we should see more such nicely writte article on
Go read the report and learn something.
-
Re:What I'd love to see
What I'd love to see is reporting on climate change that presented facts without the hyperbole. I'm reasonably certain that I'm far from the only person that's fed up with having hyperbole rammed down my throat and would really rather just have the actual "science" reported.
Well, then you'll just have to wait another 10 days, and then you can download IPCC Workgroup 1 AR5 report from http://www.climatechange2013.org/. I'd suggest not reading any newspaper articles or watch any TV aboutit, before it has been officially published. This way you can keep yourself untainted, and just calmly read the actual report rather than all the spin around it. That's what I plan to do.
-
Re:Have you looked at the evidence?
Have you actually read the IPCC working-group 1 report, The Physical Science Basis of Climate Change. I don't mean, a summary of it
I beg to differ. Even reading the Summary could be greatly beneficial for many of the victims of the disinformation campaign. The full WG1 report is a lot of reading. There's an overwhelming amount of science to get through and expecting non-specialists to tough it out is not entirely realistic. That, after all, is why the Summary for Policy Makers (SPM) exists.
And the advantage is that on any area of science where you want to get your hands dirty, you can navigate from the SPM, into the the appropriate place of the Full Report proper and via the citations to the original publications in the scientific literature.
And on that point, don't waste your time right now reading the AR4 report. The AR5 report is due for release from the 27th of this month, starting with the SPM, from here.
And the SPM makes it so easy for non-specialists to get a handle on the science, it's simply unforgivable for anyone who presumes to venture an opinion on this issue not to have digested it.
-
Preparation of sentiment against next IPCC report
Yeah, and if Hitler were alive today, he'd probably be a "Warmist" as well, what with his vegetarianism and long walks in the woods.
Give me a break.
This whole Slashdot discussion today, based on a Daily Mail article, seems to be mental preparation of the public so that they're properly revved up for global warming denialism,
before the next IPCC report gets published in a few weeks.
So that on 2013-09-27, Joe Public will say to Jane Public: "but it's all rubbish; wasn't that in the newspaper a few weeks ago?".