 Slashdot Mirror
Domain: mybudget360.com
Stories and comments across the archive that link to mybudget360.com.
Comments · 22
-
Re:There is no hack that should work
Were you silent when they came for private sector Pensions?
Did you speak up when they came for Union pensions?
Where you concerned when they attacked teachers pensions?
Did you raise the alarm when they undermined public sector pensions?
Make no mistake, they'll get to you soon. -
Re:So he did nothing?
So he did nothing?
Read more carefully:
he has done little to nothing of what he said he was going to do, none of it in any way close to exactly how he said he was going to do it, and everything he has done, he has compulsively lied about due to his tendency for braggadocio and irresponsibility.
Pretty much says he has done things, but failed to do it as he said he would, and lied about it.
If I had wanted to say he had done nothing, I could have said that, but no, I merely stated he had done little to nothing, and none of it was exactly how he said he was going to do it, and I certainly wouldn't have said that he has lied about everything he has done if he had nothing.
Stopped chemical weapons being used in Syria
Lied about stopping Chemical weapons being used in Syria, lied about his wasteful airstrike on an airport that was back in operation almost immediately, and certainly did not fulfill his promises on it. In reality, the Syrian Civil War is still a humanitarian crisis, and the use of Chemical weapons, no matter how deplorable they are, is only a small fraction of the tragedy.
And of course, Trump claimed he would solve the problem, which he hasn't, making his failure a lie. That he had previously denounced such missile strikes as he ordered as theater only harms your defense of him.
Increased S&P 500 by 5% (Real money gained by middle class)
Not directly attributed to anything he did, so...huh Thanks for showing the braggadocio though...the trend was already up and really, trying to assert it is real money gained by middle class? Ah, lies.
Unemployment claims at a 17 year low
A fuller perspective shows the lie.
Unemployment claims have been dropping steadily. Attributing it to Trump is like claiming that he put out a fire that was already mostly extinguished. Of course, he also claimed the same employment numbers were lies before relying on them for his own benefit, so there's another broken word of his. You really can't win with this, either Trump takes responsibility and admits that the complaints he made about unemployment statistics were false, or Trump has still left 90 million Americans without a job.
Illegal immigration drop by 75-90% depending on your source
Or you could at that some more. That isn't even getting into his already demonstrated lie about a Wall, his executive order, and his false sanctuary cities claims. Not to mention the toddlers and senior citizens added to his dangerous criminal list.
His handling of that has been yet another cavalcade of deceits, failure, and incompetence.
Supreme court nomination everyone agrees is good
Well, there's a lie. Your hyperbole betrays you. All it took is one.
There are others. 45 in the Senate alone.
Thats quite a bit for 3 months.
That's quite a bit of lies for 5 Sentences. No wonder Trump is your hero
If you still claim he did nothing, then y
-
I call Bullshit
-
Re:"All the jobs are leaving" as unemployment fall
I don't know why a lot of people go on about how we are getting more square footage for the dollar today when we buy a house. What matters to me when I buy a house is the area that it exists in, as well as whether it will work for me. Perhaps 950 square feet worked for a family back then, but today even if I wanted to buy such a small house I would be living under a freeway and not living in an area conducive to family living. So there are limits to the kind of house I can buy today, you cannot ignore it. I found an interesting comparison of the cost of living between 1975 and now on this page: http://www.mybudget360.com/cos....
The average cost of a house has gone from 209k to 270k. The average cost of a car has doubled from $16.5k to $31k and I dare say a vehicle is more expensive to maintain today and more necessary than ever before as public transportation is stretched to meet today's population in most districts. The cost of schooling, also more necessary today, has gone from $8k to $19k for public college and $16k to $42k for private. These are the costs that make up a life and people are being dragged out more and more. The article also correctly brings up the fact that the price of a barrel of oil seems to rise and fall but the cost at the pump only rises.
Google on the decrease of the output of the American worker over the last few years, there are several articles on it. In spite of technological increases the amount produced by the American worker is steadily decreasing today. People are out there working hard and their families are only falling further behind for it. Salaries have not increased as much as prices have risen in the last 40 years. Lack of performance is the result. People are tired. -
Re:Plenty of low-wage jobs to go around...
Well, if you want data, according the social security adminsitration the average wage has gone up by about $8000 since 2010; however the median wage has gone up by something more like $3000.
This pretty much tells you what you'd expect under trade liberalization: it helps higher wage workers with specialized skills more than it does commodity labor.
The key to understanding data like this, as a sociology professor once told me, is to disaggregate it. If you do you'll see that while the averages and even median that looks fairly rosy over the last thirty years, the picture for median and below has been almost flat for a generation.
That doesn't sound too bad. Sure the wealthy and the well-to-do are getting richer, but nobody (at least no economic slice -- geography tells a different story) is doing worse. But even that result has to be disaggregated. On one hand you have only a modest increase in the overall cost of consumer goods (thanks free trade!); this modest increase along with modest compensation increases produces no growth or loss of purchasing power below median income.
On the other hand if you break out just health incurance, medical care and college tuition, median purchasing power has collapsed in the last thirty years or so.
What this means is that median income people can buy a lot more TVs and home entertainment crap than they could in the 70s, but as that stuff has become cheaper paths to upward mobility have been closing and paths to downward mobility have been opening.
-
Re:unlikely
Thank you for the measured comment; I'll return some thoughts in kind.
My wife and I are 35. We've been waiting to have kids until we could "afford" to do so. We've run out of time. It's now or skip it, which is utterly heartbreaking.
On the subject of school - I worked 2 jobs through college while taking as many classes as I could (to get the max value out of my tuition dollars). I don't think I slept more than 5 hours a night ever. I graduated on the Dean's list with two majors and a minor (STEM, Finance and a foreign language).
We've been looking for better work. We've been crawling our way up. I've not taken more than a week of vacation at any of my jobs since graduating (3 of them), getting my vacation days paid out when I switched. I've evolved my career with each switch. My wife has done much the same.
And here's where we're at with all of that. Having gone to a middle-of-the-road school (with academic scholarship help and some need based grants) I'm 3 years from paying off my student loans. We cashed out my IRAs from the first two jobs and rolled them into a cheap duplex at the bottom of the housing crash - fairly shrewd move since the IRAs only ever lost money and it got us away from paying rent. We cook at home. Travel really isn't something we can afford, so we never do.
All that, and we don't have savings that would last us four months. As far as I ever hear it out of politicians' mouths, "retraining" is a propaganda euphemism designed to distract from how screwed we are. Compared to buying power, housing costs are still out of whack by maybe 40%. Medical costs are
http://www.mybudget360.com/the...
http://www.thebubblebubble.com...
http://www.cnbc.com/2015/06/16...
At this point, I don't have much of anywhere to go with this. I'm pretty fucking tired of being told that where we're at is my fault. -
Re:I"m a liberal socialist
Perhaps this article: "Importing lower wages as 75% of Silicon Valley’s tech workers are foreign-born: How tech manipulates the H-1B visa program for cheap labor." http://www.mybudget360.com/h1b...
But feel free to talk out of your ass. -
Re:And still moe people have more things
$3500 in 200 lawns is $17/lawn ($50 adjusted for inflation). These days a kid mowing a lawn is lucky to get $20. I know for $20 I can get a whole family of illegals to mow, edge, rake and weed my yard and garden. Sure, the computer costs less now, but people are paid less too.
It's amazing how people can prattle on about how things were back then and how if someone was a hard worker they could have the same things you had. It's even more fun when you tie things to the price of gold: http://www.mybudget360.com/40-...
In 1969, the median salary was $9302, or 265.8oz of gold
In 2010, the median household income (from here) was $51,144, or 43.6oz of gold.
Over the same time that household income decreased to about 1/5th of their 1969 level, housing prices (in terms of gold) dropped to 1/4th of their level.
So no, the same amount of hard work just doesn't cut it anymore, and it's clear that the value of labor is going to keep dropping, with or without attempts to stop it by increasing the minimum wage.
-
Re:The cost case against
Sorry but you can not cook the numbers to make your solution look feasible. The UBI is based on the minimum amount to live reasonably. You can't just arbitrarily set it to an amount that works.
UBI does not necessarily translate to a living wage - it's just an extra payment. Ideally, yes, it should be at least a living wage, but realistically it may not be possible depending on what the economy looks like. Just like existing minimum wage is not living wage.
Either way, if I "cooked" the numbers, then so did you - you just gave some arbitrary figures that don't correspond to real economy. Like I said, in that particular abstract economy, assuming there's no-one else other than those three guys in it, UBI (and welfare in general) cannot be as high as you've asked it to be.
Say one person makes $1000/month and the UBI is $800. he receives a cheque for $800/month how much money would he get for that month and please show your math.
Like I said, it depends on how many other people are in the economy, and how much they are getting. That defines how much income we have, and therefore what tax burden we can place and redistribute. Without those other figures, your question is meaningless. UBI doesn't work if your economy consists of a single person.
If the context is the numbers that I have offered above (which are real numbers of average income for US in 2009), then I can give an answer, but first we need to adjust the inputs, because my numbers were about households, not individuals (I couldn't find statistics for individuals quickly). So let's assume that we're talking about a household of two, each of which is like you've described - $1K income, and $800 UBI per month. The combined yearly UBI of that household would then be $19,200/year. And their combined wages would be $24,000/year.
Now, to make this work with a flat tax rate in the economy described by my numbers, you would need a tax rate on non-UBI portion to be 35% for everyone. So this particular household would pay 35% of their wages (not of their total income including UBI check!) - so $8,400/year. And, as we have already computed above, they will receive an UBI checks totalling $19,200 in that year. So they will end up getting $10,800 on top of what they have earned, after we reconcile their taxes with their UBI checks. So they're getting an extra $900 per month together - so each one of them is getting an extra $450.
And no, this system does not imply that we send them the check for the difference - we collect taxes separately, and mail the checks separately, and it's reconciled by recipient. Income tax would be collected in the same way it it collected today for most - you'd simply get it subtracted from your paycheck by your employer. But now, in addition to the paycheck every month, which will be $X dollars smaller, you would also receive the UBI check every month, which will be $Y dollars bigger. Thus, the UBI system doesn't need to keep track of anything, and tax system doesn't need to keep track of anything that it already doesn't track today (i.e. your wages).
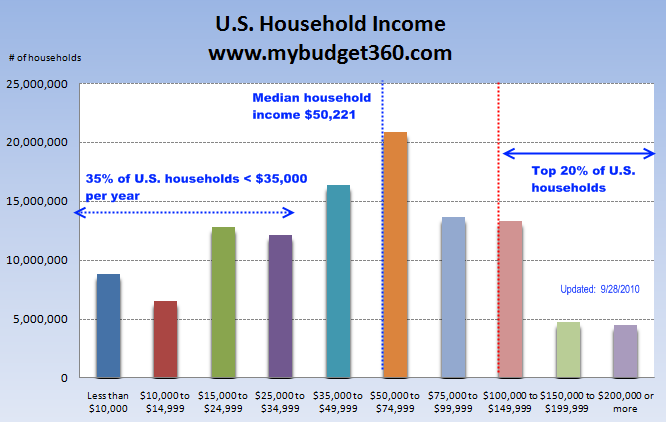
Here's the spreadsheet that I was using to make these computations. First two columns - yearly income, and number of households earning that income - are from this chart, as I have described before. The only other input is the desired UBI payout - this is the bold figure at the top. The rest of the table is automatically calculated from these two inputs, producing the tax rate on wages portion of income (at the bottom) that is necessary to produce a balanced UBI budget. The second-to-last column is how much net benefit every household in that income bracket receives from the UBI system. The last column is their total household income after all taxes are paid and UBI checks are cashed in.
Does that make sense now?
-
Re:The cost case against
Right, Mincome is not strict UBI. But the observations from that experiment can be extrapolated.
There is no one definitive answer to your question with numbers - it's a dial that we can adjust depending on what exactly we want to get, and what kind of economic productivity we're talking about (so that we break even). So, for example, I could say that all of these guys pay, say, 10% off their non-UBI income - obviously that means that all of them are in the "subsidized" category, and the ones subsidizing them are people not on your list, who get $10k/month.
If you mean this as a constrained example where A, B and C are the entirety of our model economy, then we can easily calculate the precise break-even point. We need $3600 to split between the three guys for their checks, and we have $5000 of taxable income, so the flat tax rate on non-UBI portion would have to be 72%. Effective tax rate for the entire income including UBI check would be 33% for the first guy, 40% for the second, and 49% for the third - that's our smooth progressive taxation gradient. The first two guys would be getting more from the system than they receive - first one effectively gets $480 on top of what he earns by working, and second one gets $120. Third guy is paying more than he is receiving, by $600 - which is where those $480 and $120 come from.
Now, realistically, a 72% tax rate is probably going to be a significant demotivator to work for that extra money, so in that particular economic model (where the highest earner only earns a meager $2500), a UBI level of $1200 is not feasible. Now if we slash it in half, we'll get the much more realistic non-UBI tax rate of 36%, with effective tax rates for the three guys being 23%, 26% and 29% - the arrangement is the same otherwise, with the third guy subsidizing the first two, but all numbers are slashed in half, so the third guy gets to keep most of his $2500 earned wage, whereas before we were taking more than half of it.
This all works exactly the same in a real-world economy, just that the actual numbers are different - and more interesting to crunch. We'll need something like this to begin with - because this is for households rather than people, and income is yearly rather than monthly, I'll operate in these terms, as well (but obviously it's easy to translate that to monthly check and individuals if need be). Also, because I'm lazy, I'm just going to assume that everyone in each bracket is getting the lower number on that bracket (i.e. where it says $50-$75k, I'm counting them all as $50k; the lowest bracket is counted as $0, as if they don't earn anything, and the highest bracket is all counted as $200k). I eyeballed the bars on the chart and converted them to numbers, dropping millions (because we really only need to maintain proportions).
Now, with these numbers, let's assume that UBI is $30k per household (this is equivalent to two adults working full time and earning the federal minimum wage today). This translates to tax rate on non-UBI income of 56%. The effective tax rates with that arrangement range from 0% to 48% in a smooth gradient - $0 bracket pays 0%, $10k bracket pays 14%, $15k bracket pays 18% etc. The cut-off point for when a person starts paying into the system more than they are receiving from it is somewhere between $50k and $75k - household that earn $50k get $2.5k on top of that from UBI, when taxes owed are subtracted from UBI check, while households that earn $75k pay $11.5k into the system when subtracting taxes from the check. Households in the $200k bracket end up paying $80k into the system.
Adjusting the amount of the check is not going to change the break-even cut-off point (where your tax = your UBI check) - it only affects how steep the curve is above and below it (but still, at no point does the guy above that point ends up taking home less than the guy below it - so there's always a monetary reward for extra
-
Re:Yeeeeeahaaaaaw!
You're operating on a vacuum assumption in your own head without looking at the world around you. You go, "Oh, that doesn't make sense to me, so I'll make up bullshit and claim everything based on solid analysis and understanding is made-up bullshit."
Put up or shut up time: predict the next major recession. Right now. Can't? Hmmm.... So, with that out the way, you've made some other major assertions that many just don't agree with:
No, the cost-of-living hasn't gone down; the standard-of-living has gone up.
I'd say inflation has done a number on the median income and reduced disposable income to lower levels. So I suppose it's a good thing those toys cost less, because there is less to spend on them.
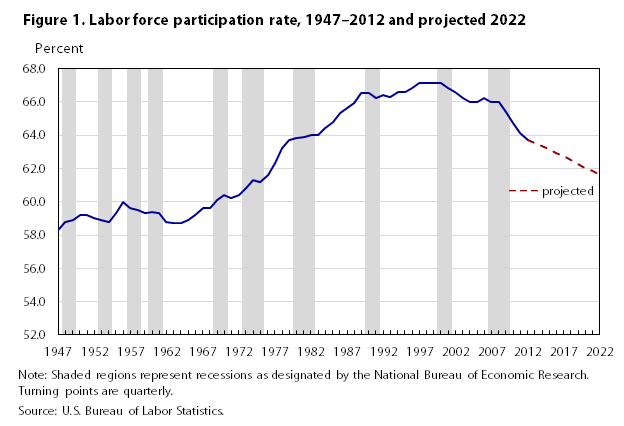
I already demonstrated that we're in a labor force participation rate bubble,
TBBA (Truth by Blatant Assertion) Merely pointing at a graph or mentioning various cherry picked statistics doesn't prove a bubble.
Let's not argue so much over *why* labor force participation suddenly grew. Let's ask another question: Why was it so low in 1970? Well, I can find as far back as 1947 at a glance, and the answer is it's always been that low.
Actually, let's do discuss it, because it's quite relevant. You see, in the late 60s, with women's lib and societal upheavel in the US and the rejection of the June Cleaver role, women actually demanded that they be treated as equals in society. Because of the aforementioned appliances etc, they had more free time and they not only went to work but stayed at work, developing careers as a normal activity. That increased the labor pool, it was not a bubble, but a raising of the available level. Now you can dispute that the pool got bigger or address the drop off since the peak, but you can't say the increase was a bubble as several fundamental shifts in society occurred to drive that effect. That would be like saying an asteroid only caused some minor temporary damage 65 million years ago.
Globalization started in the 19th century--some economists want to take this back further--with the reduction of shipping costs. That whole shipping textiles and spices and liquor around? That's outsource labor, pushing manufacture to cheaper labor markets.
Really? Try the 70s for when textiles really started losing business fast. You're seriously stretching there with ancient trade. That trade was for goods unique to production areas, not a move to replace domestic production with cheaper foreign production. It's a simple test really, was whatever was being brought in made domestically as well? No? Then it wasn't outsourcing.
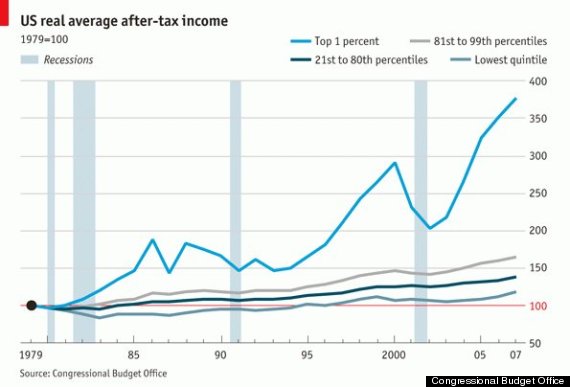
At the same time, income per household has increased even as labor force participation decreased, which suggests the jobs we're gaining are higher-paying jobs.
You might want to check your numbers as it is obvious that real median income has dropped since the 70s, with the exception of the last report, which still indicates that median income has dropped since 2000. Add to that that actual cost of living has increased....
First, we don't have a lowered median income.
TBBA - Several links from authoritative sources a
-
Re:It's finally time
Yes most. you have to count the 90% that make less than $65,000 a year.
In what world do you live? 90% make less than like $200k in the US, not 65k which is near the average household income of $50,502.
http://www.mybudget360.com/how...
$65k and less equates to 66% of the adult population (single person vs household), not 90%.
-
Re:What exactly is the point of the furlough anymo
First of all, this entire time I've been including things like investments and extra debt repayments as "savings" (they may not be as easy to get to as cash in the bank, but it's still possible to use them as emergency funds). If you make $4000/month, spend $2000 and put the other $2000 in stocks, that's what I call having a 50% savings rate (and living way, way below your means -- if you keep that kind of thing up, you can retire at 30 like the mrmoneymustache.com guy).
Second, I think you've got some overly-optimistic ideas about how the "average American" lives. They not only don't keep cash in the bank, they don't have any investments either. They don't even have any retirement savings (other than Social Security)! In total, the median saved for retirement by all US households is $3,000. The "average American" really is living paycheck-to-paycheck according to my definition, not yours, and gets entirely screwed by his own stupidity when the slightest thing goes wrong.
-
Re:my guess
By the way, you are missing part of the formula for GDP, it's the deflator that they are supposed to apply to discount inflation. Of-course their deflators are ridiculously low, I have an 'informative' post with many numbers and links in it here, which shows a few things about inflation and GDP. AFAIC GDP has been shrinking for a long time now in 2 ways.
1. The 'production' part of GDP is shrinking all the time. Look at the trade deficit numbers, here is a page with history on it in PDF or text. For the year 2011 the trade deficit was 559Billion dollars and it's growing all he time. Of-course the total personal consumption in USA is mostly on services, not on goods, in fact 2/3 of all consumption is services and only 1/3 is goods. 11Trillion was spent by US consumers in 2011, so about 3 Trillion was spent on goods and the rest was energy, food and services (like healthcare and education for example), so in that sense US consumer consumes mostly 'US' service. However if you look at the goods (go to Walmart and compare how many things are made in USA vs foreign made, like China), you'll find that most of the goods bought and sold (and even food, 90% of sea food comes from Asia) is made elsewhere.
2. The deflator that is used is reverse engineered to fit the propaganda. With the nominal and pre-deflator GDP being 2.9%, the deflator is set to be 1.6. (read the linked comment, I give quotes and links there), that's GDP revised down from 1.7% to 1.3% (post deflator) for the second quarter.
70% of GDP could very well be consumption, at least in countries with unusually low government spending
- I am sorry, this sentence makes no sense. 70% of GDP is consumption, that's not because of low gov't consumption, the exact opposite is the case, that's because of very high consumption stimulated by gov't (especially non-existing interest rates and free money allocated by the Fed to the member banks, who then buy T-bills and bonds and allow gov't to keeps spending). It's low production that is the problem, that's why GDP is 70% personal consumption, it's the actual number, what can I say? You see, when the production portion of GDP shrinks, the consumption portion becomes bigger and bigger part of the number, and if the consumption is stimulated artificially with fake money and 0% interest rates, and as long as the foreigners are willing to take dollars for their exports, then consumption even grows, doesn't just stay the same.
The reason that the consumption is mostly of foreign goods is exactly because the production part of GDP is disappearing.
-
Re:Of course the rich should give to charity
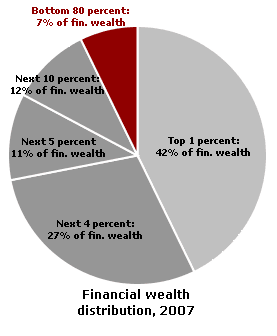
If they're only paying 40% of the national tax burden, then they're being undertaxed.
-
Re:FLAT TAX
In your own post, you admit that you are better off making more money now, then if you were making 1/2 your money. I know you will say this is only because you do not game the system, even though it is not true. You pay sales tax on everything you buy off the internet and never tried to talk your way out of a speeding ticket. Everybody plays games, the people doing most of the stuff you are describing are shooting themselves in the foot. Nothing you do is going to change the way they operate and punishing everyone because of a few is simply not smart, compassionate, or rational.
As to your percentage points, you are only telling half the story:
o you really think 50% of the population can pay for 98% of the governments spending? Do you even think that is fair?Yes, they can, and it is fair. This shows that 20% control 93%. I'm sure we can extrapolate that the top 50% control more then 98%. This is simply pay as you go. -
Re:Whoops
Indeed, let's not forget that 1% of the population controls around 42% of the the wealth in the US. (source here and various other sites, just google it.) A savings account with half a billion dollars in it makes up for a whole lot of people with $1.23 in savings, to help push that average up to $20,000.
I wonder what the average bank account would look like if you removed, say, the top 10% and the bottom 10% of the income curve. I'd like to see a source on that $20,000 figure. Also keep in mind that total savings (stocks, bonds, retirement accounts, etc...) does NOT equal savings account.
-
Re:Yay!
Yet that top 1% control 99% of the capital. It looks like that 37% is a fucking good deal. For them.
That number of 99% is probably way too high. They likely control far less than that. (For those lazy to click, the link claims that 42% of wealth is controlled by the top 1%)
Senator Bernie Sanders recently claimed (3:16) that between 1980 and 2005, 80 percent of all income has gone to the top 1 percent of wage earners.
-
Re:No kidding
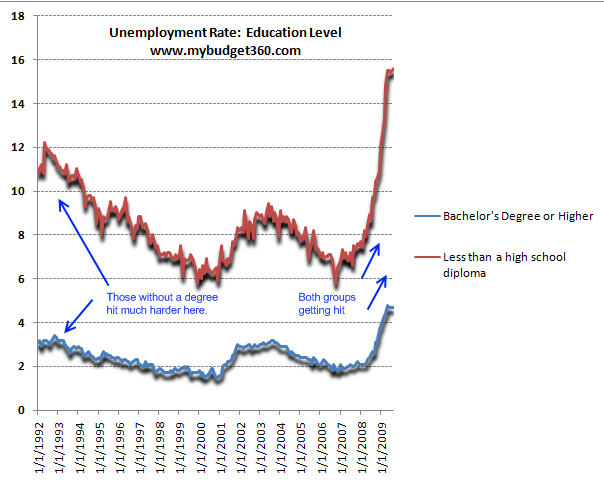
Especially since the national average is over 9% currently. Seems to me a more accurate story would be "Tech sector hasn't recovered to previous levels, but has much lower unemployment than many other areas."
Presuming that the majority of people in the tech sector have at least a 4 year college degree and thus average nearly the same unemployment rates as other primarily white-collar sectors, I believe "soaring" is appropriate.
This chart shows that people in that category have had no more than 3% unemployment for nearly the last 20 years - including the dot-bomb fall-out. Given that unemployment was roughly 2% before the latest crash, a 200% increase is pretty drastic.
-
Re:have they bought "Beyond Pitiful" yet?
Owing more on your house than it's worth has a negative impact on your credit rating, whether you're current on your payments or not. So any employer who does what you say ("checks credit ratings") will view you negatively.
Rental prices are down compared to last year. Also, it's been 2 years now that landlords have taken tenants who have gone through the foreclosure route. You've been living in la-la land if you haven't noticed it. Landlords are settling for a lot less than they used to.
As for the rest, it's all been in the news for the last year. Just look for it. Or don't you know how to search?
http://finance.yahoo.com/news/Mortgage-Defaults-May-Be-cnbc-1964280202.html?x=0
Mortgage Defaults May Be Driving Consumer Spendinghttp://www.nytimes.com/2010/06/01/business/01nopay.html
Owners Stop Paying Mortgages, and Stop FrettingYou haven't tried to get a job in finance or with the government, have you? Money problems are a HUGE red flag to US employers, especially in industries where financial responsibility is part of the organization's reputation.
The person who walks away, does a short soale, forecloses, whatever - is less of a risk. They've taken their medicine, whether it was a short sale, foreclosure, deed in lieu, or a bankruptcy. They won't be tempted to take a bribe to hold onto their underwater house. Your thinking is naive.
Why would I want to bite you? You've shown you're stupid, and it might be contagious. http://www.mybudget360.com/mortgages-non-payment-10-billion-dollars-month-free-thanks-bailouts/
$10 Billion a Month Freed up Each Month from People not paying their Mortgage. $1.9 Billion of That is in California so People can continue Leasing their SUV Mercedes and Getting Tans. Thanks Bailouts!http://www.bloomberg.com/news/2010-04-22/honey-i-lost-the-house-now-it-s-time-to-party-caroline-baum.html
Honey, I Lost the House. Let's Party -
Re:The correct name would be
Blue states like Georgia, Arizona, Utah, Florida, and South Carolina? link
California is a special case. It's f'd because of it's stupid referendum process and dysfunctional budgetary procedures. Everyone's hurting, and the idea that red states are more fiscally responsible is laughable.
-
Re:Cost effective?
Sorry I rounded up, it's 13.5 trillion.
I generally don't pull anything out of my ass, much less numbers. Not my fault if all you do is listen to mainstream media coverage (coverup?) of the worst financial disaster ever.