 Slashdot Mirror
Domain: nasa.gov
Stories and comments across the archive that link to nasa.gov.
Comments · 16,365
-
Re:Up, up and away
What would be really neat is an ATV downlink on UHF so we could watch it. I've always wanted to see the transition where the blue sky disappears.
Check out Cosmocam's YouTube feed. It's a project of the CSBF to allow people (mostly students) to interact with a camera aboard a high altitude balloon. In their case, the balloons can go much higher and longer than Cornell's. CSBF's balloons can reach 120,000 feet (37 km) and have flown for >50 days.
-
Re:And they needed a study for that?
Bernoulli's explanation of lift is incomplete. An aerofoil generates lift by forcing air downwards, it's just that the air does most of its downward travel a long distance behind the aerofoil... unless it's travelling around in circles, like, say, a helicopter blade.
Trust me, the air being forced downwards is the only thing keeping a helicopter (or any aircraft) in the air. Or rather, don't just trust me, trust NASA (you can even check their working). -
Re:Human exploration IS worthwhile IF...
...you are interested in something other than sports, iPods, and Coach bags.
Personally, I'm a big supporter of the space program, but it's totally unrealistic and, I'd argue, immoral, to ask individuals to disregard their own interests for benefits that almost certainly won't be realized in their lifetimes and may very well never be realized at all.
If your society can't be bothered, you're damned to spend more willingly on the NFL each year than you begrudge the entire space program.
NASA's budget is approximately $18B/year. The NFL's revenue is approximately $6B/year.
Enjoy your cell phone.
Thanks, I do. I consider it to be a technological marvel, and a great example of how dedication to scientific research and technological achievement can better the lives of ordinary people.
-
Will these do?
There are some lines on these charts from NASA.
I think most people will agree that the folks at NASA kinda know what they're doing. Despite a couple of monumental fuckups over the years (which were generally management fuckups, not the technical kind), fundamentally, getting rockets into space repeatedly & successfully is a very hard thing to do, and overall they do it well.
So I see you your assertion that global warming is crap, and raise you 17 charts that indicate that something quite significant is happening to our climate.
Oh, and the upper atmosphere thing? Well, you know, seeing unexpected things happen in systems as complex as the earth's atmosphere is how scientists (real ones, not those clowns from the Discovery Institute) learn stuff. They look at what's happening, and modify their models to try and explain it. That's called the scientific process. Real scientists don't ever claim to know all the answers, just to having a really good guess.
-
Mass Catcher
I wonder if we could operate a remote-controlled Mass Catcher? The one designed for the 1975 Stanford Summer Study would do if you left off the intake grid of cables. It would be a rotating Kevlar cone. Centrifugal force would hold loose regolith in place, which would act to absorb the impact of the intercepted debris. The same rotation would also act as artificial gravity to prevent the escape of secondary splash debris. Using a pellet launcher as a thruster would be safe, since the pellets would be traveling at far above Earth escape velocity.
-
Re:Surprising
Hey, why did Alabama get lumped in to this? It's not like they can pick the state up and move it... plus they do have the Marshall Space Flight Center http://www.nasa.gov/centers/marshall/home/index.html in Huntsville.
-
Similarity
A red streak, huh? Looking at the picture, it's sort of a orange-red rust color. A rust-colored streak in the middle of a bunch of ice. What does it remind me of? Ah, yes.
-
Re:Stupid
> And I am sure that the naming of the Enterprise had nothing to do with the fact there are multiple Enterprise Ships in the history of the United States
You'd be correct. It's common knowledge--or maybe it's not, for a younger generation--that the test shuttle Enterprise was in fact named for the fictional vessel of Star Trek fame. NASA was not even asking the public for suggestions at the time and had another name already chosen.
-
There was no clear winner
1) According to the site, 1190437 people submitted votes or named selections. "Colbert" got 230539 and "Serenity" got about 190k. Even combined, the top two choices only got about 35 percent of the vote. Alone, "Colbert" got about 19% of the vote. Even if the poll results were not biased by ballot stuffing, all they make clear is that no matter what choice NASA made, 80 percent of the voters disagreed with it. In no reasonable sense did "Colbert" win an election -- if a candidate was voted into office with a plurality of only 19% of the vote, there would be calls for his head and the system would probably be reformed.
2)Can we please stop conflating whoever put this survey on with the entirety of NASA? Some small group of people within the organization are responsible for the survey and the name selection. Complain about Bill Gerstenmaier, as it appears that he bears some responsibility for the survey and the naming, or maybe the ISS Project Office.
3)The rules did make it clear that the contest "winner" wouldn't necessarily be picked for the module name. It even gives reasons why: "NASA reserves the right to ultimately select a name in accordance with the best interests of the agency, its needs, and other considerations. Such name may not necessarily be one which is on the list of voted-on candidate names." The ISS is a big international project, and it's possible that the naming of a module might have a diplomatic effect. Relations with the Russians, our major partners on the station, seem somewhat stressed, maybe even on station. So not selecting what may be viewed as the flippant choice for a module name seems the more diplomatically sound choice.
--sabre86 -
explanation here
On the contest page, NASA has an explanation of why they chose the name 'Tranquility', as well as a little write-up of the COLBERT thing.
-
Re:Tranquility?
That was my reaction when I saw the show last night, too.
They not only decided to ignore the write-in winner, but also to ignore the winner amongst the 'finalist' names that NASA had selected.
Based on numbers reported from MSNBC:
- Colbert : 'more than 230,000'
- Serenity: about 190,000 (lost 'by more than 40,000 votes')
- Myyearbook: 147,637
- Gaia: 114,427
From that, we know that Tranquility is under 114,427
-
Re:Personally
actually, no:
"However, even just the electrical current of lightning is considerable -- 20,000 amps on average, the same as 100 steel welders. But the power is on for only a brief fraction of a second, so the total power is actually small, only enough to power a 100-watt light bulb for six months."
http://www.nasa.gov/centers/kennedy/about/information/science_faq.html#1 -
Re:Too "Colbert"..
I don't think out-dated cargo ships will be flying around out in space anytime soon
-
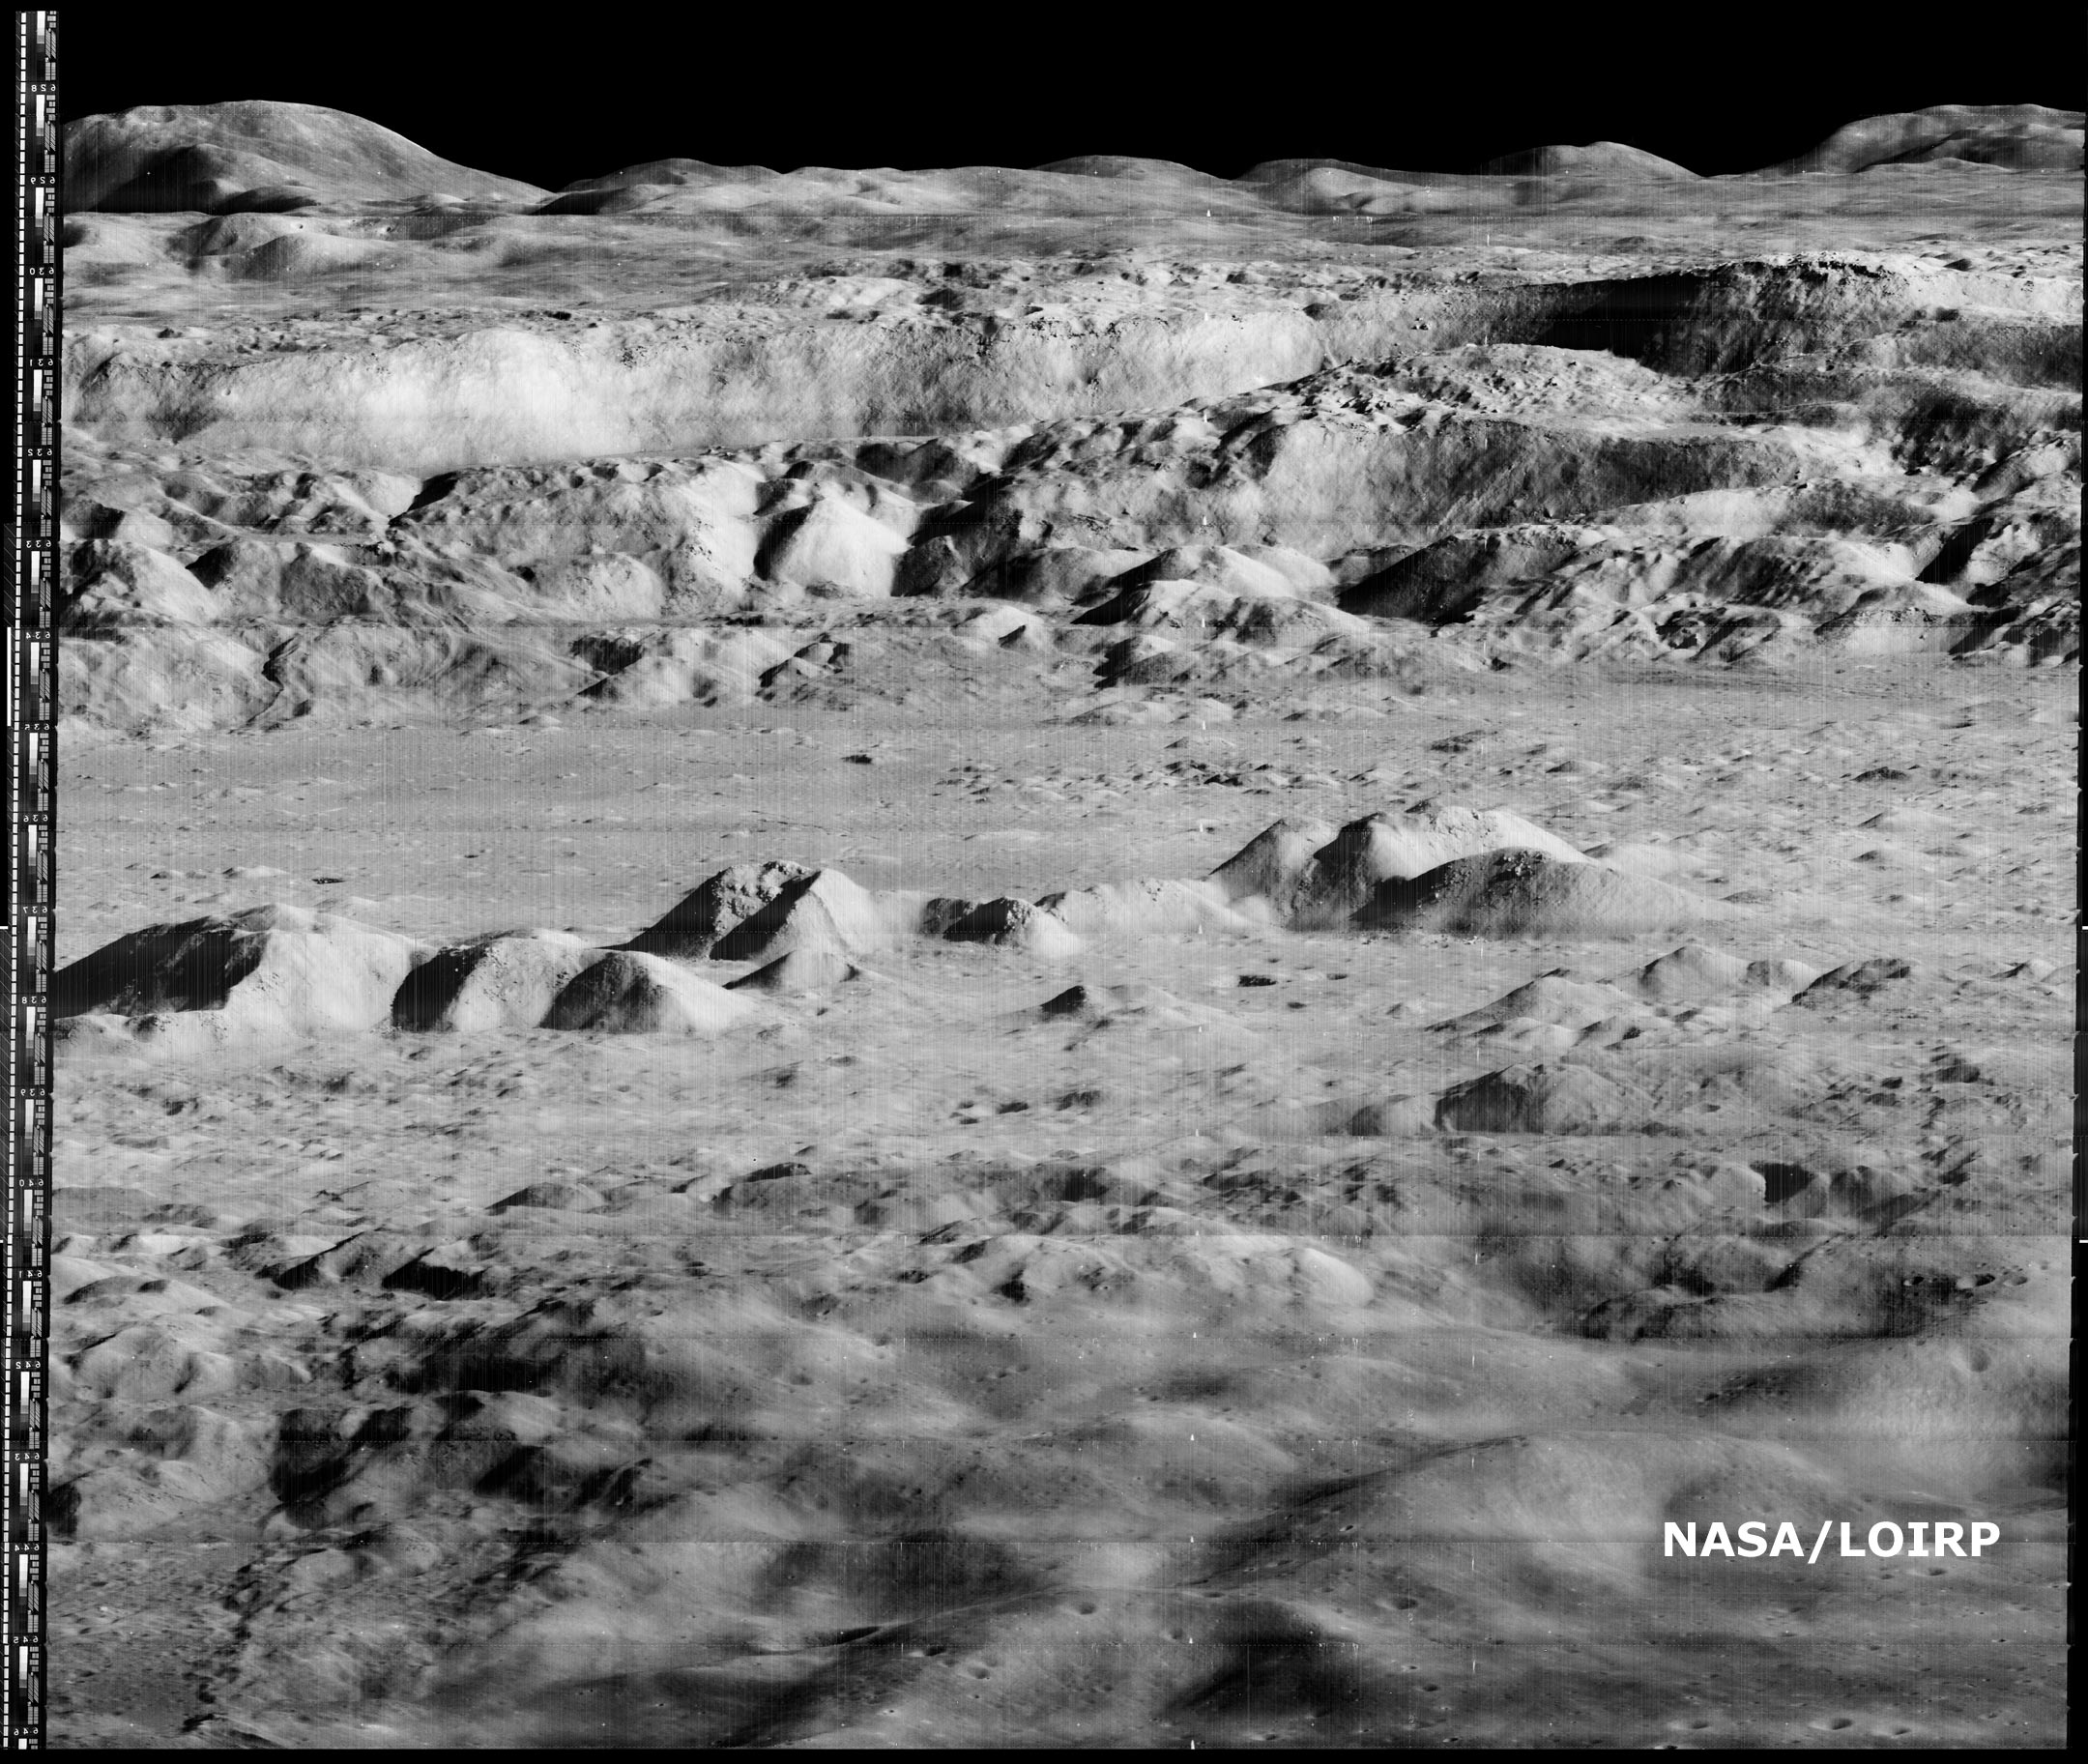
Re:Irony
A larger, raw version (2.2 GB in size) is now online at NASA's Lunar Science Institute.
-
Re:Any news on lost Apollo 11 tapes?
. but so far we haven't seen ANY of the HD footage...
http://www.jaxa.jp/press/2007/11/20071107_kaguya_e.html
http://www.planetary.org/explore/topics/kaguya/hd.htmlA lot are downsampled, but I'm guessing the HD footage is available in some way. I just picked the first couple search results.
I don't know about the tape machine but I read they had to restore one of the only available machines left to working order before beginning at all. Luckily they managed to fix it. I'm guessing you can't just use any read head or machine for any tape.. either that or it does processing that would be expensive and infeasible to recreate in software. I'm sure they would have gone an easier route if there was one. These aren't dumb people. The tape reader didn't cost them $300k (or anything) so there's no point to including that.
As for a lunar rover, lunar orbiting robotic satellites would be a much better way if you want to film the entire surface of the Moon. JAXA's Kaguya is doing that and the Indian Chandraayan I believe too. For example, Mars is bigger than the Moon, but the Mars Rovers haven't seen that much of Mars as an overall percentage.
Also:
http://nssdc.gsfc.nasa.gov/nmc/masterCatalog.do?sc=LUNARROThe Lunar Reconnaissance Orbiter (LRO) is a Moon orbiting mission scheduled to launch in May 2009. The first mission of NASA's Robotic Lunar Exploration Program, it is designed to map the surface of the Moon and characterize future landing sites in terms of terrain roughness, usable resources, and radiation environment with the ultimate goal of facilitating the return of humans to the Moon.
It will have a high-res camera. I don't see any specs though.
-
Re:So...
-
Re:So...
-
Re:Irony
Here's a nice hi-res image: http://images.spaceref.com/news/2009/lo2.copernicus.med.jpg
Approx 2160px × 1825px and 700 kbAnd if you're really brave, there's a 2gb scan online!!!
http://lunarscience.arc.nasa.gov/files/LOVframe162h3.tifI imagine that might take awhile to load into your browser. I can't imagine pictures being posted online in the gigabyte range... maybe 50 years from now that will be a standard porn format, who knows o_O
-
Re:Irony
You can download the full[? 1700x3600px] resolution image from NASA's website:
http://www.nasa.gov/topics/moonmars/features/LOIRP/loirp-gallery-index.html -
Re:Irony
Is this whats your looking for?
http://www.nasa.gov/topics/moonmars/features/LOIRP/LOIRP_moon.html
-
Monitoring and explaining changes
It always amazes me that people doubt the ability of climate scientsist to monitor and explain changes on Earth where there are hundreds of lines of evidence with literally millions of data sets. What's even more amazing is they base these doubts on evidence from the same climate scientists monitoring and explaining changes in other planets, planets where we have far fewer and much shorter lines of evidence.
Do you really think that many scientists have somehow failed to notice the firey ball in the sky? Besides the output of the sun has gone down over the last decade and the RATE of temprature INCREASED has somewhat flattened over the last few. With a bit of luck it will go into a long quiet period and give us a bit more time to do something "down to earth" about our emmissions. -
Re:Venus
"Wouldn't [Venus] provide a stable base line to compare our own planet's temperature against?"
No, Earth's climate is unique due to the influence of life apon it for the last ~4 billion years. But even ignoring the fact life is largely responsible for the composition of Earth's atmosphere, Venus has a day longer than it's year, has a more circular orbit than Earth, does not posses an ocean, has an atmosphere 100X more dense,... Possibly it serves as a nearby example of the runaway greenhouse effect, but that's about it.
"Venus seems like it would be a great indicator of planetary warming due to solar variance."
Even if it was, why use indirect techniques that will take years of observation to give an outdated result when we already have direct monitoring of the sun's output? -
Re:Maybe we're on the wrong side of the sun?
Moreover, it is possible to discern the sunspots on the non-earth-facing side using helioseismology. Soon, we will be able to use the Stereo satellites to observe that side, too.
-
Cycle on track
The sun spot cycle appears to be on track: http://solarscience.msfc.nasa.gov/predict.shtml
-
Re:Whew, no problem then
You mean this data?
Interestingly, I posted another reply to your parent comment that also included those links. Except, I linked to the main page. I was referring to the figures above the one you directly linked to. Figures A2 and A show the Global Annual Mean Surface Air Temperature Change, measured using two different data sets. Uncertainty is indicated by the green bars. Notice the trend in both figures.
The graph you're talking about from 1880 onwards is from this paper, where they specifically state that the warming in the U.S. is known to be smaller than the rest of the world. The reasons for this are not (to my knowledge) completely understood. But the rest of the world have had temperature sensors too, and we've had satellites up for decades which provide the basis for the statement that global temperatures are increasing faster than temperatures in the U.S.
In my opinion, any evidence based on "global temperature" that includes data from more than just recent years should be viewed with scepticism, because our worldwide measurement and calculation techniques have changed dramatically, which likely skews the results in one direction or another.
Figure A (linked to above) is based on this article, which describes adjusting for inhomogeneities in station records and station history adjustments. Sensibly integrating differing datasets is an irritating task, and it's an ongoing process. But it doesn't seem to be a problem climate scientists are ignoring- the techniques for dealing with non-uniform noise characteristics for different data sets are well known.
Furthermore, we don't just have to rely on mechanical recording devices. Tree rings, coral growth rates, borehole measurements and ice core proxies can be used to independently verify the temperature record. They agree to within the limits of experimental uncertainty.
NASA presents data on mean global temperature extending from today back to 1880 as a single line graph with no error bars, which is ridiculous.
Yes, the particular graphs you linked to on that page aren't very detailed. Instead, I suggest the IPCC 4th report. Download chapter 3, open the PDF to page 15 (which is labeled 249) and look at figure 3.6. It includes 5-95% error bars. The trend obtained from the data in figure 3.6 is 0.65 C plus or minus 0.2 C over the period from 1901 to 2005. The report notes that this rate is higher than at any other point since the 11th century.
My point is that arriving at a "mean global temperature" is a very difficult calculation to make.
I wholeheartedly agree. I think scientists should be careful to state the estimated uncertainty in all their statements, and abrupt climate change is no exception. It's just that the error bars are now small enough to rule out the hypotheses "climate change isn't happening" and "climate change is largely natural."
-
Re:Whew, no problem then
Look at the data again. There is most assuredly a dramatic warming trend, despite the slight decrease in global mean temperature over the past few years. Run a regression on the data, it's quite clear.
You mean this data?
http://data.giss.nasa.gov/gistemp/graphs/Fig.D.lrg.gif
Or this one?
http://data.giss.nasa.gov/gistemp/graphs/Fig.C.lrg.gif
In my opinion, any evidence based on "global temperature" that includes data from more than just recent years should be viewed with scepticism, because our worldwide measurement and calculation techniques have changed dramatically, which likely skews the results in one direction or another. NASA presents data on mean global temperature extending from today back to 1880 as a single line graph with no error bars, which is ridiculous.
Instead, look at the temperature trends I linked to above, based only on direct measurements made in the United States since 1880, or "mean global temperature" using modern measurement techniques (since 1996). These datasets are, IMO, the only ones we can believe with any confidence. Is there a dramatic warming trend? The answer is as likely no as yes, or a resounding "we don't know".
Here's another interesting way to look at the data:
http://www.uoguelph.ca/~rmckitri/research/nvst.html
Mean global temperature versus number of measuring stations. In the 1990s the dramatic temperature increase coincides with the loss of thousands of Russian measuring stations when the Soviet Union collapsed. My point is that arriving at a "mean global temperature" is a very difficult calculation to make.
-
Re:Whew, no problem then
Global Warming theory has met neither of those requirements. The main statement of Global Warming is something like this: "small changes in the amount of CO2 in the atmosphere cause large changes in global temperature". Despite this theory, there is absolutely no evidence that a change in CO2 has ever caused the temperature to change, over the entire billions-years history of the planet. So GW theory doesn't explain past observations.
Abrupt climate change is a direct result of an unprecedented excavation of fossil fuels, and the combustion of said fuels which releases CO2 into the atmosphere that's been trapped for millions of years. It's not supposed to explain past observations.
It doesn't explain current observations either: CO2 concentration has steadily increased over the past 100 years, while temperatures have gone up, then down, then up again, then down again (as they are currently). There is no dramatic warming trend as predicted by GW theory.
I've never met a scientist who made a claim like the one you're attributing to me. Most scientists recognize that long term trends are only discernable in the data after accounting for annual variations, multi-year variations, etc. Once those fluctuations are removed by a 5 year averaging procedure, a disturbing upward trend is apparent.
Finally, GW has not made any unique predictions that have later been confirmed as true. It predicted more and bigger hurricanes; that hasn't happened. It predicted significant temperature increases; that hasn't happened. In fact, the theory seems totally based on computer models that have failed to make a single correct prediction about the climate ever since I first started following the issue, in 1998.
First, the temperature is increasing. Second, the IPCC's Fourth Assessment Report made a very limited claim regarding hurricanes: "It is more likely than not (>50%) that there has been some human contribution to the increases in hurricane intensity."
Third, Meehl 2004 showed convincing proof that natural forcing can't account for recent global temperature trends, but including anthropogenic forcing provides a good match for the data.
-
Re:Whew, no problem then
You are not a climate scientist ?
You seem to have an awful lot to say on the issue, but none of it is your thoughts, just regurgitated media pap.
You are not the final authority on AGW, and you don't seem to be able to form an independent opinion, preferring instead to berate others for using their brains and not following the political bandwagon that is AGW.
Have you read this ?. In fact have the whole lot.
Yet another piece of evidence that it is going to happen despite all your whining. There is no debate, there is global warming, it is part of the natural cycle called climate change. Winning an argument at all costs doesn't make you right, it makes you an asshole. So what if we accelerated the change. It is too late to go backwards, and even if it weren't, you may as well try stopping plate tectonics.
Goodbye. -
Re:Yeah, but...
they [ice shelves] are normally a couple of meters thick
Since they are so thin, then clearly my concern has no basis.
OTOH, NASA states the maximum thickness of the Wilkins Ice Shelf is 200 - 250 meters. Without knowing more about the topology of these sheets and they way they fracture, whether the area of reflective surface increases significantly seems to remain an open question.
From the satellite photos, it does appear that the shards from the break up has increased the amount of reflective surface by quite a bit from what it used to be.
-
Re:If the ice melts
"While I would agree that we are losing ice, what I would want to know is this: how does this compare to the "long warm" we experienced during the middle ages?"
Look at the age of the ice shelves that have collapsed over the last decade or so, does the fact that the ice they are composed of predates the medieval warm period by millenia tell you anything?
"I have yet to see any studies that answer all of these questions."
Then you haven't looked very hard. Your questions are full of incorrect assumptions, false assertions, and ancient red-herrings but here are some terse answers just in case you have been living in a basement for the last decade...
1. Yes, the later half of the 20th century was warmer than the medieval warm period (MWP), the MWP did not last to the little ice age(LIA). Every year in the 21st centry has been hotter than any year in the 20th centutry except 1998.
2. Solar output has gone down over the last decade but temps are still going up albeit on a shallower slope than the 90's. In other words the physical effects of the sun do not make the physical effects of CO2 magically dissapear.
3. The "scientists predicted an ice age in the 70's" is a myth, the myth is based on an article in the Nation Geographic and subsequent newspaper articles. The national academies of science warned humans were warming the world in the 50's, they also said soot has a cooling effect, some people have trouble holding two ideas in their head at the same time.
Since you obviously haven't looked further than outdated right-wing opinion columns here is a list of common myths, you will find most of your post in there.
"I think it is better to have ALL the answers before we order the entire planet to change(and make people like Gore and his "carbon credits" scam rich) don't you?"
AFAIK Gore is already rich. Regardless of what you think Gore says or does, his behaviour does not excuse you from ignoring basic risk management and making alarmist claims on the economy which are unsupported by fact. -
Re:If the ice melts
NASA? The same NASA that went 7 years without ever noticing a problem with their methodology that was detectable with an open source statistics package?
7 years? How could Nasa have missed "that 1934 and not 1998 was the hottest year in the US" for 7 years in 2007, when they said in 2001 that "1934 was the hottest year in the US"? Well, sorry, but before you criticize NASA, you should get your own numbers up to date.
-
Re:Yeah, but...
IANAOceanographer. But according to wikipedia, the ocean has a volume of approximately 1.3x10^9 cubic kilometers. According to NASA the Wilkins ice sheet has an area of 13680 square kilometers and a maximum thickness of 200 to 250 meters. Taking 225 meters as the average thickness (gotta pick something), the Wilkins ice sheet has a volume of 3078 cubic kilometers. That is about 2.368x10^(-4) percent of the ocean's volume. I've tried the calculations of the effect on salinity, and either I keep making mistakes, or it's too small to show up on my calculator.
-
Ice Shelf Questions??
I have 2 questions.
According to TFA, the Wilkins Ice Shelf has lost 1,800 km^2 of ice in the past year. This article states that the ice shelf is 200-250m thick. This gives volume lost of 360,000 km^3 to 450,000 km^3; 2000m*900m*200m, 2000m*900m*250m (easy numbers). Remaining area = (1800/.14)-1800 = 11057 km^2.
First question. Is it possible that over time (think glacial timeframe, not human timeframe) that the remaining 11,057 km^2 will rebuild the lost volume? How long is this process? If I remember correctly, Antarctica is a rather dry place regardless of the amount of ice and snow seen in pictures. This would require 32.5m to 40.6m of new packed snowfall/ice to replace what broken off in the past year; 360,000/11,057 = 32.5m, 450,000/11,057 = 40.6m.
Second question. What is the air and surface temperature impact of the hole in the ozone layer? link. Would the increased UV and microwave radiation exposure, especially in the Antarctic summer months, more directly impact surface temperature than global warming?
-
Re:If the ice melts
I think the salt will just mean the fresh melt forms a layer on top, you can test it youself with a glass of salty water and some ice cubes. However we have known for a while now that overall Antarticia is losing mass and that sea levels are already rising.
Quote from TFL: "The estimated mass loss was enough to raise global sea level about 1.2 millimeters (0.05 inches) during the survey period; about 13 percent of the overall observed sea level rise for the same period. The researchers found Antarctica's ice sheet decreased by 152 (plus or minus 80) cubic kilometers of ice annually between April 2002 and August 2005."
Greenland is also losing mass. -
Re:ISS
I hate to break it to you but that's pretty much what it looks like from anywhere else on Earth.
And just to forewarn you a bit, if you go to your local amateur astronomy observatory and expect to see through a telescope what you see on the Astronomy Picture of the Day website you're going to be in for even more of a disappointment.
Real astronomy isn't like what the movies show. It's unfortunate that you can't find the wonder in seeing what's essentially a few school buses tied together traveling at ~18000 MPH from a few hundred miles away. I guess some people really do need the eye candy. -
Re:Yeah well.Well I see you've strung together another ranting sililoquy, full of strawman arguments.
lol... whatever the fuck that's supposed to mean, what does it have to do with space exploration? You're not going to move billions of people into outer space anyways, ever. Not even in 1,000 years. That's just retarded.
lol, you know how the 'world keeps us alive', you see the world is made up of living biological systems, referred to sometimes as a "biosphere". Through the externalities of human activities we been polluting (or poisoning) them so that they are getting to the point of not being able to recover. Some are already beyond that point (i.e. ocean acidification). Will they last another thousand years at this rate of consumption? Unlikely
That's what it has to do with space *infrastucture* programs. Potential options for easing the damage done and a way to maintain living standards for people. Why, is that not an option worth attempting? Too science fiction for you? Here's science fiction for you, what do you think declining population will mean to civilisation?
I never said 'move' billions of people. Thats your retarded strawman not mine. You keep doing that, are you a scientologist or something?
and then whining that you've regressed cause you wouldn't be able to win that same winning contest again today.
What a stupid comparison, if we bought *your* reasoning to the computer industry we'd go from multi-core cpu's back to an abacus. We are talking about industrial capacity, like if we didn't have the ability to build jet aircraft or ships anymore.
The Moon is dull from a scientific point of view. There's no compelling scientific reason to spend hundreds of billions to send people back there.
Well, since you avoided the question again by saying I've missed the point, I'll ask you again, why is the US going back to the moon?
Once again you're talking as a scifi nerd.
Once again you *assumed* where my position comes from. I never claimed *all* the innovative ideas came from science fiction, that's your strawman argument. Did you even look up the names I supplied and who they were, or are you to mentally lazy to cut/paste/search.
You need to understand that space exploration isn't meant to be exciting, it's meant to advance science.
So all those military and communication satellites up there are advancing science are they, or are they space infrastructure?
And having people on the Moon just isn't worth it, no matter how wet it makes your bed sheets.
So I ask you again, why is the US going back to the moon? That is the capacity the Orion capsule is a part off.
-STFU about redundancy already, even if we tried right now we couldn't terraform Mars. There's no redundancy, just fucking face it already.
DUUUUUUUUUUUUUUUUUUUUUUUUUUUUUUUUHHHHHHHHH, see OP. Do actually read posts or just launch into a tirade.
There's a reason why space agencies actually test things to deflect eventual such asteroids, thing which must I recall only happens every few hundreds of million years.
I've seen 'concepts' proposed for testing, and perhaps a planned mission but an actual test mission, I don't think so.
The possibility is still very present with the odd's pegged at 1 in 45 . That's pretty close odds for an entire civilisation, I've bet on horses with longer odds than that. That's closer and a lot sooner than the millions of years since the last one especially when the actual ability to deflect an asteroid is still science fiction.
So when were these tests carried out on an asteroid?
-
Not true
Falling into a black hole does not allow you to see the end of the universe. (The FAQ I linked to discusses one case in which a perfectly symmetric, rotating vacuum black hole does experience infinite blueshift, but the existence of matter or quantum gravity effects very likely destroy that property of the black hole.)
-
A little reading, please
Is it too much to ask for people who read a supposedly tech site actually read, and perhaps think, before pounding their keyboards with things like "how's that little thing going to get 6 astronauts to Mars?", "NASA is stoopid", and the like?
Its proposed use is to carry up to 6 astronauts to the space station, and from there, 4 to the Moon. For the Moon missions, Orion will travel along with the Altair lunar lander.
For Mars missions, "Orion could rendezvous in low Earth orbit with vehicles that will take explorers to other destinations in our solar system such as Mars." http://www.nasa.gov/pdf/306407main_orion_crew%20_expl_vehicle.pdf
These Mars-bound vehicles will be assembled in low Earth orbit. There is no reason to believe that 4 or 6 astronauts would be confined to the small Orion capsule for the duration of a Mars voyage.
On a side note, I was 5 years old when I watched the first manned landing on the Moon. It's amazing to me that a manned Mars mission may happen when I'm in my 70's. Certainly not how I imagined things when I was young.
-
What? Don't you read their blog?
Why are you all still in the '90s?
http://blogs.nasa.gov/cm/blog/Constellation/ -
Re:It's Evolution, my dear Watson
"See better or die. Simple."
[...]
To get an 'evolutionary' effect out of video gaming you'd have to look at self-selection, I think. In other words, a case where it's not that playing a game makes your eyesight better, but just that normally-sighted people drop out en masse and the only players left are super-sighted freaks.
What's happening here seems to be more interesting than just selection.
Nature is a tightfisted lady. natural selection gives a set of potential abilities, but if you do not use them, they fall by the wayside. Think about how astronauts bodies lose mass and bone density in space.
the human race has been shaped by its tribal structure; the ability to discriminate visual info for hunting, while handy for everyone, kept honed probably only in the individuals who specialized in hunting. nature discarded the immediate availability in other members of the tribe. -
Re:Paranoia?
Not only silicon... NASA astronauts consistently observe bright flashes in orbit, whether their eyes are open or closed. It is believed that these flashes are the result of cosmic rays interacting with the astronauts' retinas.
-
Re:There is money and publicity
The claim that ozone measurement started in the 1980s is simple wrong. Measurement of the levels of ozone occurred well before we had satellites. Ozone measuring began in 1957. See http://ozonewatch.gsfc.nasa.gov/facts/history.html Your comment about natural cyclic elements to the ozone levels is misleading. There is a natural cycle and it is large. What was observed was a slow, steady reduction in the average level even as the larger cycle progressed. The Wikipedia article gives a good summary and some citations and references which should explain things well: http://en.wikipedia.org/wiki/Ozone_depletion