 Slashdot Mirror
Domain: nrel.gov
Stories and comments across the archive that link to nrel.gov.
Comments · 436
-
Apples, pears, and EROIYes, we are comparing apples or pears. But not the way you think. I've been reading more EROI papers, and it comes down to this: Solar, wind, hydro, and nuclear EROI numbers are largely inclusive of their externalities, conversion efficiencies, and construction embodied energy. Whereas typically fossil fuels EROIs are based on a simple energy in-to-thermal energy out at the well head. So in comparison, fossil fuels EROIs are very optimistic.
Cutler Cleveland (Director of the Center for Energy and Environmental Studies at Boston University) appears to be one of the leading energy analysts these days, his work is quite broad. In "Net Energy from the extraction of oil and gas in the united states", Int. Journal of Energy 30 (2005), he shows that US Oil production has a EROI of 11 for energy in/thermal energy out. And gasoline is 30-50% of this value (ie 3.3-4.5 EROI). Now that doesn't include conversion efficiency in a car or power turbine, nor does it include the embodied energy of the extraction equipment or ICE/power plant to burn it.
If you make calculations just for conversion efficiency (33% ave) of US oil converted to electricity/mechanical power has EROI of 3.6, and gasoline in a car is less than 1 (meaning that the energy to do mechanical work in a car is being subsidized by by electricity (coal) to run the extraction equipment). And still we haven't considered the embodied energy in the extraction equipment or the ICE. (now of course middle eastern oil is 3 times better than this) That is very poor EROI! And coal isn't looking much better. Both of these resources EROIs have dropped by at least a order of magnitude over the last 100 years as extraction becomes more difficult. The future of fossil fuels by EROI analysis looks bad.
As for Alsema, he does review the added embodied energy of infrastructural components in section 4.5 of the paper. For complete balance of systems analysis (inc. frames, structures, concrete, maintenance, etc) the best technologies (thin films and ribbon Si) have EPBP of 1.2-2 (15-25 EROI @ 30y, 25-41 EROI @ 50y). scSi is around 3.3 years (9 EROI @ 30y, 15 EROI @ 50y). Analysis shows that PV energy is manufacture side heavy, with little continuing energy inputs as would be expected from a solid state, fixed, and essentially maintenance free device (how often do you maintain your current roof shingles?). However, even his latest numbers are out of date as he notes getting information from manufacturers is difficult because EROI calcs involve knowing trade and financial secretes so it takes a long time to get agreements in place. Also his calcs don't use the best efficiency panels on the market, which underestimates EROI, if that was the criteria on which we made purchases. Also multijunction concentrators, should be significantly better since 1) they use less material per peak watt and 2) they have a higher efficiency. References: Here,Here, Here, Here
What's the end result? EROI calculations beyond first or second order become quite tricky and controversial. But we can show that solar in a detailed "second order" or more EROI estimate looks very favorable compared to even a "first order" estimate of oil, NG, or coal.
-
Re:Its not about power density, its about economicHmmm. I take that post as agreement. Obviously Smil is massaging the truth (and you are starting to look silly defending this guy, who in 7 posts is proved wrong again and again - time to read a broader group of authors?). I'm looking forward to getting past your FUD, and discussing your other questions, but first we must get pass the nonsense.
I avoided anything that was tracking, took all the fixed rates, added them up together, averaged them
As did I, only i used NRELs annual statistics not your uninformed calculations of their raw data (no offence). Since we seem to go over this again and again I will spell it out for you. Though at this point I think you are just being obstinate. From the rredec database:
"City: ","KANSAS CITY "
"SOLAR RADIATION FOR FLAT-PLATE COLLECTORS FACING SOUTH AT A FIXED-TILT (kWh/m2/day)
"Tilt(deg)"," ","Jan","Feb","Mar","Apr","May","Jun","Jul","Aug", "Sep","Oct","Nov","Dec","Year"
"Lat ","Average", 3.8, 4.3, 4.8, 5.4, 5.6, 5.8, 6.0, 5.9, 5.4, 5.0, 3.8, 3.3, 4.9
" ","Minimum", 2.7, 3.3, 3.5, 4.2, 4.6, 4.9, 5.2, 4.8, 3.5, 3.8, 2.7, 2.5, 4.5
" ","Maximum", 4.8, 5.4, 5.7, 6.4, 6.4, 6.6, 6.8, 6.6, 6.8, 6.6, 4.9, 4.3, 5.5Now look at that last column, "Year". Look at the row "Lat Average". 4.9kWh/m^2/day. Got it? If not, want to see a map of the same data? I don't know what you want, whack you over the head with a dozen sources? Here, here, here
So 7% of texas land mass to produce ALL of our energy use, only 0.8% for our electricity need. Using fixed panels (not even adjusting the angle seasonally), including shading. I didn't use the best location, but an average location. This doesn't translate by any stretch of the imagination into all of Texas. More importantly I showed we don't to use any new space at all.
You also are naively using 3 * 10 ^ 13 kW as our total energy source that would need to be replaced - the difference is that 90+% of that energy is in a form that we can directly use - natural gas for heating and gasoline for burning, coal for making steel, etc.
WRONG! JUST THE OPPOSITE. We've compared solar for PRODUCTION EFFICIENCY OUTPUT to US GROSS ENERGY CONSUMPTION (my mistake really). So if you want to do a REAL comparison, we need to calculate a conversion efficiency of current energy sources based on end-use (for oil, coal, Gas).
Transportation = 25.65 Quads @ 20% ave conv efficiency
Heat = 23.09 Quads @ 90% ave conv efficiency
Electricity = 35.30 Quads @ 33% ave conv efficiency
Nuclear+Renewable Electricity = 13.99 Quads @ "100%" efficiency (numbers ARE net)
-----------
50.3 Quads Net energy produced. NOW WE ARE AT ONLY 3.5% OF TEXAS.Ready to discuss storage, transmission, grids, seasonality, etc Yet? I think you've lost this part of the argument.
-
Re:Its not about power density, its about economic
*sigh*
I got the number from your source, over a thirty year period, at:
text rredc
I avoided anything that was tracking, took all the fixed rates, added them up together, averaged them
Unlike you, however, I'm trying to take into account the various inefficiencies and penalties that you get from using solar power - from penalties for storage, penalties for conversion into other energy carriers, penalties for the infrastructure involved in this conversion, penalties for transmission, and penalties for handling peak load.
And of course penalties for all the energy used to build and maintain the solar cells and the architecture behind them in the first place. I've seen EROEI's from anywhere less of one to about 3, taking the whole infrastructure of solar cells into account.
So yes, we disagree pretty much from the get go. Trackers are a red herring - there is only *so* much power available to gather from any given spot, and trackers just save on material costs.
I could calculate again, but we are essentially calculating different things. Your experiment is quaint at best, and misleading and false at worse. Money is a problem, yes, but so is transmission, storage, inefficiencies in capture, inefficiencies in maintenance, etc. etc. etc.
*That's* where I get an infrastructure the size of texas. By your naive calculations you are already up to 7% - double that, and that's more realistic IMO.
For example, the solar concentrators which you talk about have to have moving parts to get that 40% efficiency because they need to track the light source to concentrate the energy. These parts, whilst efficient, take an energy penalty of their own, and due to the need to directly track the sun point source in the sky, require a larger amount of area per device than you imply.
Average this out, and you're back to getting about 20-60 W/m^2 of energy for solar - which is the reference figure that I've seen everywhere except for you.
This of course is *before* any of the efficiency penalties that I've talked about.
You also are naively using 3 * 10 ^ 13 kW as our total energy source that would need to be replaced - the difference is that 90+% of that energy is in a form that we can directly use - natural gas for heating and gasoline for burning, coal for making steel, etc. You therefore take a penalty if you want to convert the solar into these forms of energy.
Lets take a different tack - overall, the earth intercepts at its surface about 87 PW of energy average. We use 12 TW (source: 'energies' by smil). That means that we use 1/7200 of the total solar flux of the planet. At 100% efficiency, therefore we would need 1/7200 of the earth's surface covered in solar cells - and since over 70% of the earth's surface is covered by water, approximately 1/2200 of the continents.
Since most of the solar needs to be converted to usable forms, I've been using a 60% penalty, which means that about 1/1360 th of the earth's continents would be needed to be covered by solar cells if everything was 100% efficient.
This equals 225,000 km^2. At 40% efficiency, this equals 562,000 km^2.
Since the current infrastructure is approx 290,000 km^2 - and of that, around 2% of that is energy production - the costs for the infrastructure in just collecting the solar power are bound to be more expensive than the current costs.
Just collecting is - even at your rather optimistic calcs - over 100 times more costly in terms of real estate than our current scheme!
And that is not even considering the *other* infrastructure involved, or the inefficiencies that I've talked about (and you haven't responded to). Or the low EROEI.
Anyways, look, I have NO problem with solar power. I hope that it goes gang-busters, I really do. You have yet to convince me. You just happen to be in solar technology before scalability issues become a factor.
But go ahead, lets stop with this area issue. You said that you'd like to respond to the other issues, so please do.
horos -
Re:Its not about power density, its about economicLink works fine from here. Try: http://rredc.nrel.gov/solar/old_data/nsrdb/redboo
k You've realized that my numbers are in fact right, yes?
-Double dipping-
These are quick numbers to show you the ballpark of land-consumption, we assumed a 2-D array, we didn't count shadowing NOR did we count that the panels are angled around 39 degrees thus taking only 77% of the land space we counted.1. Even if you used fixed panels in one giant array at an angle equal to latitude, ~ 39 deg angle the land used becomes only 28% greater than the panel area. For an average insolation location like Kansas City having 1800 kWh/m^2/day x 40% efficiency = 720 kWh/m^2/year. 2.88E13 kWh Total US energy/720 = 15444 mi^2 panel area x 128% to account for shadowing = 19768 mi^2 OR a 140 mile square. Now we are up to a WHOPPING 7% OF THE TEXAS LAND MASS with fixed no moving parts panels. WooHoo. Trackers would of course do much better.
2. This is a visualization exercise. In fact, all the US power would not be generated in one place. Shadowing is only a problem in 2D arrays, however we can arrange them however we want. 2D arrays on buildings do not have shadowing due to the slope of the roof. 1D arrays don't have this problem. Though not possible everywhere, they are in some places such as the 1500 mi^2 of idle land sitting below large electric transmission lines, or highway midians, etc. You see the great thing about solar is we literally can use almost any under utilized space for power production (roofs, parking lots, superfund sites, etc).
-An Example- Near my house there is a typical suburban shopping plaza. Contains 5 big box stores (homedepot, target, walmart, etc) all 150-200,000 ft^2 plus a dozen 50,000 ft^2 stores. That's 1.6 million ft^2. With 40% efficient fixed panels at an average of 2000 kWh/m^2/year insolation that's enough energy for 30,000 homes! Put panels over the parking lot (as is being done in California - dual purpose shade and energy) which is 150% as big, and together we have enough energy to power 72,000 homes FROM ONE SHOPPING PLAZA with no extra land used and no trackers.
-Alabama-
First use the REAL 30 year average numbers not a cherry picked number (how did you come up with that? Your number is far less than the worst year out of 30 years for a panel FLAT on the ground: 1553 kWh/m^2/year). The average annual insolation on a flat panel in Birmingham is 1606 kWh/m^2/year at 0 degrees (flat on the ground), 1788 for a panel at latitude (this case 33 degrees), 2263 kWh/m^2/year at latitude with 1 axis tracker, and 2336 kWh/m^2/year for a 2-axis tracker.I'm still interested in answering your other questions, but I want to make sure you really understand that land use for solar is small (at most any efficiency 10-40% with or without trackers), smaller than many other energy resources currently in use (e.g. coal), AND in fact we don't need to use new land at all (which is pretty much unique to solar. And perhaps arguably wind, wave, and geothermal). If you understand that point now, and are done nitpicking technical details of infinitesimal returns, I'm happy to move on.
-
Re:Its not about power density, its about economic
pps -
I think I see where things are off, and where our numbers differ. They do in fact reconcile. You CANNOT USE A TRACKING MECHANISM TO DETERMINE SOLAR POWER DENSITY.
For if you do, you are basically double-dipping your calculations.
Figure: If a plate is tracking the sun, it is swinging out an area greater than the plate's area itself (for as it tracks, it gathers energy that would otherwise miss). In the process IT BLOCKS OTHER PLATES THAT WOULD HAVE OTHERWISE GOTTEN THE SAME ENERGY.
If you take, say the numbers for Birmingham, AL over the last 30 years,
your reference from rredc.nrel.gov
You'll notice that the flat collectors get an average of 3.5 kwH/m^2/day, which turns into about 165 W/m^2.
Its the dual tracking collectors that get the large amounts that you are talking about. However, the tracking collectors can't be placed directly next to each other, because they cast a SHADOW on each other.
My guess is that if you take this shadow into account, the benefits you get from tracking are greatly reduced (not eliminated because of better conversion efficiency) and the total that you CAN get is approx, on average 170W/m^2 (which goes along with the satellite data)
This is the only explanation that makes sense. My satellite numbers aren't lying, neither are your numbers - they are just double dipping when you make the assumption that they can be applied to large areas in 100% coverage.
Hence, the 100*100 sq mile solar concentration is way too small, by an order of magnitude or so, and we are still talking about an infrastructure the size of texas.
horos -
Re:Its not about power density, its about economic
Sorry if I don't believe you. First, 964kWh/m^2/year means that you are extracting 110 W/m^2, when in Kansas the total amount there is about 140 W/m^2 - which means you are getting 80% efficiency.
Before we can move on the rest of your argument, you need to use REAL numbers for insolation. I've given you the links to the definitive government resources, but you keep on using the same bogus numbers. Come on, you are a smart guy!So here it is:
Kansas City = 6.6 kWh/m^2/day average for a 2-axis tracker.
x 365 days/year
= 2409 kWh/m^2/yearx 40% concentrator module efficiency @ 500 suns (NREL, Entech, Sharp)
= 963 kWh/m^2/year. GOT IT?US Energy consumption = 2.88E13 kWh/year
/ 963 kWh/m^2/year
= 3E10 m^2 OR 11544 mi^2 (a 107 mile square)/ Texas 267,277 square miles
---------
=Which part of this isn't clear?
Even if it were a third that efficiency, the land area is minuscule.
-
Re:Its not about power density, its about economic
*average usable power* is approx 170W/m^2
If he means by this average usable power per day including darkness, then hes not far off. (1000 W/m^2 X 6 hours of peak sun)/24 hours per day = 250W/m^2 per 24 hours. BUT this is misleading, watts are peak POWER measurements not ENERGY. The energy stays the same in either case: 1000 W/m^2 X 6 hours = 6000Wh OR 250W/m^2 X 24 hours = 6000Wh. See?
In reality, the solar flux density (same as power density) varies between 250 and 2500 kilowatt hours per meter squared per year (kWh/m^2/year).
These numbers are right on, similar to what I've been showing you (1000 W/m^2 x 6hour peak/day x 365 day =2190 Wh/m^2/day). Except 250 is way too low(even Barrow, AK 375 miles north of the arctic circle gets 912 Wh/m^2/year, and 1314 with a tracker). Here a selection numbers right from the 30 year average weather history statistics for flat plate solar panels taking into consideration incident of insolation (first number is a fixed panel at an angle equal to degrees latitude of the city, second number is a panel on a tracker - numbers in Wh/m^2/year):
Tucson = 2372 (3285)
San Francisco = 1971 (2591)
Kansas City = 1788 (2409)
Seattle = 1350 (1788)
Denver = 1825 (2701)
Columbus = 1533 (1971)
Boston = 1679 (2153)
Buffalo = 1496 (1934)
Anchorage = 1095 (1460)To get the annual energy produced per m^2 multiply by the PV panel efficiency. For example, at 17% efficiency in Denver 310 kWh/m^2/year on a fixed panel, 459 kWh/m^2/year on a tracking panel. Multiply this by the number of square meters of roof in the US, and you get 6.99E12 kWh/year for Denver fixed panels, and 1E13 kWh/year for Denver tracker (not all places are the same as Denver, but they aren't all that different either - its an example
I'm sorry my friend but you sound like you have a SERIOUS agenda. (silicon with solar having a greater energy production per pound than nuclear fuel? Yeah right.
The quote (which is true, Lovins is very accurate with his numbers) is not meant to be more than it is: an interesting comparison between solar and the current and real state of nuclear power in the US (light water reactors are capable of using only a fraction of their fuel before they are spent). Of course breeders or other designs could produce 100-1000 times as much energy per pound, but they have their tradeoffs too (which is why we chose not to use them).
And of course, that doesn't even touch the fact that the major problem that we are facing is not going to be electricity shortage, but energy carrier shortage.
Exactly. Solar power is available everywhere (did you notice the deviation between the alaska and arizona is only 2-1?). Solar IS the ultamate distributed power source. If most of the power is generated locally, they carrier requirement of transmission is HUGELY reduced, and overall costs come way down.
Tell you what - would you agree to having the government both subsidize the development of solar technologies AND next generation nuclear ones, and see which one wins?
The problem is
-
Re:Its not about power density, its about economicPlease learn about the subject before you respond. Energy is my area of expertise, am I'm always appalled by how engineers and geeks can tell you the latest in computer technology to the day, but are 30 years out of date (or just completely misinformed) when it comes to renewable energy.
averages 170 W/m^2 when it reaches the ground.
Yikes! Here the first problem with your calculations! Solar insolation is 1300 W/m^2 outside the atmosphere, 1000 W/m^2 on the ground in peak sun conditions. NOT 170! (look it up yourself you'll find tens of thousands of refs on Google)
expect to use intermittently depending on weather and time of year.
insolation FOR A FIXED panel at an angle equal to latitude provides an average of 6 hours of peak sun per day in the average US location. (of course the solar insolation is changing based on time of day. However this is how it is specified in the industry: pre-integrated to an equal number of peak hours). That equals 2190 kWh/m^2/year. Some locations a little more, some a little less. With trackers this goes up 25-50%. See the National Renewable energy laboratory insolation database and mapservers for more data.
inefficiency of incorrect angles in capturing the energy
Already considered see above numbers are already based on tilted fixed panels. Trackers of course improve the angle and thus the energy, but I'm giving a simple case, not best case.
storage costs, maintenance costs, spacing inefficiencies
Spacing is accounted for, 17% is total edge to edge module efficiency not cell efficiency. Maintenance costs, essentially are none (solid state revolution man) no moving parts, no dusting, no snow removal required (the benefits of dusting/cleaning has been proven to be of small benefit. less than 4%). Storage is an issue. There are many storage technologies and they do cost money (some solar technologies, not PV, are self storing such as Solar 2's phase change salt storage). However, energy profile on the grid tracks the solar cycle closely. 40%-60% of our energy could be replaced without substantial storage added to the system. (another 20-30% could come from wind, as the Dutch have shown, and the base load could be largely provided with geothermal, biomass, and wave. Thought I do think storage is an important piece of the puzzle.)
I don't know where you got your 'roof space' figure (2.43e11) but it seems high
From the 2000 census data for households and the DOE for commercial buildings
From the CIA factbook we use 3.602 * 10^13 kwH.
The number you show is ENERGY consumption NOT ELECTRICITY consumption, and its a little too high (I guess the are spooks not energy experts). From the Department of Energy, Energy Information Administration total energy consumption is 2.88E13 kWh. The total US ELECRICITY consumption is 3.4E12 kWh - which is what we are talking about.
Don't get me wrong, I really *want* to believe that solar is our best bet.
Today is your lucky day. The numbers are very much right (as you can now see). And we didn't have to even invoke any extra land consumption OR higher efficiency cells OR Dye-sensitized solar cells which can be used as windows on high rise buildings, etc. PV is amazing stuff with incredible potential, 40% annual market growth, prices are nearing $1/peak watt (33
-
Comparing on that basis...
The solar cells will pay back the energy used to make them in one to four years; neither slate nor asphalt shingles will yield anything.
-
Re:And what'll wean us from nuclear power?I just wanted to point out that South Dakota isn't the windiest place in the US. It's up there though and a fine state for wind power generation but the majority of the state is only 1/3 Class 3, 2/3s Class 4 and a couple tiny Class 5 spots. As far as wind speed goes Colorado and Wyoming are much better with large portions of their state being Class 6 wind resource areas. Many portions of Nevada are also also classified Class 6. The only Class 7 areas I know of in the US are on the extreme coasts, specifically around Alaska. These figures are from the National Wind Technology Center, part of the Nation Renewable Energy Laboratory. I found a site filled with maps I liked better many months ago. I can't seem to find it now though. I found this one in my bookmarks that might be it. It's not responding though so I can't verify that.
There's a large ranch just north of my parents place that would be perfect for wind generation. Here in the Flint Hills of Kansas we're rated Class 4 year round. The ranch is about 27,000 acres. I would love to be rich enough to buy it the next time it goes up for sale. Imagine if you would 27k acres of wide-open pastureland filled will either longhorns or buffalo (both highly profitable). Looming above the herd would be hundreds or thousands of large 80' diameter windmills. The new Kansas prairie. Get double-use out of the same land. I would love to do that some day. There's a 345KV line that cuts through the middle of it too. If only... I sure hope I'm rich then.
-
(d) Oh Yes We Do
"(d) We don't even know how the hell to deal with the solid waste we're producing from nuclear plants now, let alone if we ramped it up."
Dealing with radwaste is simple. Just take a big hole in the ground, cover and seal it thoroughly, and start filling it with radwaste. THEN add a low-temperature-difference power generation system, like OTEC. Remember all those thousands of years they claim you have to keep radwaste sequestered? It's actually lots less; after about 600 years, the radiation diminishes to the normal background level. Anyway, such a waste pile would give us MORE POWER for all those years, AND because people will need to maintain the power plant, people will always be there to warn others of the danger. -
Sustainable Energy PoliciesIt is not as straightforward as merely replacing one source of energy with another. While oil is running out (I highly recommend The End Of Oil), the alternatives like nuclear fuel have greater risks. Of course, some of the risks can be mitigated by proper management, but this is one case where the risks outweigh possible benefits.
A good paper on Sustainable Energy Policies is here
One option that was much raised in the price shock of the 1970s was to minimize energy waste. Unfortunately, that seems to have fallen by the wayside.
Marc Faber, Dr Doom, warns that we could see $100 oil and this could be the setting for World War III. I've discussed some economic implications of this here
-
Re:Rolling back the meter ?.
Here's hopefully a clarification of all the below, from someone who works on net metering and interconnection a solid number of hours per week...
Equipment for interconnection and backfeed into the grid are governed by UL and, more relevantly, IEEE standards. (742 and 1547, respectively.)
These have fairly elaborate specifications for, as you said, not hitting the ground protection equipment, going into non-export mode (within a certain number of milliseconds) if the grid trips off, or if the current frequency or reactive power or a variety of other things vary outside certain parameters. Most utilities also require you to have an external, lockable disconnect (for instance, for if linemen are working outside your house on a segemnt of line that's still giving you good enough power that the inverter hasn't tripped you off. (they sensibly treat power lines the same way you treat working on guns - be 100% sure it's unloaded, and then be 100% sure you treat it as though it's loaded.)
These technical standards are fairly well established by the community of power engineers to be more than sufficiently safe, and we're seeing progress in their implementation: the National Association of Regulatory Utility Commissioners, for instance, has issued a model standard for their use.
However, it's far from uniform nationwide; utilities are used to implementing their own idiosyncratic rules for every part of their grid, and this (testing and retesting the same inverters in enery state, making them programmable to comply with Podunk Utility Co's individual requirements, etc.,) has become a major cost obstacle for the use of what's termed "distributed generation."
It does vary from state to state and utility to utility; while they *are* required under the Public Utility Holding Company Act or the Public Utilities Regulatory Policies Act (don't remember which it is) to buy your power back from you, that's only at wholesale (ca. 2 cents per kWH,) whereas if you're truly net metering (and single-meter, spin-it-backwards net metering is something literally thousands of solar and small wind users legally do every day), you can get 7 - 14 cents. An easy way to check all of these, state by state, is the DSIRE website.
As for the solar energy payback timeand toxicity,which I'm frustratingly sure someone will bring up in this thread, those are essentially canards that "seem right" to those who haven't really looked into it but maybe heard it ten years ago, but don't hold up to empirical scrutiny.
-
Re:Rolling back the meter ?.
Check the national labsfor a peer-reviewed study of the energy payback of solar panels - roughly, 500% at minimum.
As for the materials solar panels are made of, they're 95%+ n and p - doped silicon; those (thin film, mostly) that are, e.g. cadmium / tellurium, have less than 1/1000 the heavy metal concentration per kilowatt seen in, e.g. NiCad batteries, and they last for 25+ years, vs. those, which are thrown away into municipal landfills (at best) much more quickly.
"Someone explain to me why the green crowd considers nuclear energy to be dirty when we can just put the waste into nonexistent reactors." That's a pretty easy one, though in all honesty, I'd like to see us step up use of some pebble-bed reactors in order to really yank down our CO2 output, and find somewhere responsible to hold that waste for a couple hundred years - you don't get free energy.
-
Re:Diesel with or without Biodiesel is a good star
Let's cut Capsaicin Boy a little slack. After all, he did mention that a fraction of the fuel is using is biodiesel.
Here's a link to a DOE summary about the benefits of biodiesel:
www.nrel.gov (248KB 2-page
Summary:
- Biodiesel is made from vegetable oil and alcohol (methanol)
- It's biodegradeable
- There's no sulphur in biodiesel, so there are no sulphur dioxide emissions
- ...read
-
Scattered thoughts on this
Most of what I have to say has been mentioned by various posters, but I wanted to put it all together.
That 3% of the farmland we would be using is unfortunately mostly located in North Dakota and surrounding states. The problem is transmitting the power from North Dakota to the rest of the country.
The power output of a windfarm is, of course, dependent on the wind. It varies throughout the day and by the season. For off-peaks, other sources are still needed, either in the form of more turbines, more sources of other kinds, or some temporary storage. All involve significant capital investment.
Offshore farms are also an option. The Danish produce a significant portion of their energy using turbines anchored offshore. Noise and safety concerns are reduced, and the turbines can be made bigger since the blades don't have to transported by road. The conditions aren't as favorable in the US as they are in Denmark, but a lot is still available. I for one think they would look a lot better off the coast by Long Beach than all those oil rigs.
A lot of people have asked about climate changes. No serious studies have been done, but I would expect the effect to be negligible. They only affect the air up to around 200m and they fall far short of exhausting all of the wind's energy in that zone.
As simple as they seem, wind turbines have advanced quite a bit since all those little mills were installed in California. People complained about noise. Blades fatigued and broke. Birds flew into them. GE's new turbines are far quieter, spin higher up than most birds fly, and extensive fatigue testing is required on all new designs. They are really quite fascinating...and huge
Visit NREL's site for information on current wind development. -
The Millennial Project!In 1992 Marshall T. Savage published the Millennial project.sub titled "Colonizing the Galaxy in eight easy steps"
A supposedly scientifically based proposal for near and far term large scale projects. His near term proposal was to make floating cites out this material (which he called "seacrete"). It was a wonderfully idea and I really like to live in such a place. But I must say the longer he goes on the more he falls on his face and just winds up being a total freak. Of course freaks are like gravity and attract other freaks so a foundation was formed and years later, circa 2000~1 I checked up on them again and the "foundation" was doing "research" in what looked to be a Florida trailer park. Naturally the Millennial Foundation faded away (although the fanatical remnants can still be found: http://www.millennial.org/see/) but spawned other groups like: The Living Universe Foundation-http://www.luf.org/. None of whom have figured out how to recover from the fact that the books foundational assumption does not fucking work: OTEC http://www.nrel.gov/otec/... yeah the NREL site sums the whole thing up quite nicely.
Still I'm only bitter because I can't live there.
-
Re:How much does it cost
For just one of the constellation of studies and meta-reviews that establishes the energy payback of a modern solar module at generally less than 5 years out of a 25-year (warranteed - 30+ is more generally experienced,) lifetime, visit An Empirical Perspective on the Energy Payback Time for PV Modules. (.pdf)
-
Re:How much does it cost
And how much energy does it take to produce a single square foot. There is a basic falicy that a lot of folks seem to miss
Actually, this is a basic falacy that you have missed. While what you say is true for ethanol, it is not true for modern photovoltaics (and hasn't been for some time). As for photothermal, you are also dead wrong.
-
Headscratching ensues.One hundred megawatts annually? Um. A watt is a unit of power: the amount of energy (in joules) produced in a second. If a building produces one hundred megawatts on average, then that amounts to 100,000 kilowatt hours per hour, or 876 million kWh per year. That's some pretty serious output there.
In comparison, the major generators in Victoria, Australia, Loy Yang, a set of brown coal burning power plants, produces 500 MW per station, for a total of 2 GW. I somehow doubt that a building can produce even one fifth of that, no matter the size of the building and the number of panels that may be put in as windows.
Let's see. A map of solar energy falling on the US suggests up to about 3000 (let's overestimate) BTU per square foot per day. That is, armound three million joules per square foot per day. That's around 35 watts per square foot. 100 megawatts is about three _million_ times that. So you're looking at a bit over 275,000 square metres to generate 100 MW of power from solar. That's a square, about 525 metres by 525 metres. And those figures are based upon horizontal facing.
Looks like somebody got some units incorrect...
-
Re:Green Indeed
Many green energy solutions can be implemented in a decentralized manner, instead of in huge projects like you mention. Installing them in this manner could make use of space that could not otherwise be used for energy generation.
Covering your house's shingles with solar panels would be expensive, but this could provide for much of the electrical needs of your household. For about $14,000, you can buy 24 165w Sharp 1575mm x 826mm solar panels, and save about $500 a year on electricity.
A 20m tower with a 7m diameter wind turbine could be installed in even a very small inner-city house lot. If you live in a reasonably windy climate, this could generate all the electricity you need for about $25,000.
I know these are expensive solutions, but certainly not impossible. The prices will come down.
-
Wrong, Wrong, WrongSo much misinformation, so little time.
When you have 8-12% efficient solar panels
8-12% is a little low. Current product cell efficiency are around 14-18%, and Concentrators w/ multijunctions get 30%. But who cares? Your car gets 15% efficiency in average use, nobody complains about that even thought you pay for the gas. Sun is free. The question is does 15% efficiency do the job? Yes. Even if it gets no better, it wouldn't matter.
six hours per day in the desert without trackers...on a cloudless day... In areas with more cloud cover, shorter days in winter, etc. the numbers drop off dramatically.
Wrong. The average insolation in the US is 6 hours of peak sun per day, no desert required (ie 6000 Wh/sq. meter per day). For a flat panel, the deviation from the best southern nevada site to the worst northern washington state site is only 2-to-1! The rest of the country is suprisingly small devation within this. See rredc.nrel.gov/solar/
Solar cells degrade by 2-5% every year and have a life span of ~30 years
Wrong again. Silicon solar cells degrade less than 10% over 25 years, and are garanteed by the manufacturer to not exceed this over a 20-30 year guarantee - compare that to any other product guarantee! Though, they are guaranteed for 20-30 years, their life isn't limited by it. (see Solarbuzz.com)
Then keep in mind that you have to keep all of those cells clean
Wrong. If you clean them verses do nothing you get a whopping 4% increase. Few people clean PV panels.
And to top it all off, when you cover large tracts of land with solar cells, that land gets less sunlight.
My roof doesn't seem to mind. What land? The average roof has 4-6 times the generating capacity of the average house. 1600 sq ft house = 148 sq meters. 148 m x 150 watts x 6 hours = 133 kWh/day. Average house power consuption 24kWh/day. Beat that with some other form of energy.
after a year with more than average rainfall causes refridgerators to cease functioning and food to rot.
Wrong. When is the last time you noticed the sun failed to come up (yes you still get power in overcast conditions). Further, home PV systems are designed using statistic based on the past 30 years of weather data (see rredc.nrel.gov/solar/). Ask somebody with PV, their power is WAY more reliable than the grid. In fact, most of the comminucation repeaters throughout the western US use PV for this reason.
Now if you come up with a calculation that if you completely covered the sunny state of Arizona with solar cells, it would still not be enough to replace just coal, you're on the right track.
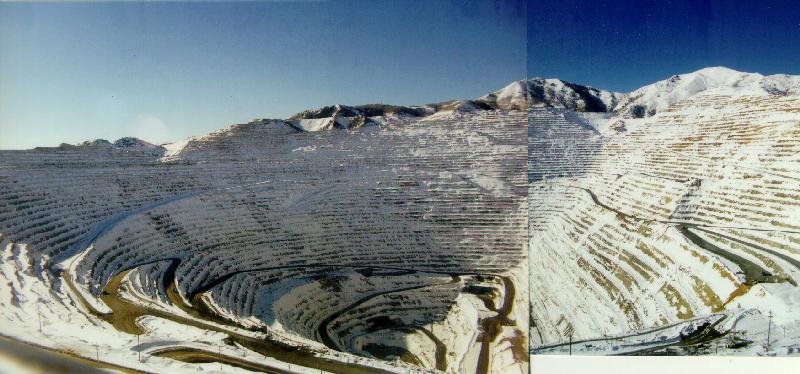
Wrong. Solar is a reasonably dense form of energy wirelessly transmitted through a light "grid" in a usable form almost everywhere on the earth. If you wanted to compare space needed to produce all the electricity consumed in the US it would be a small 100 mile square (see picture for scale www.energycooperation.org/solarh2.htm). In fact studies have shown coal uses as much space due to the space required for strip mining. Try strip mining on top of your roof!
Repeat after me: It doesn't matter how much you are willing to pay. Solar and wind alone cannot do the job.
Wrong. What would it cost to pay for solar electricity? Try the cost of the Irag war. Seriously, do the math (including new military spending) and that would be enough over the next 3-5 years to t
-
Wrong, Wrong, WrongSo much misinformation, so little time.
When you have 8-12% efficient solar panels
8-12% is a little low. Current product cell efficiency are around 14-18%, and Concentrators w/ multijunctions get 30%. But who cares? Your car gets 15% efficiency in average use, nobody complains about that even thought you pay for the gas. Sun is free. The question is does 15% efficiency do the job? Yes. Even if it gets no better, it wouldn't matter.
six hours per day in the desert without trackers...on a cloudless day... In areas with more cloud cover, shorter days in winter, etc. the numbers drop off dramatically.
Wrong. The average insolation in the US is 6 hours of peak sun per day, no desert required (ie 6000 Wh/sq. meter per day). For a flat panel, the deviation from the best southern nevada site to the worst northern washington state site is only 2-to-1! The rest of the country is suprisingly small devation within this. See rredc.nrel.gov/solar/
Solar cells degrade by 2-5% every year and have a life span of ~30 years
Wrong again. Silicon solar cells degrade less than 10% over 25 years, and are garanteed by the manufacturer to not exceed this over a 20-30 year guarantee - compare that to any other product guarantee! Though, they are guaranteed for 20-30 years, their life isn't limited by it. (see Solarbuzz.com)
Then keep in mind that you have to keep all of those cells clean
Wrong. If you clean them verses do nothing you get a whopping 4% increase. Few people clean PV panels.
And to top it all off, when you cover large tracts of land with solar cells, that land gets less sunlight.
My roof doesn't seem to mind. What land? The average roof has 4-6 times the generating capacity of the average house. 1600 sq ft house = 148 sq meters. 148 m x 150 watts x 6 hours = 133 kWh/day. Average house power consuption 24kWh/day. Beat that with some other form of energy.
after a year with more than average rainfall causes refridgerators to cease functioning and food to rot.
Wrong. When is the last time you noticed the sun failed to come up (yes you still get power in overcast conditions). Further, home PV systems are designed using statistic based on the past 30 years of weather data (see rredc.nrel.gov/solar/). Ask somebody with PV, their power is WAY more reliable than the grid. In fact, most of the comminucation repeaters throughout the western US use PV for this reason.
Now if you come up with a calculation that if you completely covered the sunny state of Arizona with solar cells, it would still not be enough to replace just coal, you're on the right track.
Wrong. Solar is a reasonably dense form of energy wirelessly transmitted through a light "grid" in a usable form almost everywhere on the earth. If you wanted to compare space needed to produce all the electricity consumed in the US it would be a small 100 mile square (see picture for scale www.energycooperation.org/solarh2.htm). In fact studies have shown coal uses as much space due to the space required for strip mining. Try strip mining on top of your roof!
Repeat after me: It doesn't matter how much you are willing to pay. Solar and wind alone cannot do the job.
Wrong. What would it cost to pay for solar electricity? Try the cost of the Irag war. Seriously, do the math (including new military spending) and that would be enough over the next 3-5 years to t
-
Re:What about using the most obvious Nuclear Energ
An interesting analysis, and while I agree w/ that nuclear power would be far preferable to coal, (and without discussing further viability issues), I would just like to point out that wind power in the US should not be ruled out offhand. From the abstract of the 1993 Wind Energy Potential in the United States study by D.L. Elliott and M.N. Schwartz (which supercedes the 1991 study cited):
Good wind areas, which cover 6% of the contiguous U.S. land area, have the potential to supply more than one and a half times the current electricity consumption of the United States. Technology under development today will be capable of producing electricity economically from good wind sites in many regions of the country.
So yes, in theory, wind power could meet our power needs (but not w/o being coupled with advanced battery technologies.
Even cost per kWh, Wind does ok. From a March 2004 briefing published by the World Nuclear Association on The Economics of Nuclear Power, shows a present day cost of about 3.7c/kWh. A recent AWEA analysis of the The Economics of Wind Energy [PDF] places the cost/kWh for a 51MW wind farm at between 2.6-4.8c/kWh depending on wind speed. Even if we account for backup power and double the cost, we're not doing too badly either way.
Coal is at about 3.3c/kWh, but when calculating in the external costs "to put plausible financial figures against damage resulting from different forms of electricity production for the entire EU" as done in the decade long EC ExternE studies. Total cost of both nuclear (avg'ing 0.4 euro cents/kWh) and wind (0.1-0.2 ec/kWh) end up beating the snot over coal (4.1-7.3 ec/kWh).
Regardless, I agree with Lovelock. We really need to dump fossil fuels now.
-
They HAVE been investigating electric cars
From this page:
In 1999, The U. S Postal Service contracted with Ford Motor Company for the purchase of 500 Electric Carrier Route Vehicles (ECRVs). The ECRVs were phased into service at 22 Post Office locations --- with 200 in California and two on the East Coast --- between February 2001 and October of 2002.
So yes, USPS may well be be a potential customer of Azure Dynamics. But Azure Dynamics who is somewhat late to that particular game. So far they are providing two test vehicles to the USPS. If Azure Dynamics is to do well, it'll have to be because their cars are damn good, rather than being the first ones on the block.
In fact, US government fleets have been participating in the FreedomCAR & Vehicle Technologies Program during both the Clinton and Bush administrations.
President Bush greatly increased this program's funding and gave it the (kinda bizarre) name "FreedomCAR." But of course this fits into neither the conservative nor the liberal simplistic mythologies of what the Bush administration is 'all about' (i.e. fight-for-freedom vs. exploit-oil), so it's not surprising that practically no one is aware of it. The media these days is about 90% devoted to telling moralistic tales intended to illustrate a point, rather than to convey facts. -
Please learn how to make links.Please learn how to make links.
<a href="http://www.nrel.gov/geothermal/geoelectrici
yields: geothermalt y.html">geothermal</a> -
Piggybackingthe energy payback is typically anywhere from around one to four years depending on the type of solar cell and where it is used.
From your link:Today's PV industry generally recrystallizes any of several types of "off-grade" silicon from the microelectronics industry, and estimates for the energy used to purify and crystallize silicon vary widely. Because of these factors, energy payback calculations are not straightforward. Until the PV industry begins to make its own silicon, which it could do in the near future, calculating payback for crystalline PV requires that we make certain assumptions. To calculate payback, Dutch researcher Alsema reviewed previous energy analyses and did not include the energy that originally went into crystallizing microelectronics scrap.
Therefore the massive investments in mining, silicon manufacturing plants, operation, and cleanup are obfuscated and hidden in these calculations. There really is no such thing as a free lunch.
I am reminded of calculations in a similar vein that demonstrate for every Kg of beef produced we burn approximately 5.5 L of petrol (for USians that's around 3/4 of a gallon for every pound of beef). That makes around 5 barrels of oil per cow consumed as fertiliser, transport costs, materials. We are, literally, eating oil. However we rarely notice such obfuscated inputs because they are so deeply embedded within our industrial infrastructure as to become well-nigh invisible to a casual glance. -
Re:Solar - Energy SinkYour information was true about fifty years ago with the first crystalline solar cells (which are still working by the way!). However, depending on how you estimate it (e.g. whether you include energy cost related to advertising and shipping etc.) the energy payback is typically anywhere from around one to four years depending on the type of solar cell and where it is used. See for example: http://www.nrel.gov/ncpv/pdfs/24596.pdf and http://www.nrel.gov/docs/fy04osti/35489.pdf
From the second PDF: "Energy payback estimates for rooftop PV systems are 4, 3, 2, and 1 years: 4 years for systems using current multicrystalline-silicon PV modules, 3 years for current thin-film modules, 2 years for anticipated multicrystalline modules, and 1 year for anticipated thin-film modules (see Figure 1).With energy paybacks of 1 to 4 years and assumed life expectancies of 30 years, 87% to 97% of the energy that PV systems generate won't be plagued by pollution, greenhouse gases, and depletion of resources.
Future versions of PV may of course payback their embodied energy in even shorter times.
And nothing meant personally by this, but perhaps you might ask why you have been misinformed on such a crucial issue? Perhaps somebody stands to make money by keeping you in the dark?
-
Re:$99 for the cheap fresnel...
There are a few hot water suppliments. AFAIK they connect in line prior to the hot water tank (bringing warm to hot water to the inlet of the tank. The devices I've seen around here appear to be about 10-20 yrs old and are about 6 ft tall and 2 ft wide, but most houses have two. This isn't the worlds greatest link but it gives you an idea of the size required.
-
Re:Better than nothing
CO2 isn't the only pollutant put out by internal combustion engines. In the linked comparison of NOx emissions, the vast difference in Prius vs. Insight emissions is not due to differing gas mileage, but other variables, such as different pollution control systems, combustion efficiency, etc.
-
Re:Global Warming?
"Both House and Senate energy bills contained a first-ever federal fuel cell tax credit supported by IdaTech and over forty fuel cell companies and component suppliers."
Carter's plan was to develop Solar power and "other alternative fuel sources". However, only Solar power was ever funded. -
Re:Solar power is great, PV cells are not
All right! I *knew* someone would trot out the "solar panels take more energy" schtick! This is great; it's practically the only time I get to get modded up to insightful. Ahem.
They just updated this peer-reviewed survey study: (PDF) from the national laboratories. Short version? Worst case payback is 3.75 years from a system that will last 30 years. (A coal or natural gas combined cycle power plant, by the way, has about the same energy payback - they don't spring fully formed from the soil.)
This is not to denigrate the Concentrating Solar Power (CSP) technologies you spoke of; they're promising central station power. Check DOE's CSP page for more info there. But read up before you dismiss photovoltaics out of hand.
-
Re:Not OLED based at all, actually.
Last time you heard, or did you actually look it up for yourself? Because that old chestnut hasn't been true since about the mid-70s. (Think about it; they're silicon-based semiconductors...would you take someone's 1975 estimate of microprocessor efficiency? Check this (PDF) national laboratory meta-study for the most recent data (albeit now somewhat dated and therefore overconservative, given, e.g. Evergreen and Shell Solar's new crystal growth methods, and the thin film processes.) About 3 - 4 years into a solar cell's 25 year+ (warranteed) lifetime, it "pays back" its energy.
2.Conversion efficiency does not take into account manufacturing energy costs; only energy in (fuel) to energy out. The conversion efficiency of a gas turbine would come way down if you included smelting all the steel in its casing, I assure you.
3. Also, just do a back of the envelope calculation. A 100 watt panel will last 25 years in, let's say Maryland, getting solid sunlight for about 19% of all hours (clouds, night, etc.) 100 watts * 24 hours * 365 days * 25 years *
-
Re:seacane
"Growing plants with the intent to use them as fuel is NOT economically viable."
Of course, most of the fuel we used until 1940 was grown as plants. And most of the plants were used as fuel. Remember that humans and other domesticated animals are extremely efficient energy consumers, and much of the physical work in the world is done by animals including humans. In fact, measured by events, (as opposed to joules), the majority of work is fueled by plants, and meat fueled by plants.My tweaks to your scenario, (not your "math", which I referred to sardonically, and apparently too archly
To do the math right, take the 5% efficiency of sugarcane-photosynthesis -> fuelcell-electricity, cut it in half for the hidden layer of sucrose -> ethanol. Multiply the resulting 2.5% efficiency by the actual average annual insolation of places like Dagget, CA: look at the 2-AXIS average year number, 9.4KWh/m2/day, which is about 400W average across the year. That's 10W:m^2 of sugarcane.Sounds like a pittance, but cover the "dead area" of the Gulf of Mexico (1.5M Km^2 *10W:m^2 = 15TW) with a 2/3% coverage of sugarcane rafts, floating patchwork over the lifeless sandy bottom, and you get 10TW. US imported energy of 26P BTU annually is 8.6TW, so a 3x3 array of these farms scattered around the US naval territory makes the US energy-independent. Of course, there are likely exotic aquatic plant species with greater photosynthetic efficiency already growing in that ecosystem which we could cultivate. We can invest the resulting savings (care to include $100G+:year in energy-security military budget?) developing solar space lasers to beam the vast solar energy to floating sea platforms. -
Definitive Energy analysis + Back of Envelope
1. You're exactly right. This national laboratory study is generally considered definitive.
2. Idiot Check:
Bulk unsubsidized price of a 100 watt solar panel:
$350
Lifetime energy production:
100W * 8 hours a day * 300 days per year * 25 years
6,000,000 Wh (6000 kWh)
Retail price of that electricity: $.10 / kWh
$600
Not a lot of profit margin for the manufacturer there is there?
I'll confess that I am beginning to lose my patience with debunking this over and over again; it was true back in the 1950s-60s when solar power was an elaborately hand-assembled product, and before you techie people caused the silicon market to blow up so hugely. (Though these are probably CIGS instead of crystalline silicon.)
-
Interesting Statistic
Every day, we get enough sunlight to power 27 years worth of the world's energy needs. Now, I thought about the implications of that. Obviously, we couldn't absorb/store the entire amount, but if we could put a dent in it, we'd have some global cooling. That is what this article is about.
On a similar note, the US could obtain all energy from the sun if it were to install a 200 mile square solar installation (assuming 15 percent efficiency... easily doable today). I say, put a dime of tax on each gallon of gas and use this money to subsidize solar generation - one of the only energy producers out there with net positive energy (more energy produced in the cell's lifetime than it takes to produce the cell itself). Hydro, wind and solar... I can't wait for the day.
On yet another related note, I'm in the process of building a solar/NiMH PC. I'm simply going to use store-bought NiMH rechargables to store excess daytime solar input. It certainly won't be cost effective but it'll be pretty high on the geek factor. -
Re:A largely discredited idea..fixed link.
Sorry...timed out my preview.
-
Re:A largely discredited idea.
"I read somewhere". Great.
Short answer is ca. 4-5 years' energy payback, out of a 20 year (warranteed) panel lifetime. Probably closer to 3 years with the newer low-energy silicon growth methods.
Think about it. Bulk retail solar module purchase - no tax credits - $275 / 100 watts. 100 watts * 20 years * 365 days * 6 hours / day = 4,380,000 Wh production. Figure $.06 / kWh sweetheart electricity rate for manufacturers, and that's $263 of electricity. You'd have to get your materials and labor essentially for free.
This statistic was actually true ca. I think 1979. Solar panels are a silicon-based semiconductor technology - would you use a 1979 measurement for MHz / dollar in microprocessors?
As for that ethanol study you also "read somewhere," it was by David Pimentel, a systematic entomologist (bug identifier) by training. I've read through it first-hand, (a practice you should try sometime,) and it plays pretty fast and loose with the numbers. As an energy economist, he's an excellent entomologist.
-
Re:Net positive energy?
Yes it has - that statistic dates from ca. 1974, when solar cells were essentially hand-assembled from purpose-grown silicon crystals. The National Renewable Energy Laboratory did a study on this a few years back, estimating ca. 3 years' energy payback from hugely conservative assumptions - Here, in PDF form. However, current efficiencies are slightly better than they were at the time, and silicon production has improved as well...(check shellsolar for their latest.) Silicon being your major material and energy cost here, in most cases...the rest is just frames, glass, and wires. If, as it appears, Uni-Solar/ECD has finally got their production line unscrewed, they'll ahve even better efficiencies,a s they use a thin-film process.
-
Re:One word: bioethanolI don't think I spouted anything sensationalist. I thought we all knew how to use Google here.
I'll start you off with this overview link. Then I'll direct you here to read an energy security justification of the Biofuels research program at the DOE. If you are interested in reading a technical and economic assessment of one such program in this area, I encourage you to read this report from the NREL (big PDF warning) which has lots and lots of numbers to backup a feasibility analysis of large scale bioethanol production. Search around the ott.doe.gov/biofuels page, you'll find tons and tons more research and useful information, and hopefully you won't think this is just "snake oil". -
Re:It makes you wonder who ran the numbers
That's simple; you just never let it get cold.
That's considerably easier to say than do when the average temperature ranges from -2F to -18F (-19C to -28C) in January. It really wouldn't take long to gel the diesel -- you can insulate, but only to a certain point (best bet, obviously, is to stick the tanks in the ground, but we're talking about permafrost here, giving you a base temperature of 0C/32F in any case).
Another thing that occurs to me; if they're on the Yukon river, what stops them from using hydropower?
The river freezes solid up to 5 feet thick during winter. Even if you could solve that issue, you'd have to figure out where to flood up river and build a dam that could feed the turbines off the bottom running water while dealing with the silt issues.
Oh, and Galena, AK does use wind power. Wind power is apparantly reasonably new to Alaska for a variety of reasons. Read this, this, and this (wind power tables for the US) for more info. But it's hardly enough power. It's also telling that while diesel generated power is 2-3x the generation cost in Galena as it is in Anchorage (and vastly higher than it is pretty much anywhere else -- there are no roads that lead to Galena), it's still the most cost effective way of power generation -- wind is displacing it slowly though, but wind power generation has come down in cost and up in efficiency considerably in recent years.
Oh, and to top it all off -- Galena appears to be rather environmentally conscious, even for Alaska. They've banned plastic bags and have other anti-pollution statutes on the books there. -
Zero energy flow = OTEC
It you use Ocean Thermal Energy Conversion (OTEC) you can achieve flow through the microchannels with zero energy input. However, OTEC may be better suited for power generation using turbines as the microchannels would act like a very fine filter and become clogged extremely quickly.