 Slashdot Mirror
Domain: woodfortrees.org
Stories and comments across the archive that link to woodfortrees.org.
Comments · 409
-
Re:Are you sure haven't already reached 1.5C?
You do realize there was a little Ice Age at the end of the 17th C. So you're comparing the trough of a wave with a crest.
The LIA had ended by the second half of the 18thC when the Berkley temperature analysis starts. So there is no trough included in this graph.
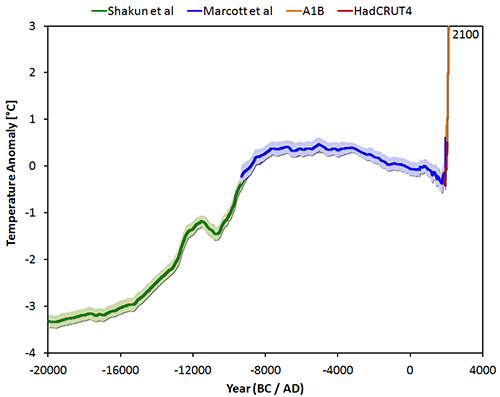
Here's a longer term view if you like. Notice the 6000-8000 year trend back into an ice age that was dramatically reversed during the industrial revolution.
-
Are you sure haven't already reached 1.5C?
It's really not clear that we haven't already warmed more than 1.5C above pre-industiral. Just look at the Berkley record which goes farther back than others and includes confidence intervals. It's possible we're much closer to 2C above pre-industiral.
-
Re:It's Called Science
More conspiracy theories. Funny how Spencer's own temperature reconstruction agrees with the "manipulated" GISS data. Spencer must be part of the conspiracy!
And Dr. Spencer conclusion is pretty definitive - everything starting at zero in 1979 (when the satellite and radiosonde data record begins)
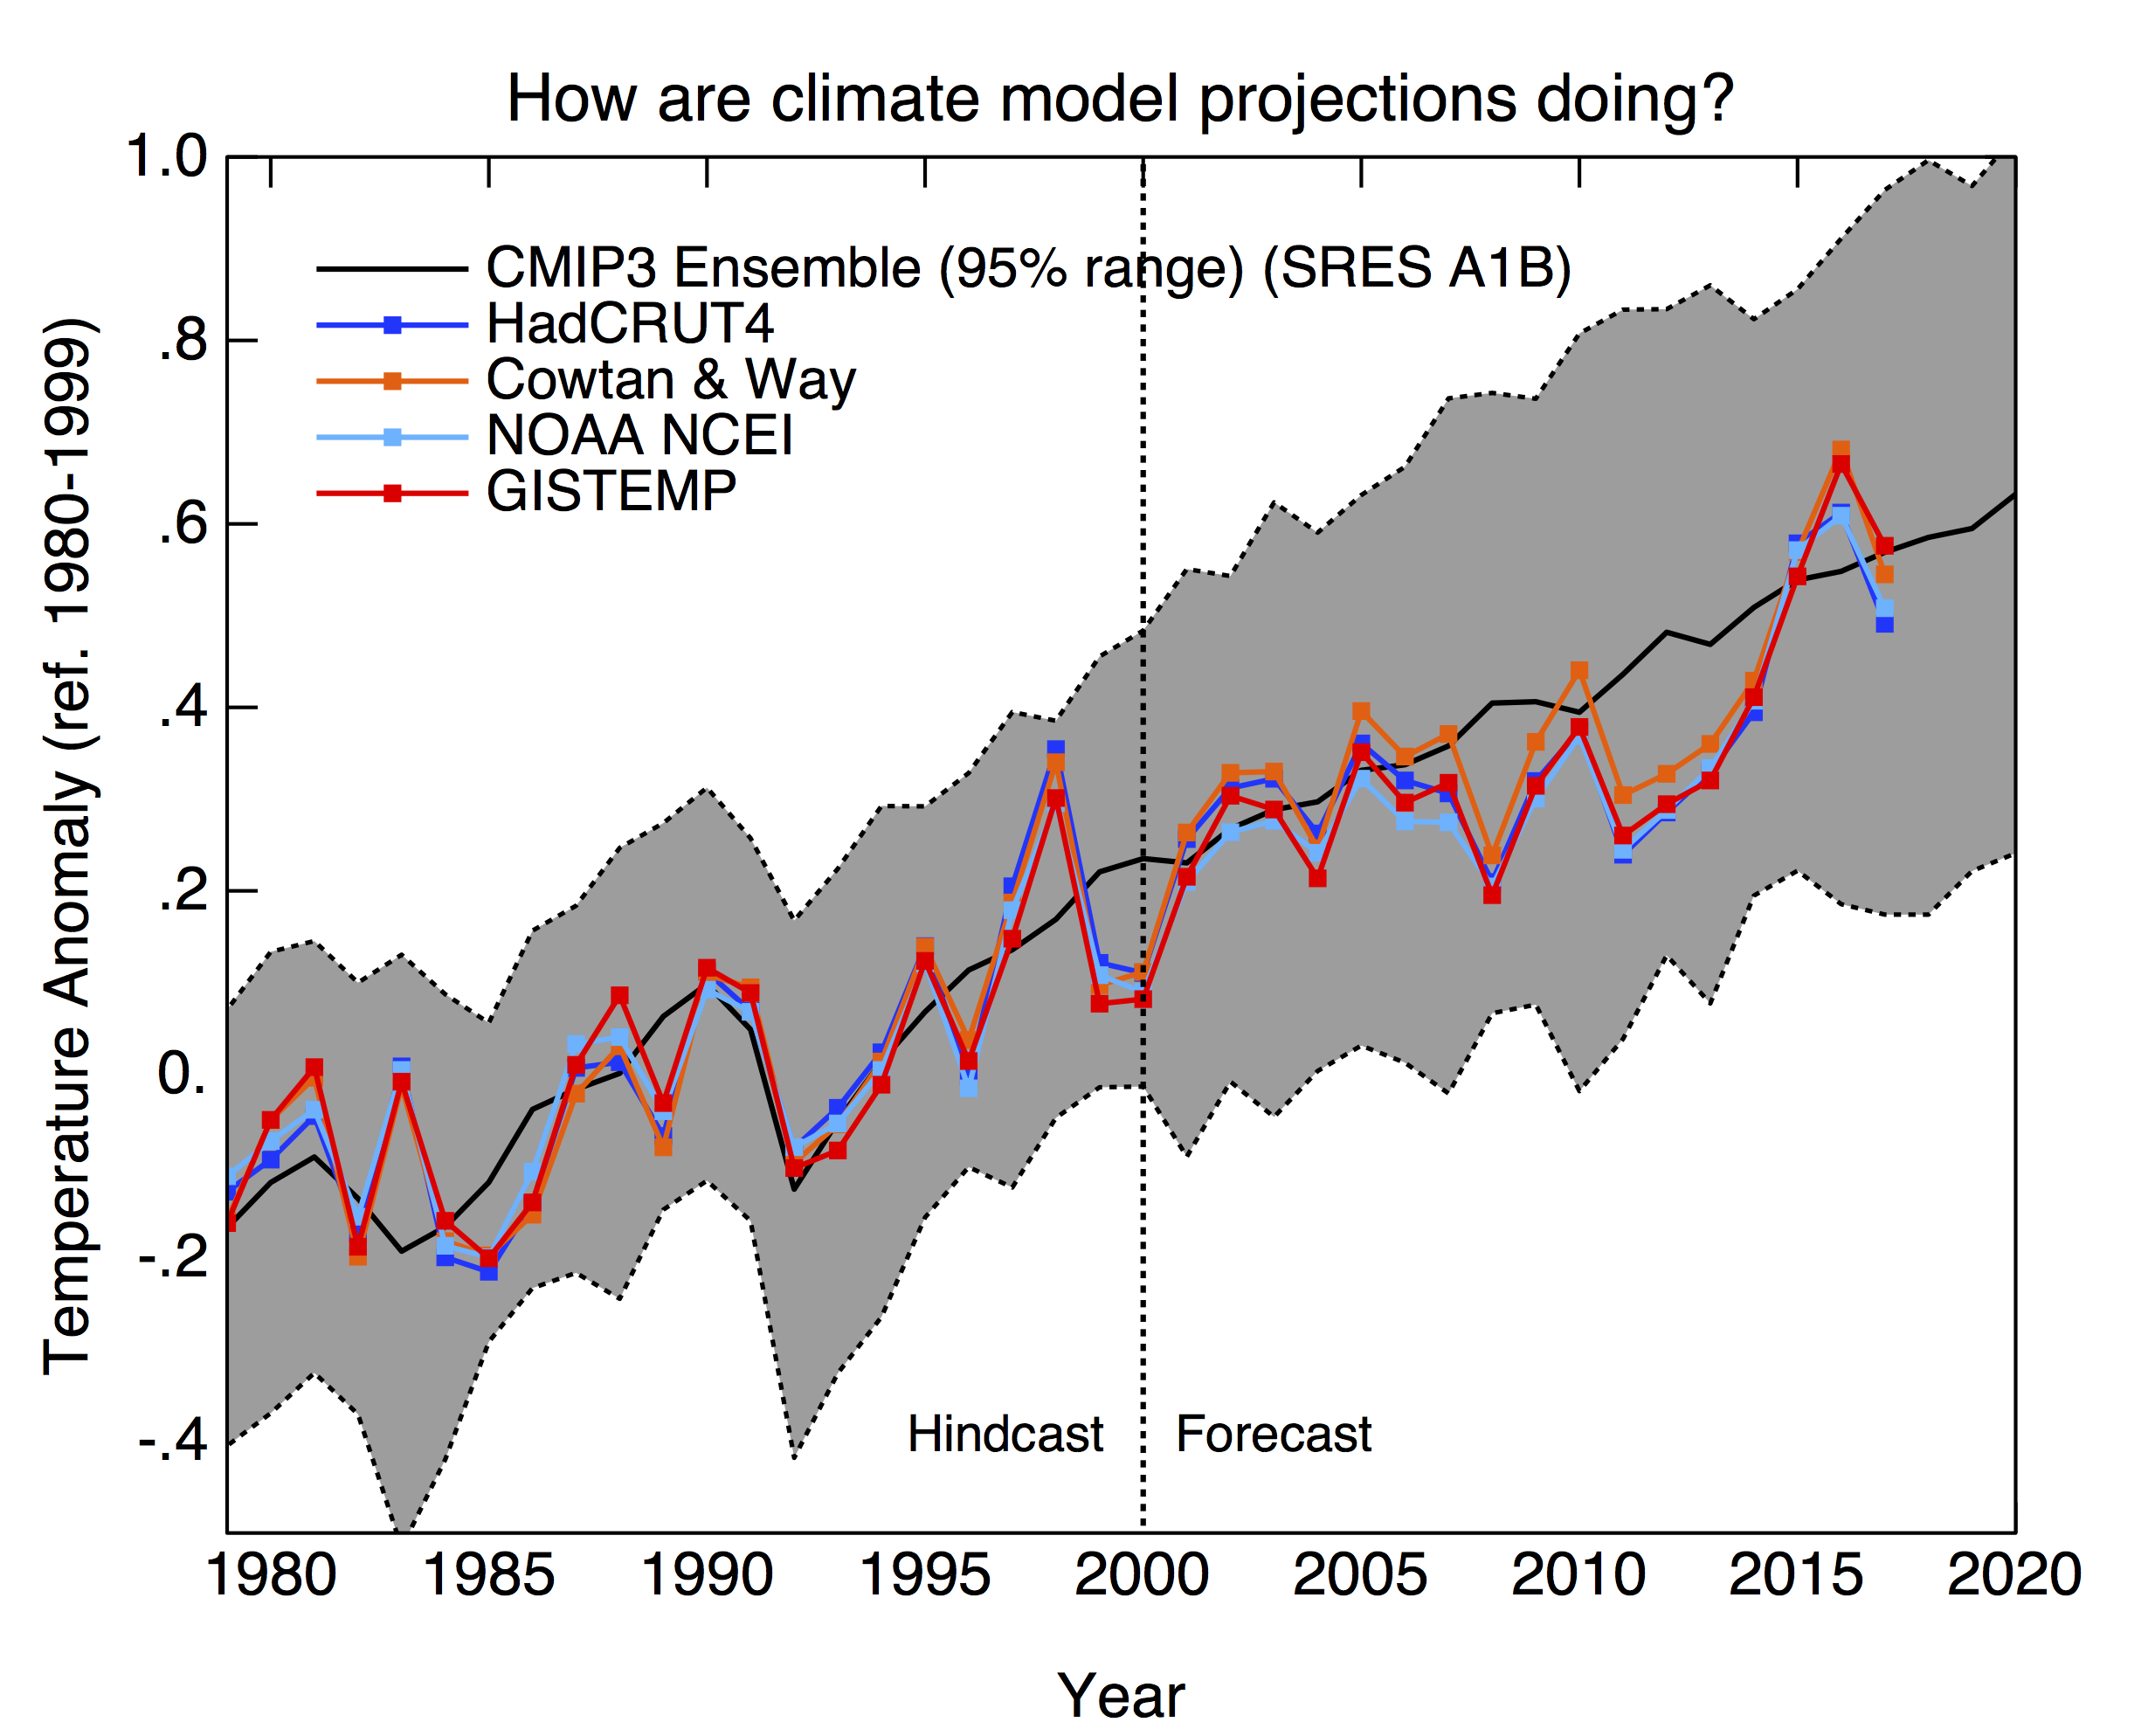
But he didn't start at 1979. He pins everything at 1983. Not 1979. Any guess why? Because if he didn't, it would have looked more like this. Is there any part of you that is the least bit curious? That asks, "if the temp trend since 1983 is exactly as the models projected then how can we conclude that the models failed?"
-
Re:It's Called ScienceModels projected a warming of about 0.2C/decade. (per IPCC). Instrumental record shows between 0.18C/decade(HADCRU) to 0.2C/decade (BEST). Satellite record shows between 0.18C/decade(UAH) and 0.21C/decade (RSS). It's possible for Spencer to use misaligned graphs to fool the credulous, but the trend is exactly in line with projections. You can check for yourself.
So if the data doesn't show...
Everything beyond that line seems to be rendered impotent by the fact that the premise is false (not to mention the conspiracy theory website references XD).
-
Re:It's Called Science
I'll take empirical evidence, thank you.
That's good, but for consilience you need agreement between multiple lines of empirical evidence. For example, you may be satisfied that global temps are warming by looking at one of the instrumental record, but for consilience you need to confirm that all instrumental records agree, as well as satellite records. And in fact they do!
But on top of that you would want to confirm that sea level rise and glacial melt due to that warming is in line with expectations. Then you may also look at poleward migrations and extended growing seasons, etc, etc, etc,
If everything agrees then you have consilience. If there is a minority report, then there is an avenue for further research, but it is unlikely that the minority report will overthrow the consensus.
-
Re:Sun Temp
Lots of places with Earth temp but I see no data on Sun temp yearly. Would be nice to see the two charts side by side. All I see is Earth temp and them saying it went up. Nothing about if maybe they were wrong about the Sun temps going down and maybe that forecast was wrong and the Sun temp went up.
Here's Temp, CO2, sunspot number, and solar irradiance on a single graph. Sunspot number is a proxy for solar irradiance, and lets us peer further into the past. But even direct measurements show that solar irradiance has been dropping while CO2 and temperature rise.
You can see that in 1970 you may have had some reason to believe that temp correlates directly with solar activity, and it undoubtedly does have an impact. Greenhouse gasses have dominated over the last several decades though. To the extent that dwindling solar activity has been driving temperatures down, it has been more than compensated by rising GHG. Hope that helps!
-
Re:Bunch of ego maniacs
It is interesting to see who is willing to pony up some money to back up their rhetoric, and who is merely spewing denial that they do not themselves believe. For instance, look at Joe Basatardi who in 2011 said "the earth will cool
Then there's renowned climate skeptic Richard Lindzen who would "take only 50 to 1 odds on global temperatures in 20 years being lower than they are now.". Meaning he didn't have any real faith in statements that he was otherwise suggesting were unequivocal and certain.
Cudos to the two Russian scientists for putting their money where their mouth is. We can suppose they at least believed in what they were saying. I'm less impressed that they didn't actually pay up, but maybe they are in dire financial straits. Who knows.
-
Re:i mean, is this trustworthy?
the closest thing to reportage here is links to a blog and also a graph of some sort i honestly don't have time to bother figuring out.
The graph is showing that every available temperature data set, whether it be it from USA or UK, land or satellite, and even those by skeptics - all show the same thing. Temperature is warming by about 0.2C/decade. The later period is warmer than the former. The climate modeler had greater insights into the mechanisms that affect global mean temperature than the solar physicists. The winner is clear.
For more authoritative reportage, you can read this nature article from when the bet was made, this New Scientist's article on Five scientific theories decided by wager, or this Russian article on why the losers welched, even though they lost.
-
Re:This is complete bullshit
Windpower does not add heat to the atmosphere of Earth, it just mixes around where it's hot and where it's cold. Greenhouse gases add heat energy (and thus average temperature) to the Earth's global atmosphere. These are completely different things.
Add to that the fact that CO2 is warming the globe by about 0.2C/decade. That dwarfs the localized warming after only a few decades. - even if we converted all US energy production to wind.
-
Solar output down, global mean temperature up
Solar output has been declining since 1950 yet the globe as a whole has been warming considerably.
To illustrate, here's a plot of sun spots vs temps vs atmospheric CO2: http://woodfortrees.org/plot/b...
-
IPCC projections
In 2007 IPCC FAR projected 0.2C/decade over the next two decades. So far we've seen 0.3C/decade since 2007, but it's early yet.
-
Re:Nice Scaremongering
The write-up claims, the 3.5 degrees is the current projections by some unspecified researchers. There no "ifs" about that write-up's claims — SuperKendall is correct, while your narrative falls apart.
SuperKendall's own reference shows scenario A2 which projects ~3.5C by the end of the century. See table SPM.3: A2 scenario best estimate = 3.4, likely range = 2.0 – 5.4. The A1FI scenario has a best estimate of 4C by end of century.
How much we warm depends on how much we emit. Warming will not stop at the end of the century unless emissions cease, so it is only a matter of time before we reach 3.5C. We've warmed about 1.2C since the 1850s. Two thirds of that has happened in the last 50 years. At the current rate of warming since the 1980s - even assuming no further accelleration - we will hit 2.5C by the end of the century. Again, where we end up will depend on how much CO2 we emit.
-
Re:Ouargla, Algeria
What if the objective was to create hype about record temperatures in order to advance a political agenda? Then where would we locate our instruments?
In that case use the satellite record which shows a warming trend greater than the surface station record.
-
Re: Climate change tracking projections
The problem is that the data doesn't match the models
IPCC projected warming of about 0.2C/decade. The trend on the satellite record is 0.19C/decade. Pretty damn good.
Look at HadCRUT4 from 1895 to 1943, and then again from 1957 to 2005.
The trend from 1895-1943 was somewhere between 0.045 C/decade and 0.109 C/decade (2).
The trend since 1957 was somewhere between 0.112 C/decade and 0.154 C/decade.
They're not really close - there's not even overlap in the uncertainty - and possibly the current trend is over three times greater than that of the early 1900s.
Nonetheless, if you want to understand this period you shoudl read the literature rather than conspiracy blogs: "Attribution studies estimate that about a half (40–54%; p >.8) of the global warming from 1901 to 1950 was forced by a combination of increasing greenhouse gases and natural forcing, offset to some extent by aerosols. Natural variability also made a large contribution..."
-
Re: Climate change
According to satellite data...
-geekpoet
Satellite data is consistent with land measurements
Trend for the NASA GISTEMP surface station record: 0.1732 per decade.
Trend for RSS remote sensing satellite record: 0.1948 per decade
Satellite shows a higher rate of warming, but roughly consistent with surface station record.
-
Re:Move along nothing to see here...
The decline was until the mid 1970s, it didn't stop in the 1940s.
I suppose all those dead people magically sprang back to life, and all the shattered industry magically repaired itself at the end of the war too? And that's just one factor that you blithely ignored because it was inconvenient.
Additionally, there was that massive heating (worldwide, might I add) that happened in the 1930s.
What massive heating in the 1930s?
And the pause is "eliminated" by inclusion of bad satellite data, which the folks who run the satellite system itself (Dr. Roy Spencer and others) say you shouldn't do. Drop the bad data, and we have a pause - even as CO2 continued to increase.
That post is about an article "Sensitivity of satellite derived tropospheric temperature trends to the diurnal cycle adjustment" which most people would realize is about the troposphere warm spot, and not about the actual temperature record. Do you bother to read or understand things before you link to them or is this just you desperately grasping at any straw to reaffirm you preconceived notions?
Maybe you should do some actual research and come up with something actually coherent before you start playing this mind-numbingly stupid game of whataboutisms? Cherry-picking random facts and claiming they disprove something because you don't understand, is just illustrating that you don't understand.
-
Re:Climate Bet
If you make a condition of the bet to not allow NOAA to modify the data, I'll take the bet any time.
If you allow NOAA to make adjustments, its not gambling, its just handing over money because you know the outcome.All current increases in temperature match NOAA adjustments 100%. Warmest year without adjustments is 1936.
So here's the thing, and please keep in mind I'm a human-induced climate-change skeptic: NOAA absolutely need to adjust the data, otherwise it will always show a warming trend.
The Urban Heat Island effect is well known. As urban areas expand and the amount of concrete (and other structured) increase, nearby weather stations become contaminated with these changes. To counter this, the readings are modified by a series of "known good" stations that are (relatively) nearby. The effectiveness of that particular process is disputed by AGW skeptics; but the need for it is well-established.
I don't know where you get 1936 from; the unadjusted global mean clearly shows 1998 was the warmest year ever.
-
Re:The world is not a static system
You cannot magically decouple coupled systems.
Since you can't predict the variability of the sun ahead of time what do you think they can do to include it?
When he says this is a coupled system, he is presuming not only that solar variability affects the Earth's climate, but that the Earth's climate affects solar variability. There is no reason to expect that this is the case (frankly it seems implausible).
Solar output has dropped since the 1950's. To the extent that it has had an impact on global temperatures, it has been a cooling one. Greenhouse gasses will not only have been responsible for observed warming, but will also have compensated for the cooling effect of the waning sun.
-
Re:In this house we obey the laws of thermodynamic
Dyson is absolutely right. Solar output has an impact on global temperatures. That's not controversial. What you are failing to grasp is this: To the extent that solar output affects global temperatures, it has had a negative (cooling) impact over the last several decades. Solar output has been dropping
If you argue that solar variability has a very large impact on global temperatures, then we need to conclude that the warming caused by increased CO2 is much larger than we expect. CO2 has not only caused the observed warming, but also compensated for the cooling effect of the waning sun.
-
Re:The world is not a static system
Graph of solar variation on top of global temperature.
http://www.woodfortrees.org/pl...
Doesn't seem to be much correlation.
-
Re:The world is not a static system
Solar output has been falling over the last several decades. There is no coloration between solar output and rise in greenhouse gasses. Dwindling solar output has been driving global temperatures down. That means something else is responsible not only for driving temperatures up, but also for compensating for the drop in solar output.
You're not familiar with nonlinear, coupled systems, are you? Mark Shepard on Restoration Agriculture - Observation vs Concept @RestorationAgD http://bit.ly/1lM3PFS
-
Re:The world is not a static system
Probably should not believe and predictive models of climate that doesn't also have an accurate, predictive model of the Sun. Coupled systems cannot be magically decoupled.
This is a very good point. Climate models are really nothing more than projections that assume "all else being equal". That's something that folks generally don't appreciate when comparing actual temperature rise to model projections.
The fact of the matter is that solar output has not been static. It's been falling for the last several decades. That's been driving global temperatures lower than they would otherwise be. It won't stay down forever though, so we should realize that warming in the next several decades. At which point global temperatures rise will further accelerate.
-
Re:The world is not a static system
So your theory is that changes in the Sun's output are causing the recent rise in temperature?
1) Is rise in greenhouse gases the cause or effect?
Solar output has been falling over the last several decades. There is no coloration between solar output and rise in greenhouse gasses. Dwindling solar output has been driving global temperatures down. That means something else is responsible not only for driving temperatures up, but also for compensating for the drop in solar output.
-
Re:Read Karl Popper
On what basis do you think the various carbon sinks are acting in an inconsistent way? I've never seen any evidence of that. The documented increase of carbon in the various carbon sinks matches well with the human contribution of carbon to the cycle.
Exactly what you said - increases of carbon sinks match human contributions.
The trick is, human contributions are dynamic - they change unpredictably all the time. It's surprising to see carbon *sinks* track that essentially in real time.
If a carbon sink always took 100gt/year, that would be consistent. I wouldn't expect the next year to be 200gt/year.
Or, if a carbon sink took 100gt/year, then the next year took in 110gt/year, then the next year took in 120gt/year, and so forth, that would at least seem consistent, driven by some other factor.
When a carbon sink takes in 100gt/year if humans emit 100gt that year, but then take in 200gt/year when humans emit 200gt that year, and then go back down to 150gt/year when humans emit 150gt that year - well that's just plain freaky. It's almost as if you have a system that doesn't care how much you put in, it will react to it precisely.
Even more puzzling is that CO2 continues on a gentle, consistent rise, despite human variation in emissions. If humans really drove it, you would think you would see plateaus during recessions when our CO2 emissions level off, and an acceleration during massive expansions of industry. But we don't:
http://woodfortrees.org/plot/e...
http://www.freerepublic.com/fo...
Now, note, I'm not arguing humans have zero effect here - but all evidence makes it look like any effect we have is negligible - maybe 1-4% tops.
-
Re:Science
Reversing through a data set, finding a trend then noting the point that trend changes is not cherry picking. Saying that you can't include 1998 absolutely is cherry picking.
Going completely clear of 1998, from 2000 to 2014 was also a flat line and there are no outliers in there.
-
Re: Trouble is, AGW's not real.
You could just look at the temperature trend for the last 50 years. That doesn't require faith in models, groupthink, nor appeal to authority. http://www.woodfortrees.org/pl...
-
Re:LOL more fake news from the NY Times
The Sun's activity is actually down, while temperatures have soared.
http://www.woodfortrees.org/pl...
It's Trump's hot air. He has a YUGE impact!
-
Re:LOL more fake news from the NY Times
The Sun's activity is actually down, while temperatures have soared.
-
The trend continues.The trend from 1970 -> 2000 is indistinguishable from the trend since 2000: http://woodfortrees.org/plot/g...
What leveling off?
-
Re:instrumentally homogeneous temperature records
There was also the warming event roughly 130 years ago following the cooling event of Krakatoa, but honestly nothing like this sustained increase over time over the intervening mean.
Looks like I misread. You're talking about warming following the cooling event of Krakatoa (1883). So I think you must be talking about 1910-1040? Yes that looks comparable, but it's not a separate event - it is really just the early part of the modern warming trend plus natural variability . http://woodfortrees.org/plot/h...
-
Re:instrumentally homogeneous temperature records
There was also the warming event roughly 130 years ago following the cooling event of Krakatoa, but honestly nothing like this sustained increase over time over the intervening mean.
Krakatoa erupted in 1883. The 30 year trend leading up to that event is only 0.04/decade compared with 0.17/decade now: http://woodfortrees.org/plot/h...
Not comparable.
-
Re: we saw that the science was falsified by the C
The first IPCC report did not downplay anything...
It looks like the projections from the first IPCC report were pretty darn good. Of course, this was published in 2013. A lot has happened since then that may make the projections look a little on the low side.
-
Re:We are now in La Nina conditions
This is what RSS sees:
http://www.woodfortrees.org/pl...This is what UAH sees:
http://www.woodfortrees.org/pl...You are correct that El Nino timing is variable, but my point that around 4 years is the expectation value still stands. Yes, El Nino is not always followed by the precipitous drop of a La Nina, but this yeah the temperature drop in the last few months has been by a whopping 1 K. This is the fastest recorded drop in history. yet for some reason the media don't want to report this ? This is not the biggest drop over time, but it is the most rapid drop. At the current rate it looks like a La Nina is developing, although it will be a few more months before we know for definite, but all indications are currently that one is forming.
Underlying these is the trend we have seen for 150 years, since the end of the Little Ice Age which we know is due to the effect of solar magnetic variability, and probably linked to terrestrial climate through the change in water vapor/cloudiness (via an interaction between the heliosphere and cosmic rays).
As far as snow in the Sahara and more ice than normal on Greenland you are confusing weather and year to year variability with climate.
I mention this specifically because of claims that 'snow is a thing of the past' and 'Greenland is melting we are doomed' memes that are counter-factual. There is huge variability in the weather but when it is hot (such as the super El Nino of 2016) the propagandists go into overdrive with the 'hottest yeah evah' memes and claim this is 'proof' of ANTHROPOGENIC effects dominating natural ones. But we it is cold they say, 'meh, weather'. That is why I mention it, because the Confirmation Bias is strong in all of us, but alarmists abnormally so.
-
Re:No, they didn't tell you that.
What argument? I just provided data. The greenhouse theory is basic physics understood even back in the 1800s: http://www.rsc.org/images/Arrh....
That the world is warming is confirmed by direct measurement, and satellite measurement. We can directly observer the impacts of that warming on the cryosphere, and sea level. We don't need to use pan evaporation rate as a proxy for global temperatures when we have direct measurements. This is especially true since PER makes a very poor thermometer - it's affected by a number of factors other than temperature including humidity, rain fall, drought dispersion, solar radiation, and wind. A change in any of these other factors would render it useless as a thermometer.
-
Re:No warming since 2016!
Apparently you haven't noticed it because of the width of your plot, but there has been a very precipitous 1K drop in the temperatures anomalies over land and slightly less dramatic over the oceans in the temperatures form September to November; even the arctic temperature spike might be reducing.
-
No warming since 2016!
The last time the global monthly average was this cool was 2014, which at the time was the hottest year on record. See this link in case a longer term perspective is of interest. Note that the cheerleader now has her panties higher than she has for over 97% of her life, and she's been around since 1850. Assuming she's had her panties in the normal place for most of her life she's probably looking for a doctor to perform a surgical extraction.
-
Re:Global Warming seems lesser since Trump
For perspective, here's how 1979 compares to the last 10,000 years. 1979 was at the time already a record hot year.
-
Land and Satellite show similar warming
Land and sat are pretty similar: http://woodfortrees.org/plot/g...
-
Re:Global Warming seems lesser since Trump
Look, weather is climate now. 1 month is proof of climate change.
Fortunately we have more than one month of data. Check the green line for the climate change signal: http://woodfortrees.org/plot/g...
-
Re:Global Warming seems lesser since Trump
Plus or minus 5 degrees
That would have us swinging in and out of an ice age.
What's the "ideal", "average"
The ideal temperature is approximately what it's been since the dawn of civilization. Only for the reason that we built this civilization, (the farms, the coastal properties, the dykes, the infrastructure, etc), with that climate in mind. Transport all that to a different climate and it no longer fits. It's expensive to have to redo it all.
and how you calculate and control it?
Best way to calculate it: http://pubs.giss.nasa.gov/docs... (IMHO, YMMV, but all methods produce roughly the same results.
Best way to control it: https://www.theguardian.com/en...