 Slashdot Mirror
Domain: nasa.gov
Stories and comments across the archive that link to nasa.gov.
Comments · 16,365
-
Re:Going to the moon, with what money??
If you just keep NASA's budget constant there is $8B a year for human space flight. The savings are from ending shuttle and finishing building the ISS.
So what to do with that money?
http://www.nasa.gov/pdf/516674main_FY12Budget_Estimates_Overview.pdf
-
Just USA seen from space. Not whole Earth.
I much prefer this one about Apollo-1 crew:
http://www.nasa.gov/multimedia/imagegallery/image_feature_2160.html
Very nice shot. Reminds also how difficult and dangerous was the space race.
-
Re:It's been done
I'd be more impressed if someone found a way to NOT get into space with a helium filled weather balloon.
Maintaining a constant altitude, and thus preventing the balloon bursting, would be very cool.
Happens all the time. NASA, USAF, and any number of universities and commercial entities launch zero pressure balloon all the time that use vent mechanisms and pourable ballast to maintain constant float altitude at 90k - 140k feet.
-
Facts
-
Re:ISS
If you're in space, you also get to enjoy flashes of light even with your eyes closed because of radiation interacting with your eye. I wonder if they stayed outside their protective room, if they would see a disco ball of light from the solar onslaught.
http://science.nasa.gov/science-news/science-at-nasa/2004/22oct_cataracts/
-
Re:How "An Inconvenient Truth" can it get
Might be a good deal faster than that, but it will be decades before we know.
See http://www.giss.nasa.gov/research/briefs/hansen_15/
Or http://www.columbia.edu/~jeh1/mailings/2011/20110118_MilankovicPaper.pdf (skip to "summary discussion", 7c: "Paleoclimate records include cases in which sea level rose several meters per century, even though known natural positive forcings are much smaller than the human-made forcing. This implies that ice sheet disintegration can be a highly nonlinear process.")
Hansen proposes to fit an exponential curve with 10-year doubling, but initially you can't tell the difference between exponential and quadratic, and the possible mechanisms for rapid sea level rise and not entirely known (as in, can glaciers really move that fast?). He bases his argument on "best data from the paleoclimate says several meters per century happened in the past, and temperatures not far from where we are now".
The paper in which the fast paleoclimate sea level rise is studied: http://www.planetwork.net/climate/Hansen2007.pdf
One question I don't see an answer to (yet) is whether the fastest rise occurred earlier in the glacial melt -- i.e., when ice sheets all over the northern hemisphere were melting, not just Greenland. But (apparently) Antarctica has plenty of potential. -
Re:They rank these storms
I think you missed the key point -- there's no fixed scale for CME, so why would you write an article on the lack of something?
CMEs and flares are *not* the same thing -- the CME is an ejection of plasma from the sun, while a flare is energy only. You also have what are called 'SEP events' (Solar Energetic Particles), where they're measuring highly energetic particles in situ (in place vs. remote sensing like from telesopes)
If you want more info, try asking at The Sun Today, which is run by an actual solar physicist. (disclaimer: it's one of my co-workers)
ps. the maximum flare class mistake has even been made by the people doing EPO (education & public outreach) for SDO
-
Re:They rank these storms
'ranking system for CME/EMP effects'
Wow. Well, what you're talking about is the 'Flare Class' which only classifies the amount of x-ray energy given off by a flare. It's a log scale, so M is 10x as large as a C, and X is 10x as large as an M. Of course, there's no cap on it, and there have been X20 flares recorded. Of course, the sensors saturate, and as we're only really dealing with one significant figure and a magnitude, I don't know how much precision they have at those higher values.
To make things even more fun, there's also a flare 'importance' value, which is based on the energy and size of the flaring region in the optical (visible) spectrum.
But neither of these classifications have to do with CMEs, and particularly not their affects at earth. For that, you'd need to look at the solar wind folks, who are obsessed with things like 'Bz' (z-component of the magnetic field', ie, how is it oriented relative to the earth's magnetic field?) and radio bursts.
The closest thing that I can think of to what you describe would be a catalog of ICMEs (Interplanetary CMEs), but even those, if you look at the catalog, are just raw numbers, no sort of ranking to it. (the column with 'A' and 'B' in it are which of the two STEREO spacecraft saw the event, 'Ahead' or 'Behind')
Disclaimer : I'm not a solar physicist, but I work in a solar data archive, and have done work trying to normalize solar event catalogs.
-
Re:How "An Inconvenient Truth" can it get
Three tenths of a meter? Your sources suck. Now, first, the likelihood of all polar ice melting is very low and would take 1000 years. But if it did happen? Greenland ALONE would add nearly 7 meters to the sea level. And ALL OF ANTARTICA!?!?! That would be SEVENTY meters. Finding this doc took all of 2 minutes - https://pumas.gsfc.nasa.gov/files/02_10_97_1.pdf Your Google-Fu sucks balls - get off the Internet.
-
Re:Looking at the problem backwards.
Actually this is a more immediate problem then you might think. I agree that we need start worrying about other problems (climate change, epidemic, ourselves) but there is still a definite risk of NEO's hitting Earth. NASA knows of plenty of risks and has them laid out in a chart here http://neo.jpl.nasa.gov/risk/. If my memory serves me right (this is based on information my roommate told me who worked for NASA at the time) there is an object that will pass by Earth late 2012 and when it does scientist will be able to get a very good picture of when they think it will hit Earth (I think the range of potential hit fates starts in 2020 and continues on from there but the likelihood is very very small any given year but still present). So yeah, a nice off world site would be nice but we really don't have the time/technology to do it right now (or potentially ever).
-
Re:The open question...
The fact that temperatures have remained more or less static since 1998 whilst CO2 has increased linearly would give any normal person pause for thought.
Yes, here's the graph of the data you're referring to:
data.giss.nasa.gov/gistemp/graphs_v3The fact that this doesn't make you think there's something wrong with the thesis is kind-of fascinating to me.
And the fact that you can cut a tiny piece out of the end of a long data set and say that it's "static", if you ignore all the rest of the data, is kind of fascinating to me.
Unless by "static" you mean "noise."
-
Re:There is no denying the Earth is getting hotter
Can somebody explain why error estimates did not change since 1880 on Figure 2?
http://data.giss.nasa.gov/gistemp/2011/
Please see an opthamologist.
-
Re:There is no denying the Earth is getting hotter
Can somebody explain why error estimates did not change since 1880 on Figure 2?
-
Re:Making leaps
If credibility were a credit score, then Roy Spencer wouldn't be able to get a loan to buy a tooth brush.
Just go to the GISS site to see the temperature record: http://data.giss.nasa.gov/gistemp/
-
Re:No Warming Between 1998 and 2008
A) He is an astronomer. Don't take his flip comment as if he is an expert.
The experts have consensus AGW is real.The trend is longer the 10 years.
http://www.nasa.gov/topics/earth/features/upsDownsGlobalWarming.html
http://www.nasa.gov/images/content/388674main_portal2Huge.jpgTo answer you question:
There are normal cycles. I know a lot of ignorant people like to spout off their mouth and say climatologist don't account for normal cycles, but they do.
While it is trending upward, there will be years that are flatter then others.
Notice, it was still hotter then normal cycle would predicts. It's not like the temperature return no normal cycle temperatures.yes, one 10 year blip is not a trend. No expert claims that. They may use a decade to illustrate a point.
Again he isn't a troll, he is just a non expert making a flip remark.
Saying there was no warming in that 10 year period isn't really correct. 1998 was warm, then the the years to 05 area\n't as warm, stil part of the overall trend. 06Here is the temperature from 98 - 10
Year Global Land Ocean
1998 - 0.5984 0.8320 0.5090
1999 - 0.4210 0.6759 0.3240
2000 - 0.3899 0.5174 0.3409
2001 - 0.5188 0.7207 0.4419
2002 - 0.5762 0.8318 0.4798
2003 - 0.5832 0.7735 0.5108
2004 - 0.5441 0.7115 0.4819
2005 - 0.6183 0.9593 0.4896
2006 - 0.5623 0.8158 0.4669
2007 - 0.5509 0.9852 0.3900
2008 - 0.4842 0.7801 0.3745
2009 - 0.5591 0.7595 0.4848
2010 - 0.6171 0.9642 0.4885People who claim there 10 year cooling are really just grabbing two peaks and saying because there is a small valley between them that it isn't warming, or that it stopped.
Its kinds of like 'God of the gaps' logical fallacy. -
Re:Another sequel to the 1958 hit
Would this help you take it more seriously?
(really, nothing to worry about anyway. it will just fuck up radio propagation and such)
-
Interesting but...
For $300 bucks YOU can go into near space.
A near space stack consists of a helium balloon, recovery parachute, and nearcraft, and can reach fifty feet (~17m) in length. Such a stack can fly to over 100,000ft (~33km) in altitude yet costs only a few hundred dollars. The balloon expands as the stack rises and will eventually burst. The payload then parachutes to earth and is tracked with GPS data sent via telemetry on amateur radio .
If you like that idea, check out what the pros think about launching satellites from balloons.
-
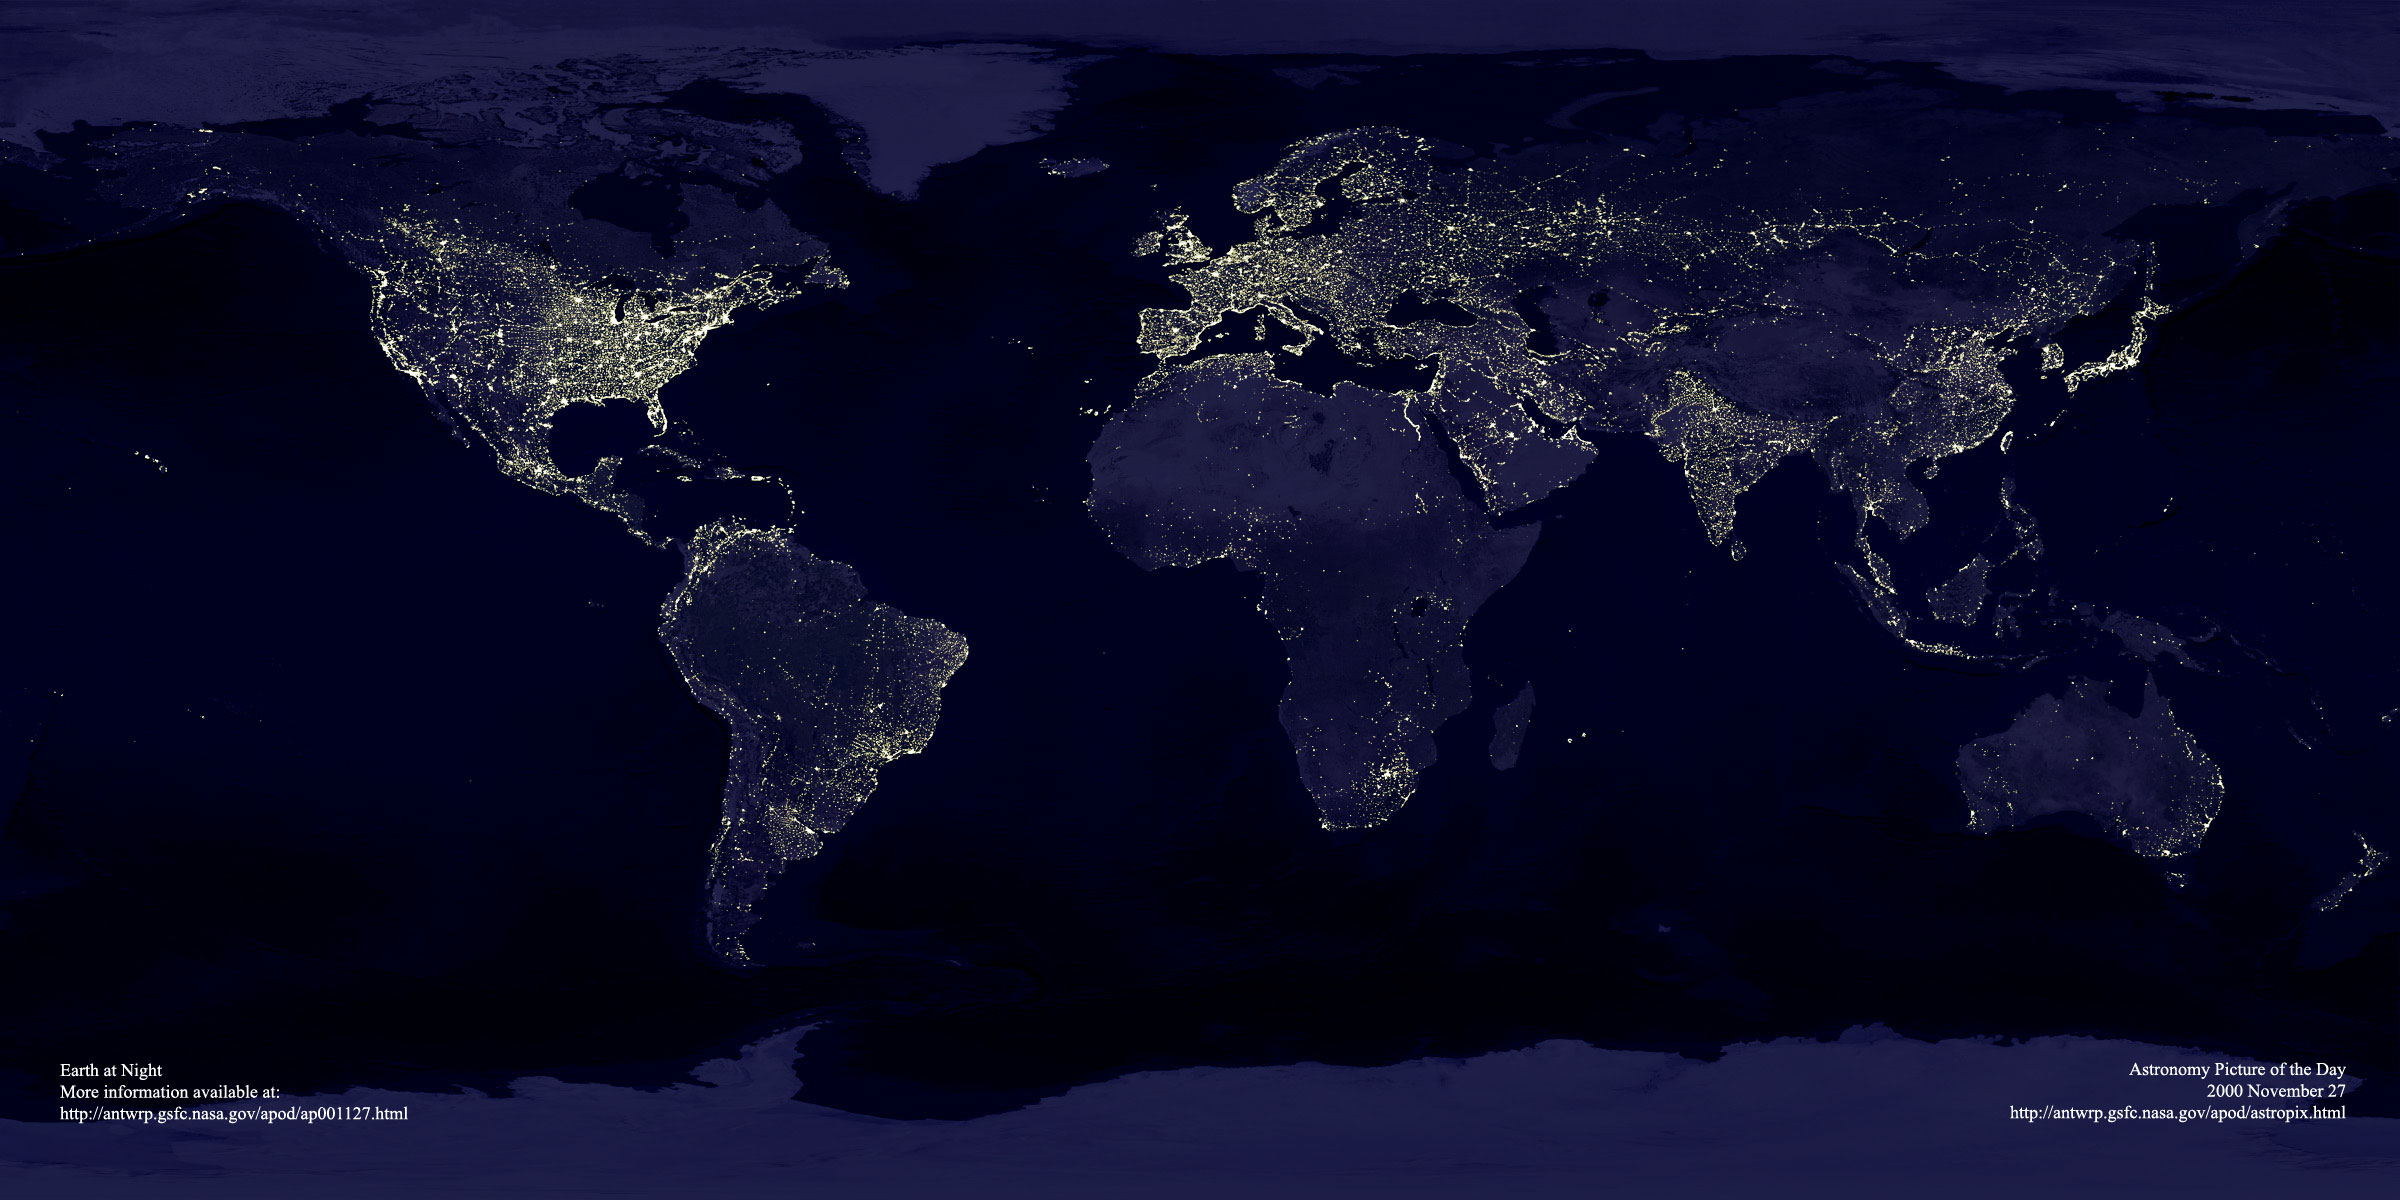
Re:Earth lights
Best! Poster! Ever!
The low-light images from ISS are quite interesting when flying over populated areas, too.
http://eol.jsc.nasa.gov/Videos/CrewEarthObservationsVideos/ -
Earth lights
Earth, by night: http://apod.nasa.gov/apod/image/0011/earthlights2_dmsp_big.jpg
-
that's jacques debris to you
excruciating details: http://www.orbitaldebris.jsc.nasa.gov/newsletter/pdfs/ODQNv16i1.pdf
-
Re:Isn't that anti-science?
So neither the IPCC, nor NOAA, nor the Royal Meteorological society have made any clearly falsifiable hypothesis statement about Catastrophic Anthropogenic Global Warming. Perhaps you have some other unnamed, unknown climate scientist out there who actually *has* bothered to specify an observation of say, global average temperature and CO2 levels (past, present or future) that would falsify the hypothesis of "humanity is changing CO2 levels in ways that will cause increases in average global temperature that will cause some specified amount of harm by 2100"?
If you cannot even *imagine*, as a "non-scientist", an observation that would shake your faith in your particular, belief, you're doing religion, not science.
I refer you to the "skeptic"'s two most popular, though self-contradictory axioms;
1) climate models can say whatever you want them to say
2) climate models fail in predicting current/past climate.
Of course, given the preceding pair of hysterical claims, the prediction would be that climate models have actually done a decent job of predicting not just global average temperature, but many of the details, and that's true.
The IPCC Report way back in 2001 demonstrated that models without an anthropogenic term are sufficient to describe climate prior to the Industrial Age, but over the past century or so the models predictions deviate more and more from observed data, unless an anthropogenic term describing our actual output of CO2 is included. http://www.grida.no/publications/other/ipcc_tar/?src=/climate/ipcc_tar/wg1/figspm-4.htm
Even Hansen's much-maligned-by-"skeptics" 1988 model actually does a decent job, when you take into account that the slight overprediction of scenario B corresponds to the fact that that scenario relates to somewhat higher CO2 output than actually occurred in the intervening years. But when the model/observed data was given a perturbation, with the Mt. Pinatubo eruption of 1991, it accurately predicted the size and time course of the effect. Radiative, water vapor, and dynamical feedback effects all were accurately predicted. http://pubs.giss.nasa.gov/docs/2007/2007_Hansen_etal_3.pdf The model predicts so many things, from the fact that the degree of warming is higher at the poles than the equator, at night than in the day, and in the winter than in the summer, and that the warming of the atmosphere near the earth's surface is accompanied by a cooling in the upper atmosphere. All these things are predicted by a model of impeded radiation from the earth, and all these things are completely opposite to what you would see when the cause is an increase in incoming energy, as with a warming sun.And those models are the Model Ts of climate study; the current generation of models are more precise, more accurate, and do not change the general picture predicted for the last 20 years, merely refine and validate it.
But since you asked, given that the "skeptics" have no model, no predictions, nothing, why would anyone be convinced by them? They constitute nothing more than "It might be from something different, although I don't know what", which can never be refuted, of course. The null hypothesis for everything is not "No effect". You would not assume that shooting yourself in the head, for instance, would have no effect. Why? Because you have a plausible mechanism. Just as we have a plausible mechanism for every step of AGW, from the digging up of fossil carbon to the cooling of the stratosphere. In fact, the onus is really on the skeptics to demonstrate why AGW would NOT be the predictable result of this causal chain of well established effects. Aside from the cranks flogging the blogs with their tales of how CO2 does not REALLY absorb IR, or how the CO2 in the atmosphere REALLY has not risen, despite both the measurements and our undeniable burning of
-
Re:Isn't that anti-science?
-
Re:Isn't that anti-science?
That does seem interesting, although that first link appears to be a highly biased source. Obviously, it would be good to see this tree ring research replicated in other countries.
You also neglected to address the other graph which covers 650,000 years.
-
Re:Isn't that anti-science?
That's an informative graph covering the 126 year period from 1880-2006, The Chinese has constructed a 2,485-year temperature series
A blockbuster Chinese study of Tibetan tree rings by Liu et al 2011 shows, with detail, that the modern era is a dog-standard normal climate when compared to the last 2,500 years. The temperature, the rate of change — it’s all been seen before. Nothing about the current period is “abnormal”, indeed the current warming period in Tibet can be produced through calculation of cycles. Liu et al do a Fourier analysis on the underlying cycles and do brave predictions as well. Chinese 2,485 year tree ring study shows natural cycles control climate, temps may cool til 2068.
which puts a different perspective on things, even makes falsifiable predictions about the future, with their informative graphs. The entire article is available at Chinese Science Bulletin. I'm personally skeptical of Dendrochronology being able to accurately and reliable separate temperature influences from others like rain fall, analysis of other sources will prove interesting.
-
Re:Both sides of debate anti-science
I don't think models predicting the future are even required to see there is an upward trend. Again, this is from NASA. AFAIK, they are fairly reputable, being the only organization on earth ever to have put people on the moon and rovers on Mars. You don't need models to see what's happened in the past. You also don't need a model to extrapolate from such a graph. It's not cyclical at all.
But maybe I'm wrong. Don't listen to me at all. Listen to the scientists (and not the politicians or evangelicals).
-
Re:Isn't that anti-science?
Climate change is in no way a "constant". The rate at which it changes is not constant. The rate at which the rate of change itself changes is also constant.
Your 'easy' test is so easy because it's useless. A very long history of solar observations has established that the sun has a cycle of its own that is approximately 11 years (which exceeds the suggested length of your test) and this cycle is not entirely predictable or consistent. There are also factors like volcanic activity, dust storms, etc. Furthermore, accuracy of models is beside the point. Historical data has illustrated an upward trend for years. Temperatures are generally climbing so the world has in fact gotten generally warmer since accurate records have been kept. This has nothing to do with modeling and is based on observation. Warming is an empirical fact. NASA has some compelling graphs. I'd wager these are more factual than Glenn Beck or Fox News or whoever brings you your news.
I can appreciate the desire to keep one's head in a hole about it. Denial is a natural impulse. Saying "the models aren't good enough" doesn't disprove anything. It certainly doesn't change the observed facts. If you want to say it's getting warmer because god wants to punish us, that's up to you. If you want to say it's not getting warmer, then you are just plain wrong.
-
Re:now called “low-energy nuclear reactions&
There are plenty of ways "anomalous" heat can be generated during chemical/mechanical processes without jumping right to the conclusion that it must be two nuclei fusing
If only there was some organization that had large numbers of people that might have the training and equipment to gain insight into such phenomena. If only.....
-
Brain Dead Sunday
Come on. First, the three no's in the summary is really all one needs to read:
"...because he has not explained how his 'reactors' work..., there is no theoretical basis to support his process, and no one has supplied independent measurements to support the specs on his black boxe"
I mean, no theory, no engineering and no independent results, what more do you need to know ?
Second, the actual presentation to NASA completely falls apart on page 13. Look carefully at the right side, and ignore the red curve. The D2 curve is not producing energy. It is absorbing energy. It is just absorbing less energy than the H2 curve.
Absorbing less energy is not the same as producing energy. Thanks for playing, come back when you are actually producing energy.
(As for why there is an ~10 second blip where the D2 and H2 curves diverge a little, I could speculate, but I don't really care. It doesn't really matter, as long as the total energy production is negative. Offer me a consulting contract at my full rate, and maybe I'll look into it.)
-
Re:Answer, in brief:
I agree. The most comprehensive document i found using the search lenr on the NASA webpage on the research there seems to be:
http://www.grc.nasa.gov/WWW/sensors/PhySen/docs/LENR_at_GRC_2011.pdf
It is an obviously very optimistic document on why NASA should fund cold fusion research. And let me - as somebody who was a scientist for 10 years - clearly state that you viewpoint should be an optimistic one, when presenting in terms of "why is that fundamentally interesting". However, you should have a realistic opinion on "what needs to be done to verify the effect" *before* promising fancy devices.
these are the references cited in the presentation above, which are not conference presentations, progress reports, or books, but real peer-reviewed papers:
Li, Xing Z.; Liu, Bin; Tian, Jian; Wei, Qing M.; Zhou, Rui and Yu, Zhi W.: âoeCorrelation between abnormal deuterium flux and heat flow in a D/PD system,â J. Phys. D: Appl. Phys. 36 3095-3097 (2003).
Widom, A., Larsen, L., âoeUltra Low Momentum Neutron Catalyzed Nuclear Reactions on Metallic Hydride Surfaces," Eur. Phys. J. C (2006)
Kim, Y. E., âoeTheory of Bose-Einstein Condensation for Deuteron-Induced Nuclear reactions in Micro/Nano-Scale Metal Grains and Particlesâ, Naturwissenschaften 96, 803(2009).
Let me say that very clearly: i am not an expert on the field. But if there would be anything which seems close to being implemented to people working in the field, then i know there would be several high-ranking papers.
what makes me *particularly* (i am an experimentalist) doubt about this research, and especially Rossi (who claims incredible rates of conversion of the material) is that it should be extremely easy to detect the helium or other products (in Rossis case) in the output. The order of magnitude of the effects cited would be *massive* and easily detectable by the signature of the reactions in the waste products. Instead of looking at the reactors, i claim it would be better to examine the material input and output.
Show me the peaks in am AMS, (if needed for efficiency, please use an acceleration mass spectrometer) for the fresh fuels and the spent fuel, and i believe in Cold fusion. Show me nice pictures and make a fence several meters around your device and don't publish in peer-reviewed journals and you will trigger my scepticism.
-
Re:There is perfectly good reason
Only six or so at a time, here.
-
Re:And conveniently enough
The computer animation is based on spectrograph data we've received. There is no claim it's 100% accurate, only that it is based on *real* data. So putting the painting, which is purely an artists imagination, and the computer reproduction of the atmosphere, based on real data, on the same level is unfair. Also to answer your question did I read your original comment? "No one knows what Pluto looks like, but somehow we know what another planet looks like from hundres/thousands of lightyears away? Makes no sense to me.". Yes, yes I did, and you're wrong. http://photojournal.jpl.nasa.gov/catalog/PIA00825 We don't have awesome photos of Pluto, but it's not some vague mystery that's totally unknown. 2015 will get us better photos. Also I'd guess that the methods we use to gather data about exoplanets isn't something we can use inside the solar system due to being blinded by Sol.
-
Re:hmm
Their argument is actually that the slight warming caused by CO2 will increase the water vapor in the atmosphere, which will cause the lion's share of the continued warming, until they hit a tripping point in the arctic that'll release megatons of frozen methane which will lead to a catastrophic warming event. Depending on who you listen too climate sensitivity is between 1.4 to 2.5; if we look at 2, it means that for each doubling of CO2, the mean global temperature goes up 2 K
Best estimate for absolute global mean for 1951-1980 is 14.0 deg-C
1980 338.68 PPM CO2
our present CO2 is 391.57PPM, when it get to 677 PPM the temperature would be expected to be 16 deg-C if they are correct. To get to 18 deg-C CO2 would have to go up to 1354PPM. Most of those clowns don't have a clue what the science they say is settled actually is. -
Re:Of course
Except... that isn't quite how it works.
Global warming means that we're changing a massively complex system. And like all massively complex system, when you tweak the parameters beyond a certain point, the system as a whole can itself wind up altering other parameters drastically as it seeks a new stable state.
Or, to put it simply, global warming could potentially lead to a sudden and drastic cooling:
http://science.nasa.gov/science-news/science-at-nasa/2004/05mar_arctic/
-
Re:Why no LEO?
My guess would be better coverage of the intended area with fewer satellites. A geo-stationary orbit would yield constant coverage with a single satellite. Whereas in LEO, the satellite orbits every 90 minutes so it would be out of contact every 45 minutes (probably more) while it's on the other side of the earth, requiring more (expensive) satellites to be launched.
As for ping times:
LEO: ~350km (approx height of ISS) = 350km/c = 1.16ms * 2 = 2.32ms
Geo-Stationary: ~35,000km = 35,000km/c = 0.116s * 2 = 0.232s = 232msReferences:
http://imagine.gsfc.nasa.gov/docs/ask_astro/answers/970408d.html
http://en.wikipedia.org/wiki/Low_Earth_orbit -
NASA Spin-offs
I realize that the 'in' thing is to bash "big, bad inefficient" government, but do try to keep up with the times. 30 second search on Wikipedia.
From Wiki
1 NASA spin-off technologies1.1 Health and medicine
1.1.1 Light-emitting diodes (LEDs)
1.1.2 Infrared ear thermometers
1.1.3 Ventricular assist device
1.1.4 Artificial limbs
1.2 Transportation
1.2.1 Aircraft anti-icing systems
1.2.2 Highway safety
1.2.3 Improved radial tires
1.2.4 Chemical detection
1.3 Public safety
1.3.1 Video enhancing and analysis systems
1.3.2 Fire-resistant reinforcement
1.3.3 Firefighting equipment
1.4 Consumer, home, and recreation
1.4.1 Temper foam
1.4.2 Enriched baby food
1.4.3 Portable cordless vacuums
1.4.4 Freeze drying
1.5 Environmental and agricultural resources
1.5.1 Water purification
1.5.2 Solar energy
1.5.3 Pollution remediation
1.6 Computer technology
1.6.1 Structural analysis software
1.6.2 Remotely controlled ovens
1.6.3 NASA Visualization Explorer
1.7 Industrial productivity
1.7.1 Powdered lubricants
1.7.2 Improved mine safety
1.7.3 Food safetyNASA even publishes a report of its spin-off technologies ( http://www.sti.nasa.gov/tto/ )
Here is a list from 2010;
NASA Technologies Benefiting Society
Health and Medicine
Burnishing Techniques Strengthen Hip Implants
Signal Processing Methods Monitor Cranial Pressure
Ultraviolet-Blocking Lenses Protect, Enhance Vision
Hyperspectral Systems Increase Imaging Capabilities
Transportation
Programs Model the Future of Air Traffic Management
Tail Rotor Airfoils Stabilize Helicopters, Reduce Noise
Personal Aircraft Point to the Future of Transportation
Ducted Fan Designs Lead to Potential New Vehicles
Winglets Save Billions of Dollars in Fuel Costs
Sensor Systems Collect Critical Aerodynamics Data
Coatings Extend Life of Engines and Infrastructure
Public Safety
Radiometers Optimize Local Weather Prediction
Energy-Efficient Systems Eliminate Icing Danger for UAVs
Rocket-Powered Parachutes Rescue Entire Planes
Technologies Advance UAVs for Science, Military
Inflatable Antennas Support Emergency Communication
Smart Sensors Assess Structural Health
Hand-Held Devices Detect Explosives and Chemical Agents
Terahertz Tools Advance Imaging for Security, Industry
Consumer, Home, and Recreation
LED Systems Target Plant Growth
Aeroge -
Re:why isn't it public domain?
They have their own custom license, the NASA Open Source Agreement.
-
Re:Windshield wipers
So you're saying, instead of blowing air across the panels, you move the panels fast through the air... Brilliant. Except...
Have you ever driven a car that's been parked for a long time, and the windshield has gotten very dusty? If you haven't, and you've only cleared a spot to see from, you'll notice the rest of the windshield is dusty. Now if you were to drive at say 55mph for as long as you'd like, when yous top again the windshield will still be dusty. Well, assuming no rain, fog, etc..
The only difference between a windshield wiper, and a brush, would be what it's made of. A rubber blade will break down rapidly enough for it to be a poor choice. That's pretty much like trying to use the wipers on the same car that was parked for years outside and got dusty. It'll make some horrible noises, and not make it much cleaner. It also may cause some pretty severe scratching as it shoves an abrasive between the blade and the glass.
The brush, sure, that's a good idea. It can also lead to scratching, but probably not as bad. Walmart sells some pretty cheap ones that would have done the job nicely. I don't seem to remember a label on them saying "certified for use on martian soil" though.
Some of the best ideas always come during or after after the mission. Too bad there's no one there with a, broom, and duct tape.
Swifter !
-
Re:white men
will be screwed
...because they're the ones who believe all the "2012 is the end of the world" crap. I suspect most folks of Mayan ancestry either don't know about the 2012 hype and don't care, don't know about the Long Count rollover and don't care, or do know about it and understand it's just some part of the calendar rolling over, not some end-of-the-world crap.
-
Re:Windshield wipers
So you're saying, instead of blowing air across the panels, you move the panels fast through the air... Brilliant. Except...
Have you ever driven a car that's been parked for a long time, and the windshield has gotten very dusty? If you haven't, and you've only cleared a spot to see from, you'll notice the rest of the windshield is dusty. Now if you were to drive at say 55mph for as long as you'd like, when yous top again the windshield will still be dusty. Well, assuming no rain, fog, etc..
The only difference between a windshield wiper, and a brush, would be what it's made of. A rubber blade will break down rapidly enough for it to be a poor choice. That's pretty much like trying to use the wipers on the same car that was parked for years outside and got dusty. It'll make some horrible noises, and not make it much cleaner. It also may cause some pretty severe scratching as it shoves an abrasive between the blade and the glass.
The brush, sure, that's a good idea. It can also lead to scratching, but probably not as bad. Walmart sells some pretty cheap ones that would have done the job nicely. I don't seem to remember a label on them saying "certified for use on martian soil" though.
Some of the best ideas always come during or after after the mission. Too bad there's no one there with a, broom, and duct tape.
-
Re:U.S. is established on religion, so
Thanks; in the same spirit of mutual respect, let me point out that it's just as unlikely for the layperson to have an insight that has never occurred the academic community in a particular field, as it is for a "civilian" to come up with some clever technique that plumbers or carpenters or electricians or mechanics or programmers never thought of. This includes such insights as the everpopular "the AGW people forgot to take into account the changes in the sun!" of course, but also such runner ups as "they didn't account for heat islands".
"3.2.2.2 Urban Heat Islands and Land Use Effects
Studies that have looked at hemispheric and global scales conclude that any urban-related trend is an order of magnitude smaller than decadal and longer time-scale trends evident in the series (e.g., Jones et al., 1990; Peterson et al., 1999). This result could partly be attributed to the omission from the gridded data set of a small number of sites (http://www.ipcc.ch/pdf/assessment-report/ar4/wg1/ar4-wg1-chapter3.pdf p.243see also
the famous Peterson 2003 paper, abstract only http://www.ncdc.noaa.gov/oa/climate/research/population/article2abstract.pdf"We show examples of the UHIs at London and Vienna, where city center sites are warmer than surrounding rural locations. Both of these UHIs however do not contribute to warming trends over the 20th century because the influences of the cities on surface temperatures have not changed over this time." (abstract only; The graphs of temp vs time for several urban vs rural areas are absolutely parallel in rises and drops, but you don't get to see them for free)
http://www.agu.org/pubs/crossref/2008/2008JD009916.shtml"Since the UHI effect is reduced in windy conditions, if the UHI effect was a significant component of the temperature record, then we would see a different rate of warming when observations are stratified by calm or windy conditions. The absence of such an effect (which is what Parker finds) is, conversely, evidence of a minimal UHI effect on the record."
http://www.realclimate.org/index.php?p=43" We find evidence of local human effects ("urban warming") even in suburban and small-town surface air temperature records, but the effect is modest in magnitude and conceivably could be an artifact of inhomogeneities in the station records."
http://pubs.giss.nasa.gov/cgi-bin/abstract.cgi?id=ha02300aOf course, one picture etc. etc.... so look here http://data.giss.nasa.gov/gistemp/2005/2005cal_fig1.gif and try to correlate that with urbanization; Note that the urbanized areas of the globe tend to be middle of the pack for warming; when the oceanic areas (which naturally warm less) are eliminated, you see that the urban areas tend to be on the low side of land surface warming estimates, which makes sense since the warming is, as predicted, larger near the poles, where urbanization is minimal. To put it another way; if you deleted all urban areas from the warming estimates on the grounds of eliminating urban heat islands, that would have the effect of raising the land warming estimate, not reducing it.
-
Re:Temporarily captured?
That's exactly it. There's a very nice animated gif here of the old Saturn V third stage captured out of the blue a few years ago (mentioned by n5vb earlier in the thread). You can see that every time it gets near the moon, it gets either slowed down or sped up depending on if it comes before or after. On the final and sixth orbit, it comes just behind the moon which slingshots it away completely.
-
Re:Why 3 months?
Ah beat me to it, I found the same link as you being the most informative.
Bottom of this page, is a movie that shows how they were released
http://www.nasa.gov/mission_pages/grail/launch/index.html
darn sure doesn't answer many questions though. -
Re:Wish they would just knock it off with "earth-l
Calling a planet "earth-like" implies way more than correlation with earth's size and it's orbit around the sun.
Actually, no, that's about it. The problem is people are screwing that up.
no human is ever going to see them or even be able to communicate with them
Yeah, wrong. And communication is trivial for anything close enough for imaging.
-
Re:Alien life would need water?
It's not so "presumed" as it is believed to be the most likely basis for complex, multi-cellular, life by a considerable margin due to carbon's versatility in forming the huge number of chemical forms with other elements that necessary for the required biological processes. That said, it's definitely not the only option, silicon, nitrogen and phosphorous based biochemisties all being seen as theorerically viable, although silicon is most often seen as the most likely alternative. Here's a (somewhat old) link to Lou Allamandola, an NAI astrobiologist, discussing the various merits of silicon- versus carbon-based life.
-
Re:This is good
The two are closely correlated in the Antartic. Feel free to show non-model datasets that would support the GP claim, and detail what is meant with "the ice sheet" [singular?].
http://ruby.fgcu.edu/courses/twimberley/EnviroPol/EnviroPhilo/MassBalance.pdf
Grace.
http://www.nasa.gov/topics/earth/features/20100108_Is_Antarctica_Melting.html