 Slashdot Mirror
Domain: noaa.gov
Stories and comments across the archive that link to noaa.gov.
Comments · 2,602
-
Re:I have full faith...
Anyone who lived through all of the 70's and into today knows this intrinsically. Read up: http://oceanservice.noaa.gov/e...
-
Re:Projections
The observed temperatures are currently below the error bars of the most optimistic projection. What does this mean?
It means you are reading BS that does not reflect *reality*.
http://www.ncdc.noaa.gov/sotc/...
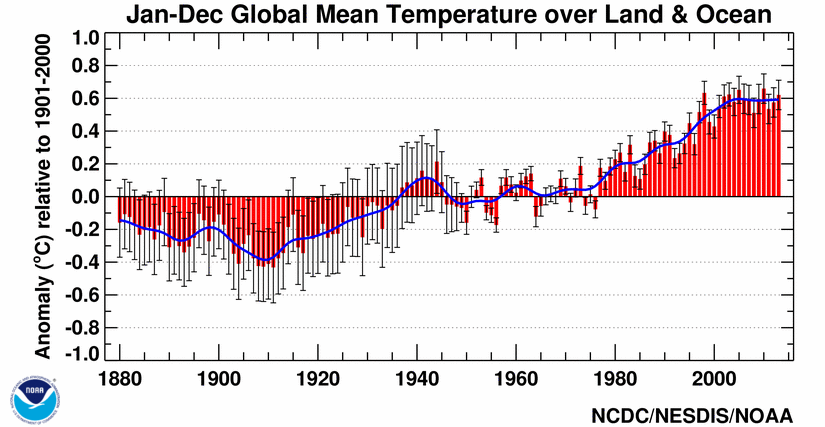
The combined average temperature over global land and ocean surfaces for February 2014 tied with 2001 as the 21st highest for February on record, at 0.41C (0.74F) above the 20th century average of 12.1C (53.9F).
The global land surface temperature was 0.31C (0.56F) above the 20th century average of 3.2C (37.8F), tying with 1943 as the 44th highest for February on record. For the ocean, the February global sea surface temperature was 0.45C (0.81F) above the 20th century average of 15.9C (60.6F), making it the seventh highest for February on record.
The combined global land and ocean average surface temperature for the Decemberâ"February period was 0.57C (1.03F) above the 20th century average of 12.1C (53.8F), making it the eighth warmest such period on record.
-
Re:Whaling bad, mass breeding cattle and pigs good
Remember folks, the US does allow whaling. Alaska native tribes are still allowed a subsistence hunt for bowhead whales.
-
Re:A myth indeed.
Additionally just because the planet hasn't warmed in 17 years...
Wow, do people still actually point at the anomalous 1998 data and ignore the decades before that? I didn't think anybody did that anymore, ever since GWB finally admitted global warming was a real thing (though he never accepted it was man made).
Well lets see,
The national maps show temperature anomalies relative to the 1981–2010 base period. This period is used in order to comply with a recommended World Meteorological Organization (WMO) Policy, which suggests using the latest decade for the 30-year average. For the global-scale averages (global land and ocean, land-only, ocean-only, and hemispheric time series), the reference period is adjusted to the 20th Century average for conceptual simplicity (the period is more familiar to more people, and establishes a longer-term average). The adjustment does not change the shape of the time series or affect the trends within it. NOAA's National Climatic Data Center (NCDC)
I didn't pick out the dates, reality did.
-
Re:I know why they're annoyed
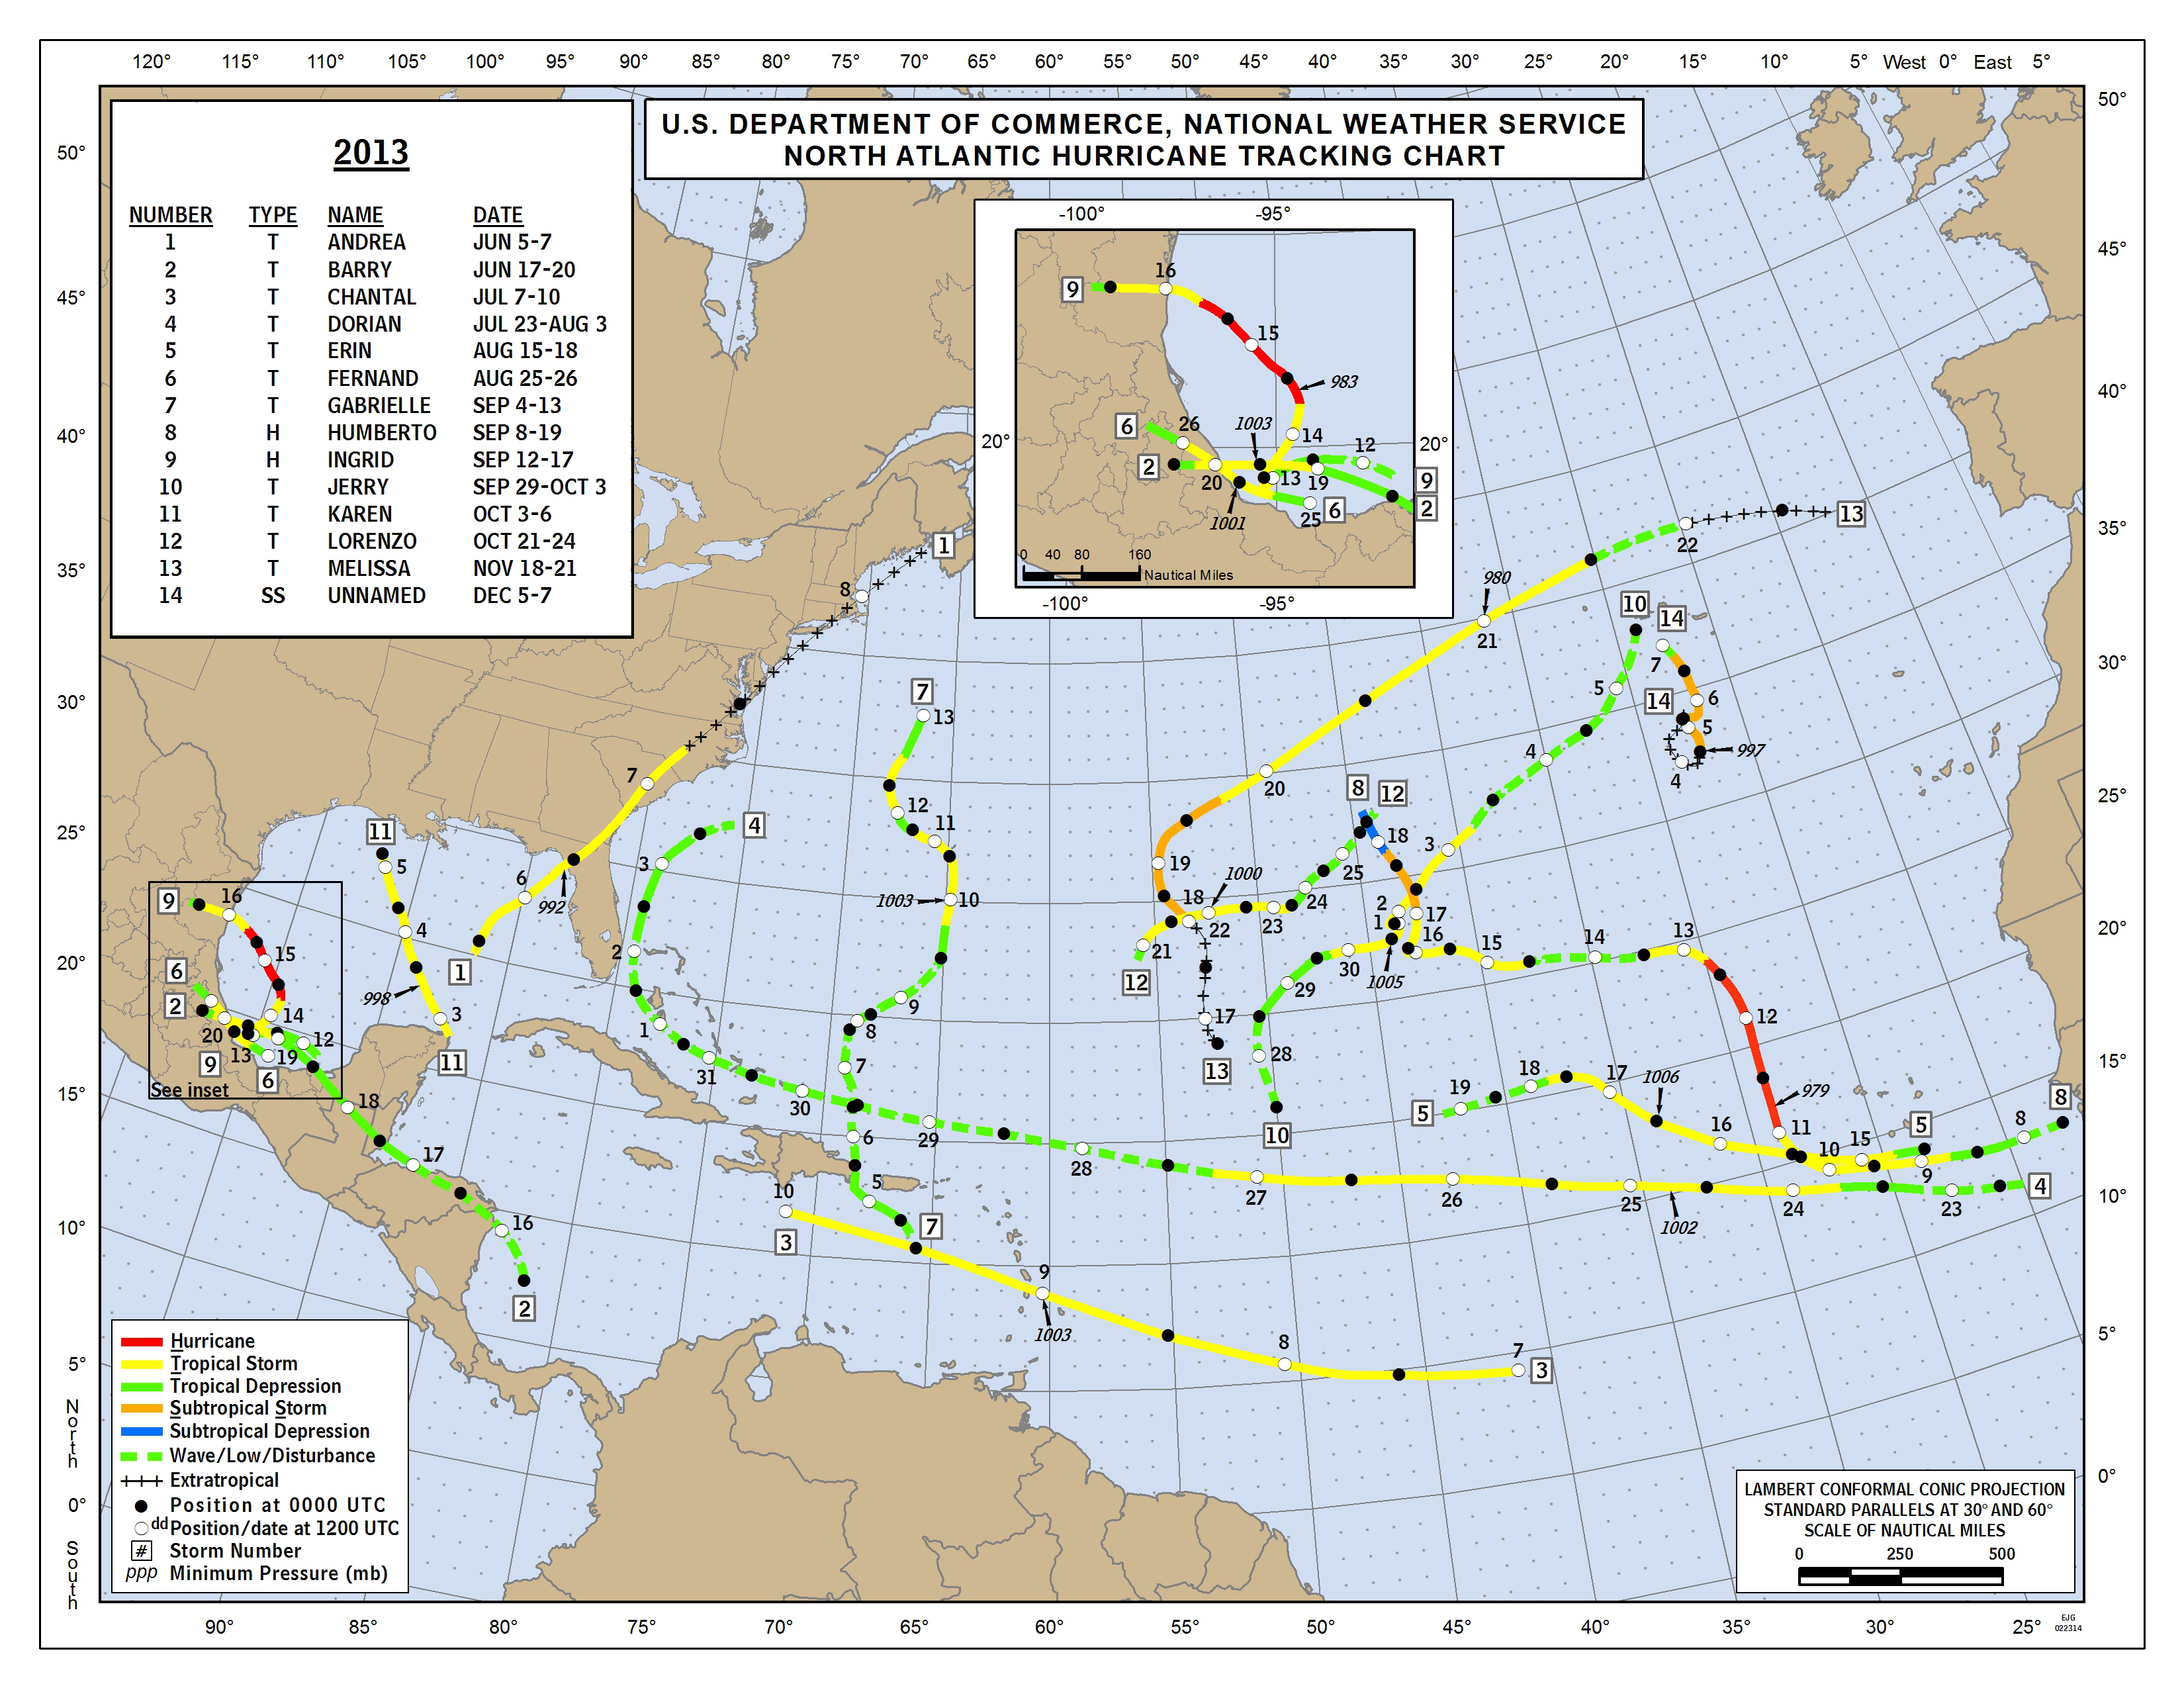
Except the number of Hurricanes actually HITTING the U.S. has dwindled significantly in the last couple years. The one or two that do get through hit in more sensitive areas not prepared for it.
Every year the NOAA has pronounced a more severe storm season that's whimpered despite naming storms they wouldn't have even considered 10 years ago. I know, because I have been watching.
Example:
http://www.nhc.noaa.gov/data/t...
Found at:
-
Re:I know why they're annoyed
Except the number of Hurricanes actually HITTING the U.S. has dwindled significantly in the last couple years. The one or two that do get through hit in more sensitive areas not prepared for it.
Every year the NOAA has pronounced a more severe storm season that's whimpered despite naming storms they wouldn't have even considered 10 years ago. I know, because I have been watching.
Example:
http://www.nhc.noaa.gov/data/t...
Found at:
-
Re:Go after em Nate
And from an anecdotal point of view having been in emergency management for 15 years, I can say from personal experience that storms are getting more frequent and more powerful.
Interesting, must just be your neck of the woods, since hurricane/cyclone frequency and energy is decreasing on a global scale. Sure, we're spotting more hurricanes/cyclones, but fewer are making landfall and are weaker as well. Perhaps our ability to spot hurricanes out at sea, and classify them correctly is what is getting better, not the actual number occurring.
Likewise with tornadoes, which have remained more-or-less constant. Damage caused by F1 to F5 tornadoes is actually dropping; it's the little guys, the F0s, that are increasing damage. Is that because there are more tornadoes? No, there are not more tornadoes. I suggest it is because there is more lightweight construction in/near tornado zones and so damage is happening where in the past it would not - nothing to damage.
-
Re:Big Models
You'll notice in the graph at your link that the temperature trend is flat since about 2000. No warming. Thanks for proving my point.
Big picture here
http://www.ncdc.noaa.gov/sotc/... -
Re:Big Models
http://www.ncdc.noaa.gov/sotc/...
Global Highlights
The combined average temperature over global land and ocean surfaces for January was the warmest since 2007 and the fourth warmest on record at 12.7ÂC (54.8ÂF), or 0.65ÂC (1.17ÂF) above the 20th century average of 12.0ÂC (53.6ÂF). The margin of error associated with this temperature is ± 0.08ÂC (± 0.14ÂF).
The global land temperature was the highest since 2007 and the fourth highest on record for January, at 1.17ÂC (2.11ÂF) above the 20th century average of 2.8ÂC (37.0ÂF). The margin of error is ± 0.18ÂC (± 0.32ÂF).
For the ocean, the January global sea surface temperature was 0.46ÂC (0.83ÂF) above the 20th century average of 15.8ÂC (60.5ÂF), the highest since 2010 and seventh highest on record for January. The margin of error is ± 0.04ÂC (± 0.07ÂF).
If I choose not to believe it, it cannot be true!
-
Re:$100,000?
The SARSAT system has been around for a really long time and does the whole "guys, something broke up here really badly" thing. Digitial encoding, GPS, thewhole bit. Most planes (even tiny ones) have them.
-
Re:Not everything observed...
I'm saying that so far, nobody has enumerated a set of good tests for AGW that would discriminate AGW from natural variation. In some ways, this is simply a feature of our ignorance, since any of these observations can be "explained":
1) CO2 up, temp up - "classic" AGW
2) CO2 up, temp flat - "hidden heat" ad hoc special pleading to preserve AGW
3) CO2 up, temp down - "hidden heat" ad hoc special pleading to preserve AGW
4) CO2 flat, temp up - "lingering effects" AGW
5) CO2 flat, temp flat - "classic" AGW
6) CO2 flat, temp down - "hidden heat" ad hoc special pleading to preserve AGW
7) CO2 down, temp up - "it's worse than we thought" AGW
8) CO2 down, temp flat - "hidden heat" ad hoc special pleading to preserve AGW
9) CO2 down, temp down - "classic" AGWWhen you think about it, every combination is possible with natural variation - we've observed every single one of those cases in the historical record. Without precise knowledge about all natural variations, we're quite stuck. Such systems aren't completely impossible to analyze (note the accuracy of tide predictions simply through fourier transforms), but often our analysis is not one that is something that can discriminate individual causes even as it is incredibly accurate and predictive. http://www.co-ops.nos.noaa.gov...
The count is thirty-four now for the low climate sensitivity answers, and it now stands at seven for the "constellation" question.
Can we agree that your contention is that there are no contradictory predictions in the name of AGW/CAGW in the peer reviewed literature, and that you furthermore contend there exist thus far unspecified good tests to discriminate AGW from natural variation?
-
Perhaps compounding the issue ...
... much of the region is suffering from drought conditions. While eastern drainages to the Colombia have a fairly robust snow pack, many to west and south of the river are suffering. This would normally suggest the Army Corps of Engineers would want to hold back more water in the reservoirs, but this news impacts such actions. In the mixed new category, storms are currently lining up to dump on the region. Snow pack data is available, here: http://www.nwrfc.noaa.gov/snow/ 10-day weather forecast maps, here: http://www.nwrfc.noaa.gov/weather/10_day.cgi
-
Re:Freebreeze to the rescue
-
Re:Freebreeze to the rescue
-
Re:BS junk science
Second the world is getting cooler
Too much coolaid? Want to check reality?
http://www.ncdc.noaa.gov/sotc/...
The year 2013 ties with 2003 as the fourth warmest year globally since records began in 1880. The annual global combined land and ocean surface temperature was 0.62ÂC (1.12ÂF) above the 20th century average of 13.9ÂC (57.0ÂF). This marks the 37th consecutive year (since 1976) that the yearly global temperature was above average. Currently, the warmest year on record is 2010, which was 0.66ÂC (1.19ÂF) above average. Including 2013, 9 of the 10 warmest years in the 134-year period of record have occurred in the 21st century. Only one year during the 20th centuryâ"1998â"was warmer than 2013.
-
Re:There are no comments
"In 2013, there were 7 weather and climate disaster events with losses exceeding $1 billion each across the United States. These events included five severe weather and tornado events, a major flood event, and the western drought / heat wave. Overall, these events killed 109 people and had significant economic effects on the areas impacted." - http://www.ncdc.noaa.gov/billi...
This may be considered an ounce of prevention.
-
Awesome satelite photos
The GOES imagery has looked really cool as of late. As I've watched the storm travel west and then north, it's been really awesome to see the progression and the effects of the Coriolis force.
-
Re:Fight with numbers
In 2010 a study was published [PDF] that compared the temperature trends of Watt's surfacestations.org lists of well and poorly sited weather stations. It found that the the poorly sited stations actually had a cooling bias on the warming trend compared to the well sited stations. To me that means the UHI effect is well compensated for and perhaps a bit overcompensated for.
Remember also that we're not so much interested in the absolute temperature but how temperature is changing over time. It seems plausible to me that a well sited station and a nearby poorly sited station would show similar temperature trends even if the poorly sited stations reads 5 degrees higher because of the UHI effect.
-
Re:Who do you think the GOP will blame
The east coast will never be under water. At most, it will move inland a bit but the coast will always be the coastline.
On that note though, if the east coast is going to be relocates due to some preventable event, it will not happen for years and years so it will be relatively easy to deal with it over time. So the sea level is expected to climb something around 3 to 4 feet by the year 2100 if all goes as claimed. That's about 86 years from now.
So here is the question of the day, why can no levies, changes in building codes, flood plain maps, flood gates, or anything like that ever be implemented in that 86 year time span (roughly 2-3 generations of productive lifespans)? Even if Global Warming is a threat, why is the only way to deal with it seem to be cut emissions and oppress populations in order to protect the prime real estate of wealthy people instead of dealing with the problems as they are expected to be realized? Sure a flood wall might be an eyesore blocking your pristine view of the bay just like all those windmills that never got built would have. But why must the cost of energy and products become so outrageous that people cannot afford it in order to preserve that life style and views? It's not like we can stop or reverse global warming so why not deal with it and blame yourself if you get caught checking your mail in your underwear?
-
Re:More snow = more pressure = faster calving!
The center of Greenland's ice sheet may be thickening but over all Greenland is losing ice mass at a rate of over 260 Gt per year since 2002 as measured by the GRACE satellites. See the Total Ice Mass section of this report for details.
-
Re:More snow = more pressure = faster calving!
I did a little searching and found a paper from 2011 [pdf] that addresses Jakobshavn specifically. It has this to say:
3.3. Jakobshavn Isbroe
Jakobshavn Isbroe was losing 8 Gt a1 of mass per year in 2000 (Figure 2). This rate increased over the following years to near 25 Gt a1 by the end of 2002. The loss rate then stabilized and declined back under 20 Gt a1 until 2006, when it increased to 33 Gt a1, reaching 34 Gt a1 by the end of 2007. Subsequently, the annual loss rate has fluctuated between 25 and 33 Gt a1. In total the glacier lost 321 ± 12 Gt by the end of 2010, equivalent to a basin!wide thinning of 3.5 m, with 2/3 of this loss occurring since June of 2005 (Figure 3). The 85 km2 of retreat accounts for nearly 20% of this loss. The rate of discharge is now such that the glacier is losing mass nearly throughout the year. As previously reported [Joughin et al., 2008a, 2008c; Luckman and Murray, 2005], annual oscillations in speed of ±20%, with a peak in June/July, correlated with seasonal retreat and advance of the ice front, become increasingly pronounced at the location of the fluxgate after 2005 (Figure S7). Seasonal oscillations in speed, SMB and front position cause annual fluctuations in mass of up to 50 Gt.
Of the other two glaciers reported on in the paper Helheim gained 17 +/- 13 Gt and Kangerdlugssuaq lost 152 +/- 10 Gt compared to Jakobshavn's 321 +/- 12 Gt in the 11 year period studied. Those are the three largest outlet glaciers in Greenland.
More generally the ice mass loss on Greenland has been well documented by the GRACE satellites. See the Total Ice Mass section of the Arctic Report Card: Update for 2013 for details.
-
Re:Pffft
Read and learn...or else!
2.1 Characters, Case, and Punctuation for Narrative Text. Narrative text uses upper case and only the following punctuation marks in the text: the period (.); the three dot ellipsis (...); the forward slash (/); the dash (-); and the plus (+). Use of other characters may inhibit the proper dissemination or automated processing by certain users’ systems.
http://www.nws.noaa.gov/direct...
2 points:
A) Who cares if it's in all caps?
B) It's an international service, so it need to support many systems, several of which are older systems in poorer countries. -
Re:The real point of what Detroit has to offer...
Lakes Michigan and Superior have seen a small drop over the last 20 years, which likely depends on overall precipitation. Others have not. From Wikipedia: The source of water levels in the lakes is tied to what was left by melting glaciers when the lakes took their present form. Annually, only about 1% is "new" water originating from rivers, precipitation, and groundwater springs that drain into the lakes. This is balanced by evaporation and drainage, making the level of the lakes historically constant.[10]
As for pollution, do you have any references? I'd argue that the lakes have gotten cleaner since the 70s, but I don't have evidence other than my own visuals.
Useful water level link below shows history back to the 1800s.
http://www.glerl.noaa.gov/data... -
Re:Propaganda Piece fudges truth . . . News at 11
But But, Northern Hemisphere is *where* I live and it is cold here!! That Europe thing, or Russia or whatever must be somewhere in the other hemispheres!!1!!
http://www.ncdc.noaa.gov/sotc/service/national/Statewidetrank/201301-201312.gif
see! record coldest everywhere in the worlds!! oh wait, they are hiding real data!!11! The numbers for Warm Records vs. Cold Records are clearly backwards!
-
Re:Pshaw... it's just weather!
Arctic ice extent is expanding again... [Jane Q. Public]
Here we go again. Jane's comments on sea level, UAH and surface temperatures follow a pattern. First, Jane plucks a short term trend from the noise and waves it around. Scientists then point out that Jane's trend is so short that it just represents weather noise, not climate signal. Jane then insists that waving around short term trends isn't meant to imply anything about the long term trend. Rinse, repeat.
... the Antarctic summer is colder than usual, with even more sea ice.
So, consistent with Manabe et al. 1991 page 811: "... sea surface temperature hardly changes and sea ice slightly increases near the Antarctic Continent in response to the increase of atmospheric carbon dioxide."
... all the while, we've been experiencing a weak "El Nino" event. So even with ENSO on the warming side, it has been very cold in much of the world.
The last point on NOAA's MEI index is -0.312, which is on the La Nina side but effectively neutral.
This was from my friendly neighborhood meteorologist, last Monday. It is possible he is wrong, but he is a recognized expert in his field, not a "meteorologist" on TV. I suppose we shall see.
No link and no name = argument from inscrutable authority. In reality, we might have an El Nino by July which will serve as the basis for the talking point I mentioned at WUWT.
Some of those who disagree did so from the very beginning, on the premise that it's the Sun and other natural factors that drives climate change, not CO2. Just a fact.
Yes, many contrarians operate under the premise that climate change is natural and not driven by human CO2 emissions. In contrast, scientists measure contributions from many natural factors, and many human factors. Scientists don't start from either biased premise, but obviously contrarians do. Thanks for finally being honest, Jane.
-
Re:Where's the evidence?
-
Re:Killed because of the message
"hiding" the decline.
http://climate.nasa.gov/evidence
http://www.ncdc.noaa.gov/extremes/records/
Yet, we keep getting more low temps and even more high temps - more weather extremes - just as predicted.
-
Re:Oh my God...
The data is published. The reason that you didn't find what you want is that you apparently didn't bother to look.
Here's a nice data source packaged up so that you can connect to it really easily: http://datamarket.azure.com/dataset/weathertrends/worldwidehistoricalweatherdata
And here's all the US' weather data: http://www.ncdc.noaa.gov/cdo-web/ .
The only person hiding data from you is, apparently, you.
-
Re:Precipitation seems to have moved north
Interior Australia seems to be suffering a terrible drought while Northern Australia is being inundated.
Australia: Percent of Normal Precipitation
This is pretty normal in Australia, Interior of Australia has a long history of 4+ year droughts every decade or 2 then we get summers with insane levels of rainfall flooding everything, Australia rarely does things by the averages, it is usually one extreme or the other. I grew up on Australian farm. I vividly remember the long drought in the 80's and my father refers to that as a moderate one compared to what he had in the 60's and 70's. We have photos of our farm as a dust bowl in 30's as well, something my father hasn't even seen it get as bad as.
-
Re:Pshaw... it's just weather!
Also, 1100 new highs.
http://www.ncdc.noaa.gov/extremes/records/
Guess what climate change predicts? More variability.
-
Precipitation seems to have moved north
Interior Australia seems to be suffering a terrible drought while Northern Australia is being inundated.
-
Re:A bit hypocritical
Oh, a master of words.
Verily.
However you should also read and try to comprehend http://www.gfdl.noaa.gov/global-warming-and-hurricanes what you have linked here. It seems to contradict your point. (And: it only covers EXPLICITLY atlantic hurricanes, that means it leaves out european orcanes and asian tai funs
Well, there's a couple things here. First, "hurricane activity" is ambiguous and it's helpful to look at two metrics: frequency and intensity. If you read carefully, you will see that the noaa.gov summary claims a hunch that with the progression of AGW, hurricane frequency will diminish, but intensity will go up for large individual storms in certain hurricane basins. However, their final conclusion is while they have these hunches, they do not (yet) have the higher levels of confidence claimed by AGW doomsayers in other climate change fields. In other words, it's premature to conclude that there's any detectable link between AGW and hurricane activity changes. Read the section "F. Synthesis and Summary", and I think you'll see that I haven't misrepresented them.
-
Re:A bit hypocritical
Oh, a master of words.
For me
But you have a point, perhaps the blog you posted has some links to "relevant" data.
However you should also read and try to comprehend http://www.gfdl.noaa.gov/global-warming-and-hurricanes what you have linked here.
It seems to contradict your point. (And: it only covers EXPLICITLY atlantic hurricanes, that means it leaves out european orcanes and asian tai funs
Anyway: the paper clearly states that hurricane activity has increased. You claim it has not. Try another link please -
Re:A bit hypocritical
On average per year hurricane frequency has increased, so what is your point?
According to this link current research doesn't really give any confidence regarding a link between AGW and hurricane frequency and intensity. However, their hunch is that hurricane frequency will decrease with rising temperatures (counter intuitive, huh?).
A random year 40 years ago that had "more" than we had on average the last 10 years? What exactly do you want to point out with that?
I have no idea what you're talking about. I am not a hurricane researcher and am not presenting my own analysis here.
That you are an idiot
Lovely.
and don't understand that a hurricane and a tai fun is the same thing in different parts of the world?
Uh... thank you for bringing up random facts, I guess?
Sorry, I don't have the time to follow links of random hobby blog posters who have no clue
One of the most important skills a person can have is not taking him/herself too seriously. Please allow me to assist you in this area. Now, you are demanding that I post a link to a scientific paper myself, directly. You don't want to go to that blog post and follow its links, because it's just a blog on the internet, right?
Prepare to have your mind blown..... ready?...... Slashdot is just a blog on the internet, and you apparently DO "have the time to follow random hobby blog posters who have no clue", because that's what you're asking me to facilitate for you (you made it plain that you think I "have no clue", so it fits perfectly).
Do you feel silly yet? -
Re:Smog's wish
Wait, are you saying that articles are now disproving theories?
That's awesome.
Awesomely stupid.
In the mean time, the temperature is still going up.
http://data.giss.nasa.gov/gistemp/graphs_v3/
http://www.ncdc.noaa.gov/extremes/records/ -
Re:Global vs. local effects
There's a lot of all time highs in the last year in the US.
-
Antares is at risk, not Cygnus
Although TFS states that:
Citing concerns of the effect increased levels of space radiation may have on the Antares launcher and Cygnus avionics
It is actually written in TFA that:
The Cygnus spacecraft would not be affected by the solar event.
Having been involved in the design of some of the avionics onboard Cygnus, I can attest that a S2/S3 class solar event such as this one is well within the specifications of the spacecraft.. -
Re:CME frequency
Google "Carrington Event".
Be afraid. Be very afraid.
Actually, take a look at the NOAA Space Weather Scales, and you'll see how often different level events occur, and what their outcomes can be.
-
Re:I call bullshit on your real winter
The NOAA lists -27F as the lowest recorded temperature in Chicago.
They also have a list of days with a temperature below -16F and 1980 wasn't listed.
http://www.crh.noaa.gov/lot/?n=chi_temperature_records
If you notice, he was very careful to not specify his temperature units.
I think at this point, we can only rule out the Kelvin scale and assume that he must either be a politician or lawyer.
-
I call bullshit on your real winter
The NOAA lists -27F as the lowest recorded temperature in Chicago.
They also have a list of days with a temperature below -16F and 1980 wasn't listed.
-
Chicago Colder than South Pole!
When I woke up this morning to go to work I checked the weather and this is what I saw: -14 F, -38 F Windchill in Chicago and -11 F, -39F Windchill at the South Pole. I don't think I've ever seen temps that low before. The good news is that like the temps, traffic into work was way down.
-
Re:Just remember now...
Globally. Obviously, I don't have detailed data on my particular microclimate, and the data is leaning towards cooler than last year, but way warmer than a decade ago. obviously december isn't done yet, check back in a week
-
Re:Global warming.
It's actually called Ampholpological Global Warming.
3 words to understand.
Ampholpological - human induced (due to CO2, methane, etc.)
Global - global, as in "The Earth as whole", not your backyard
Warming - as in heating upSo, human induced warming of the earth's average temperature. Simple, eh?
It doesn't say that climate will change, but heating the planet likely will change it. It doesn't say weather extremes will happen. It doesn't say there will not be ice in Antactica in December of 2014 or 2020. It says the planet is warming.
Now, if you want to look how your current weather looks in terms of global averages, just look.
http://www.ncdc.noaa.gov/sotc/
http://www.ncdc.noaa.gov/sotc/service/global/map-percentile-mntp/201311.gif
so if you live in eastern US, you are probably colder than normal. But if you live almost everywhere else in the world, it is kind of warm. For example, look at Moscow. In 1942, Hitler was defeated near Moscow and weather played an important part. It was very cold and usually it was very cold in Russia in winter. This year? -4C (or +25F).
https://www.google.ca/#q=moscow+weather
So now you can look up weather in plenty of places with internet and verify that NOAA is not lying to you about AGW.
-
sea level measurements from 1860 to current
Sorry that direct measurements of sea levels disagree with an "upswing" in the last 100 years. http://co-ops.nos.noaa.gov/sltrends/sltrends.html has sea levels at various measuring stations around the world. Some go back more than 100 years. New York's Battery for example goes back to 1856. It's sea level change is quite linear at 2.77 mm/year or 0.91 feet per 100 years.
-
Re:Way to state the obvious
*sigh* Do you know how to actually look for information? Do you know that weather in one part of the globe is not the same as another? Do you know that Europe is warmer than North America or Siberia because?
http://en.wikipedia.org/wiki/Medieval_Warm_Period
Global temperature records taken from ice cores, tree rings, and lake deposits, have shown that, taken globally, the Earth may have been slightly cooler (by 0.03 degrees Celsius) during the 'Medieval Warm Period' than in the early and mid-20th century.
For example, do you know that right now Russia is experiencing record warm December as there is very cold outside my house in North America? Do you know that right now is one of the warmest months on record?
http://www.ncdc.noaa.gov/sotc/service/global/map-percentile-mntp/201311.gif