 Slashdot Mirror
Domain: noaa.gov
Stories and comments across the archive that link to noaa.gov.
Comments · 2,602
-
Fishery Observer Program in the Bering Sea
NOAA runs the National Observer Program that puts Fisheries observers on commercial fishing vessels at sea. Being an observer on ships in the Pacific Northwest was, for me, an amazing education in applied biology. http://www.st.nmfs.noaa.gov/observer-home/index
It also pays you a salary while you don't need to pay rent (you're on a ship). I'm specifically recommending Pacific Northwest because it's an amazing piece of ocean to spend some time in: you train in Seattle, fly to Alaska, then get on a ship where it can snow on you in July.
You'll have some good stories when you get back.
-
Re:I believe the wolves were taken
I'd be weary when reading too much into the idea that we always inherently found puppies cute,
There has been a lot of research done in the field of cuteness. The dominant theme seems to be that young of most mammal species (and some hatchlings) show similar ratios of features, curves, and generally downplaying any pointy aspects. So any mammal with a parental motive at the time will likely act to protect the cute, harmless cub. Stories are plenty of mothers (or motherring aged but unmated) of various carnivore species adopting young of a prey species. Or on a more mild note, such potential mothers adopting young from species that are generally seen as rivals in nature.
Humans are quite abnormal in that the reproductive and parental insticts are much more constant than most species. -
Re:That and...
well lets start with the 16 bit color color palette, hard to read, fonts massive over sized non scaling buttons.
Well.. Is that a bad thing? I'm not a user interface expert but in my opinion It provides better contrast between interface elements/controls.
http://ferret.pmel.noaa.gov/static/Documentation/rostock_paper/gui_main.gif
Can't you tell immediately what are the controls and what they do? Now compare that with the interfaces that some software companies started pushing into our throats, where you can't even tell the difference between clickable and non-clickable elements! That and the abusive integration of media and/or distracting UI elements.
Everything seems to be geared for content consumption but what about production? Are we supposed to be productive using interfaces designed for content consumption?Actually the only thing I really miss is focus follows mouse.
Well, pretty much all window managers in Linux allow you to configure them to work that way.
-
Re:What about paper bags?
-
Re:Primitive Tech
I recently built a decoder for EAS/SAME messages. You can read about the protocol it uses at the National Weather Service. Forget about cryptographic signatures; SAME has absolutely no concept of message integrity. There is no CRC or checksum—not even a lowly parity bit.
Of course, it's difficult to use a checksum when you can't figure out when the message ends. Most systems use some kind of flag byte to tell the decoder where the end of the frame is, but SAME doesn't even have that. The decoder has to figure out where the end of the message is by parsing it and lopping off the garbage from the end. Messages are "redundant" in that they are repeated three times, but this doesn't improve redundancy very much. SAME also depends on a voice message to convey the content of the alert, which is hardly ideal in today's environment.
But SAME does have one thing going for it: You can actually get the messages. Its heir-apparent, IPAWS, seems more heavily focused on making sure people can't get the alerts. There are no public distribution hubs—you have to have a certificate from FEMA to get any data. Even with a certificate, there is, reportedly, no data to be had. I hope they make a SAME 2.0, even if it's only for end delivery to the general public via weather radios.
I've built the EAS decoder into a new version of multimon, which is available here. It can't generate messages; it only decodes them. From the YouTube video, here is what the zombie apocalypse man had to say:
ZCZC-CIV-LAE-030077-030007-030043-030049-030059+0015-0422133-KRTV -
Please don't spoof EAS messages. The system is fragile enough without you messing with it.
-
Re:Caffeine pollution is a known issue.....
http://www.nature.com/news/2003/030120/full/news030113-10.html
http://www.sciencedaily.com/releases/2011/11/111122112023.htm
http://researchmatters.noaa.gov/news/Pages/caffeine.aspx
Man, if you want to start getting down to the part-per-trillion and part-per-quadrillion levels, we'll be able to see variation in 'pollution' levels for any known substance. Example, the National Geographic article notes the 'polluted' seas had caffeine levels of 45 ng/L. Compare that to a 12 oz. drink with 100 mg of caffeine in it. The 'pollution' we're talking about is at 0.0000016% the concentration found in caffeinated drinks.
I know a lot of scientists really want to ask and answer questions like "can increasing caffeine levels 0.000002% in the environment cause problems?", but the fact is until we actually understand how the environment works as a system and how living creatures' bodies work as a system, we will not have the tools at hand to answer them. The statistical tools we have developed instead of this systemic knowledge are constantly abused, either by failing to control for variables, or simply ignoring basic assumptions underlying the physical and/or statistical model.Top level scientists in the 21st century are dropping the ball.
-
Caffeine pollution is a known issue.....
-
Re:Look at the data
* is the World is warmer than it has been for the last two thousand years? Why is the answer to this question relevant? There are many variables that affect climate (forcing factors). It's entirely possible that we've experienced cooling over the first 1700 of the last 2000 years; that has nothing to do with what degree (ha!) of change we should expect from our cranking CO2 up past any level we've seen in the last 15 million years. http://newsroom.ucla.edu/portal/ucla/last-time-carbon-dioxide-levels-111074.aspx * is the warning of the last three hundreds years (which is undeniable) human induced? You quote Watts. He (unsurprisingly) gets the science wrong: http://grist.org/climate-energy/co2-doesnt-lead-it-lags/ * why are scientists who use the Scientific Method and go against the narrative being vilified? and 1. Who is being vilified? Names, please, of climate scientists who have been vilified for arguing against AGW. I know of very few -- Lindzen and Singer, perhaps, the latter being entirely deserving of vilification to the point of outright dismissal from the conversation, given his enthusiastic and utterly disingenuous defense of the asbestos and tobacco industries and the former appearing to simply be a contrarian in general. http://www.realclimate.org/index.php/archives/2012/03/misrepresentation-from-lindzen/ Meanwhile, climate scientists who report that we're headed in a dangerous direction are receiving death threats. No, really: http://www.popsci.com/science/article/2012-06/battle-over-climate-change 2. Controversial research results are a dream. Anybody who could come up with a data-driven defensible argument disproving AGW would have their career made for them. * global climate models "Much of the global warming information is based on 'extrapolations' (projections) of short-term trends." Hm. Seems like lots of folks are running tests of current GCMs against paleo data, which undermines if not invalidates your point. http://www.research.noaa.gov/climate/t_modeling.html#figure4 http://www.giss.nasa.gov/projects/gcm/ http://www.ipcc.ch/pdf/assessment-report/ar4/wg1/ar4-wg1-chapter6.pdf I know that climate change, as a global problem, is painful for libertarians to consider. However, as Feynman said, nature cannot be fooled. In a battle between physics and philosophy, I bet on physics. Apologies if the formatting is broken in this post; apparently Safari on a Mac doesn't want to insert line breaks.
-
Re:my fear
According to NOAA, we should be nearing the peak of a solar cycle. Sadly, it's been a terrible 'peak' for radio propagation. I've only got so many 11 year cycles left to live - come on, Sun, give me a break!
-
Re:Look at the data
On your southern / northern point, CO2 mixes rather evenly throughout the atmosphere in only a few years.
Here's a great animation from NOAA showing global CO2 distribution and putting recent changes in the context of the last million years or so. It takes a few minutes to watch, but it's worth seeing to the end, in my opinion.
-
Re:Now THERE's a reversal.
Warming has not been lower than forecast (what stinking place did you pull that from?)
I pulled them from a VERY stinking place, some place most people never go, the actual data. Take a look at the IPCC forecasts from 1999 IPCC now take a look at actual data from 1999 to 2012 at NOAA (or Hadley CRUT).
It clearly shows that while there has been warming it has been lower than the low forecast.
If you don't want to sift through the data (although I encourage you to do so and see for yourself), here's an article from an anti-denier site showing Hansen's 1988 predictions similarly being low. Note that this site is in the business of proving that global warming is real, their bias is strong and their data is suspect but even they clearly admit that actual temperatures are below the forecast.
These aren't cherry picked examples either, take most past temperature predictions and chart them against actual and you'll see that the rise is less than predicted. Or check the IPCC predictions from edition to edition and you'll see that they are slowly moving down in the near term (although often have global warming shift into high gear a few decades hence).
To be clear, I'm not a denialist. I do think global warming is real and a problem. But I think Climate Science is a lot like economics, they have a pretty good idea what's going on and you'd be foolish to ignore them, but you'd also be foolish to think that they have everything fully figured out or that they aren't missing some really big and important factors in their analysis.
-
Re:Europe has our back
Considering that the ECMWF's model has proven itself to be more accurate than the GFS for a long while now, to the point that ECMWF are now working together with NOAA to improve the GFS, your complaint is invalid.
The fact that US metereologists are complaining about US weather forecasting falling behind the EU should tell you something.
NWS's own statistics backs up the conclusion:
http://www.emc.ncep.noaa.gov/gmb/STATS_vsdb/ -
Re:And the trumpeting doesn't help
My data set is my window. It's been hotter than hell.
[---]
I'm sure you can cherry pick all sorts of graphs about the frequencies of particular types of storm events. Big deal.See, I have issues with anecdotes as evidence. I'm also quite sure I don't do any cherry picking - I really want you to show me a dataset that indicated our current weather is unusual over long time scales. As for temperatures in the US, the 30s is a good match.
This is a list over different records for different US states and when they were set. I think you'll find it interesting: http://www.ncdc.noaa.gov/extremes/scec/records
-
Re:And the trumpeting doesn't help
Reality?
There's no data pointing to today's weather being any different than the weather we've always had. If you believe differently, please point to such a data set.
Here's some to get your started:
http://policlimate.com/tropical/global_running_ace.png
http://policlimate.com/tropical/frequency_12months.png
http://policlimate.com/tropical/global_major_freq.png
http://www1.ncdc.noaa.gov/pub/data/cmb/images/cei/step6.ytd.gif
http://www.aoml.noaa.gov/hrd/Landsea/gw_hurricanes/fig33.jpg
http://www.ncdc.noaa.gov/oa/climate/severeweather/tornadoes.html
http://www.epa.gov/climatechange/images/indicator_figures/precipitation-figure2.gif
http://waterwatch.usgs.gov/new/regplots/real/real_us_2.gif -
Re:How about the rest of Antartica?
You will find the information you're looking for at NOAA's National Climatic Data Center. The link to Land-Based Station Data is the one you want to follow.
-
Re:-1 for linking to FOX news
However, not to be a denier just a questioner, how can we tell if this is just part of the statistical variations to be expected over time rather than an actual real trend?
A part of the answer to your question can be found here: http://www.esrl.noaa.gov/gmd/ccgg/trends/history.html . To get the full impact you need to watch the whole thing right to the very end, 3:15.
--
.nosig -
Re:Considering how wrong they've been in the past
Andrew, Katrina and Sandy were just ordinary weather
Yes.
http://www1.ncdc.noaa.gov/pub/data/cmb/images/cei/step6.ytd.gif
http://www.aoml.noaa.gov/hrd/Landsea/gw_hurricanes/fig33.jpg
-
Re:Considering how wrong they've been in the past
Andrew, Katrina and Sandy were just ordinary weather
Yes.
http://www1.ncdc.noaa.gov/pub/data/cmb/images/cei/step6.ytd.gif
http://www.aoml.noaa.gov/hrd/Landsea/gw_hurricanes/fig33.jpg
-
Re:How do you model such a complicated system?
It's not global warming that is killing coral reefs. It is ocean acidification.
No. Ocean pH varies an order of magnitude more than the slight change over the last centuries we believe we can measure.
Coral reefs bleaching due to cold water:
http://oceanservice.noaa.gov/news/weeklynews/mar10/cwcoral.htmlCoral reefs bleaching due to warm water:
http://usatoday30.usatoday.com/tech/science/2005-11-02-coral-caribbean_x.htm -
Re:statement pulled from ass?
The article makes the astounding claim that this animal "hasn't evolved for 300 million years". Sounds like hogwash to me, but is there any indication that this is true?
Sure, fossil records. Let's go with NOAA since they're fairly well respected:
Hagfish is considered to be the most primitive vertebrate species either living or extinct (Collette and Klein-MacPhee 2002, Powell et al 2005). Hagfish evolved over at least 300 million years and have the same basic morphological traits of fossilized specimens (Bardack 1991).
And, then there's Berkeley:
The only fossil hagfish is Myxinikela siroka, a Pennsylvanian find from the Francis Creek Shale of northeastern Illinois (Bardack, 1991). The fossil was found within a siderite (iron carbonate) concretion, and preserves the paired tentacles, internal organs, and detail of the head and jaws. The similarity to modern hagfishes is striking, and suggests that there has been little evolutionary change in this group over the last 300 million years.
So, yes, is there is strong evidence that the morphology of hagfish hasn't changed in 300 million years. That's not to say there has been zero changes to it, but nothing radical.
If you can compare a modern specimen to a 300 million year old fossil and fine no differences, you pretty much conclude that it hasn't significantly evolved. Think coelacanth. Think crocodilians. Think MPAA.
-
Re:This shouldn't be on Idle
Actually, it is being done, and is being enforced.
Problem is, often the cost of fines and such are lower than the potential profits.
-
Re:Oh noes! 11 mm in 20 years!
Over the full 20 years dummy. 20 years is short, 10 years is stupid.
You're claiming that ten years worth of sea level data can't show a trend? You're the stupid one.
Whether the trend will continue for the next 10 or more years is certainly a question, but no one can say for sure at the moment.
I guess you're unaware that temperatures have in fact not climbed statistically significantly since 1998.
You just don't learn, do you? 1998 was a local maxima, so in 2009, you thought could say "the last 10 years data shows cooling." But now of course you can't say that, because the last 10 years data doesn't start on a local maxima. The last 10 years data doesn't show cooling at all, but rising.*
Actually, you're wrong again. What a surprise.
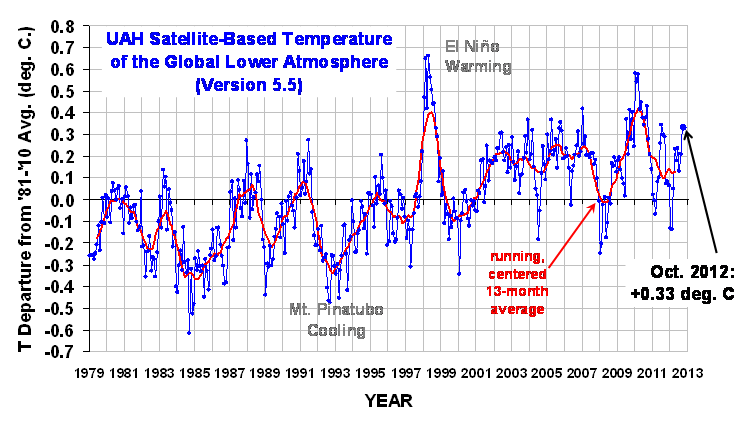
If you look at the UAH satellite temperature data, the running average in 2002 was at 0.2 C above the baseline. As of Oct. 2012, it is running about 0.12 C above the baseline. No statistically significant warming - in fact there's been cooling. (Also FYI, in 1998 the running average hit 0.4 C above the baseline.)
Link to UAH temperature chart.
So now you want to cherry pick the last 12/13 years, again starting with the local maxima of 1998. Which shows you blatantly to be cherry picking. 12/13 years? What kind of period is that to choose?
Even NOAA admits that a 15 year pause in warming represents major problems for the climate modelers:
The simulations rule out (at the 95% level) zero trends for intervals of 15 yr or more, suggesting that an observed absence of warming of this duration is needed to create a discrepancy with the expected present-day warming rate.
Source: NOAA State of the Climate 2008.
We are right at the threshold of such a fifteen year period now. As I pointed out previously, the Sun is unlikely to play along with the climate alarmists. It will certainly be devastating to them if we get any kind of cooling trend over the next 20-40 years, as I expect we will.
You're a cherry picking fraud and you just helped me to made it obvious to everyone. Thanks for playing.
(*Of course no one with shred of integrity would be trying to use 10 years, when for climate trends you need more like 30 years to start to lose the year to year noise. Hence my point about your stupid splitting of a 20 year graph of ocean levels into 2 10 year trends.)
It's interesting how the warmist alarmists are descending to name calling. It's a sign of desperation.
The beauty of this situation is we'll know soon enough who was right...just a few more years to go. Be patient, and prepared to eat a huge helping of crow.
In the meantime, let's reflect on the actual realities of CO2 concentration. What do you think the peak value will be? It seems to me that it's virtually impossible to get to the point where humanity as a whole is carbon-neutral before 2050, and even that date is very unlikely. China is currently building two large coal electric plants every week. My guess for peak CO2 concentration is between 500-600 PPM, up from the current ~400 PPM. So, you'd better hope I'm right and you're wrong.
Regardless of my thinking on the matter, I'm willing to meet you alarmists halfway. I would welcome a push for a massive buildout of next-generation nuclear for a number of reasons. That, combined with next-generation solar, could make a major difference in CO2 concentration going forward. It seems clear we're going to need a lot of high-density energy generation for the geoengineering necessary if AGW alarmism is in fact correct.
Sadly, despite the demonstrat
-
Re:One consistent theme
Just look at the Great Lakes. They stand at record levels [...] Any questions????
I have a question: from where do you get your information on Great Lakes levels?
-
Re:It's ok.
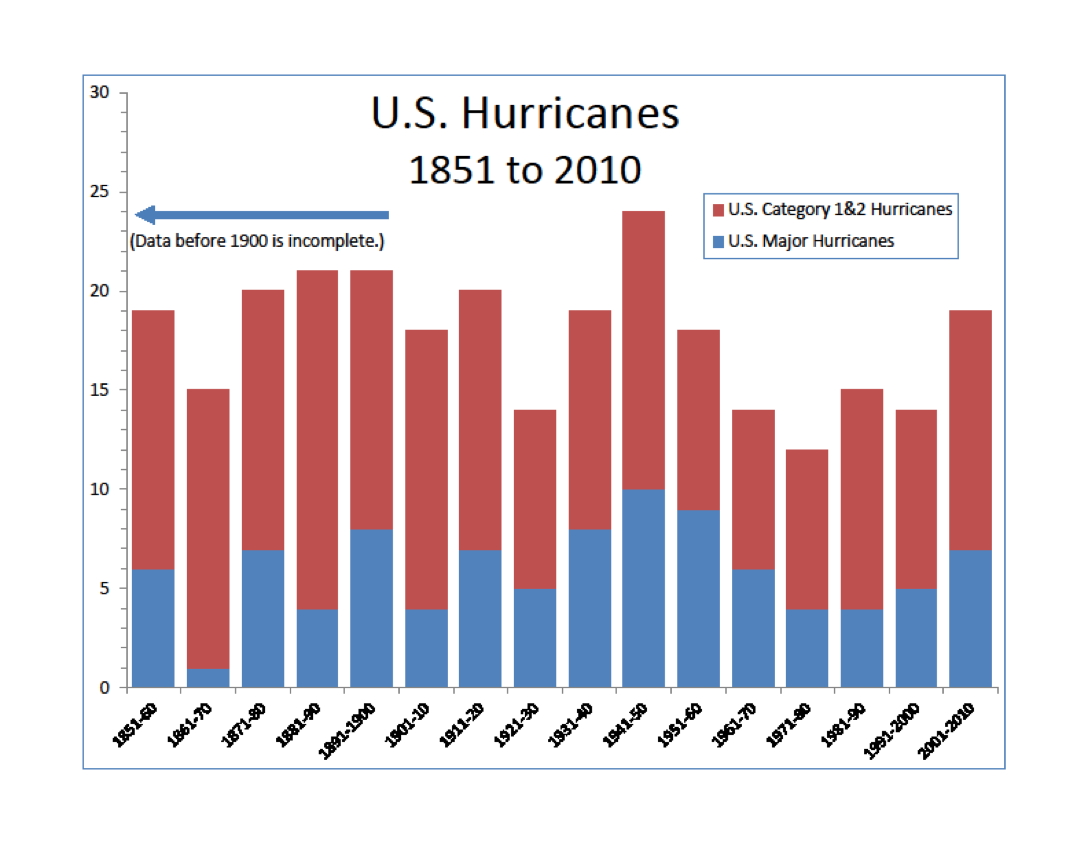
Went to google. Found this: Influence of Atlantic sea temperature on hurricane activity. This was published in the fairly prestigious journal Nature in 2008: here's the paper.
It basically says:
* if hurricane activity depends on absolute temperature of Atlantic ocean, hurricane activity will increase.
* or, if hurricane activity depends on the temperature difference between different basins in the Atlantic, there will not be any increase.
As a physicist, my "common sense" suggests that the second one is more likely; basic thermodynamics tells us that temperature differences are what drive heat transfer.
To sum up, science tells us: We don't know whether AGW will lead to increased hurricane activity. Note also the green dots at the right in that figure, which are data points from high-resolution forecasting models. (I'm very fond of models, seeing as my dayjob is to make them.) -
Re:It's ok.
Went to google. Found this: Influence of Atlantic sea temperature on hurricane activity. This was published in the fairly prestigious journal Nature in 2008: here's the paper.
It basically says:
* if hurricane activity depends on absolute temperature of Atlantic ocean, hurricane activity will increase.
* or, if hurricane activity depends on the temperature difference between different basins in the Atlantic, there will not be any increase.
As a physicist, my "common sense" suggests that the second one is more likely; basic thermodynamics tells us that temperature differences are what drive heat transfer.
To sum up, science tells us: We don't know whether AGW will lead to increased hurricane activity. Note also the green dots at the right in that figure, which are data points from high-resolution forecasting models. (I'm very fond of models, seeing as my dayjob is to make them.) -
Re:Regret
You are only considering surface temperature. The assumption was not bizarre at all:
http://oceanservice.noaa.gov/facts/oceanfreeze.htmlNOAA says the average oceanic water temperature is 3.5C. However, it also says that salt water gets more and more dense as it get colder...unlike fresh water from 0C to 4C. So I found my answer indirectly.
-
Re:No significant change for a century.
recent data doesn't show any increase in rate of sea level rise:
http://sealevel.colorado.edu/Not sure what you're looking at there; that graph clearly shows the current rate is about twice what it was a hundred years ago. Fortunately we don't have to rely on our eyes, Church and White most recently calculated an acceleration of 0.009 mm/yr^2 over that period -- that's actually a downgrade from 0.013 mm/yr^2 in their 2006 paper. Ever done data analysis before? Trying to figure out the second derivative of noisy data is not an easy thing.
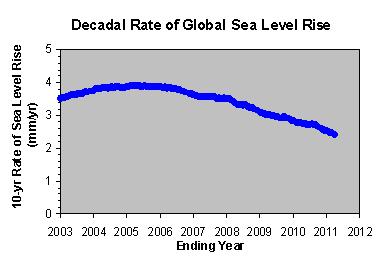
looking at the decadal rate of increase it has actually been falling off for last 5 years:
http://www.masterresource.org/wp-content/uploads/2011/09/sea_level_rise_fig1.jpgThat's a nice unattributed JPEG hosted at "Master Resource", a "free-market energy blog" with categories on Austrian economics, Ayn Rand, and objectivism. Fortunately I don't need to leave my criticisms at questioning the source of the material. If you look at your first link, you can see that the rate really did decline towards the beginning of 2011 where this 2nd chart stops before suddenly surging up again to match the preceding trends: so the trend over 2011 and 2012 is actually much higher than it was the preceding few years.
This is cherry-picked data -- it is very easy in any system containing noise to pick endpoints to make it appear that the overall trends have stopped. A great depiction of this is the escalator graph: How "Skeptics" View Global Warming. You need to look at the big picture -- every climate graph shorter than a decade is lying, because a decade is not long enough to show long-term climate trends. It is very easy to pick subdecadal trends that either exaggerate or mask longterm trends, so you need to look at the big picture.
A rather big factor that needs to be taken into account is that since the 1950's there has been a massive amount of ground water abstraction for agriculture that is estimated to contribute something like 0.4-0.8mm/year to sea level rise (15-25% of total).http://news.nationalgeographic.co.uk/news/2012/05/120531-groundwater-depletion-may-accelerate-sea-level-rise/
This is counter-acted by the amount of water that humans are storing in reservoirs, which account for 0.55mm/year: Impact of Artificial Reservoir Water Impoundment on Global Sea Level.
-
IPCC politics
You have got to admire the objectivity of Slashdot readers. I posted an article with a reference to the NOAA site that has global sea-level data online, for all to see. This data contradicts TFA (which is primarily a political report). Slashdot did not disappoint - within a couple of minutes, my comment was moderated into nonexistence..
Here's a second chance: go look at the actual, raw data. Lots of stations have data for nearly a century. None of them show the kind of recent change in trend that the article claims.
-
Nonsense!
There are sea level gauges all over the world, some of them with more than a century of data. None of them show the trend this paper claims. Have a look at this site. Here are the first three examples I tried:
- Select Florida, select Mayport: Data back to 1930, sea level rising about 25cm/century, no visible change in trend.
- Select Global stations, Under PSMSL data select Narvik, Norway, tell me you want to panic.
- Scroll down in the PSMSL data until you get to India, select Cochin, India. Trending upwards at about 20cm/century.
Play around with this site. Look at the data. The sea level has been rising at roughly the same level for centuries. Look at the evidence: There is zero believable evidence that sea level rise is accelerating. The IPCC doesn't do science, it does politics.
-
Re:Thinking of the audience
>But they have no relevance to any of the readers.
Bullshit.
Not everyone is in a land-locked state, and when referring to marine events such as this, it only makes sense to use marine terms.
More than 50 percent live within an hour's drive of the coast.
http://oceanservice.noaa.gov/facts/population.html
--
BMO -
Re:Pumice?
Pumice seems most plausible.
We obtained worldwide elevation data from NOAA, for our BattleCell land conquest game. (a super-evolved version of Risk) Game coordinates for Sandy Island are: -1911,15956
Sure enough, the NOAA data shows an elevation of 1 meter, for the entire Sandy Point island.
Possibly, the island was a dynamically generated object, based on the original NOAA elevation data. What else, besides pumice could generate such readings? -
Re:Mauna Loa ??
You're right, the Mauna Loa CO2 record is localised and only goes back 50 years.
Here's a great animation from NOAA showing global CO2 distribution and putting recent changes in the context of the last million years or so. It takes a few minutes to watch, but it's worth seeing to the end, in my opinion.
-
Re:Record CO2 happens every year...
You're right, the Mauna Loa CO2 record only goes back 50 years.
Here's a great animation from NOAA showing global CO2 distribution and putting recent changes in the context of the last million years or so. It takes a few minutes to watch, but it's worth seeing to the end, in my opinion.
-
Re:Banksters in on the scam now
Name one that has come true, if you can.
"The world will get warmer."
Proof: Domingues 2008, Nuccitelli 2012, NASA GISS, NOAA NCDC, Hadley Centre, and BEST 2011 (preliminary).
-
Re:Cause?
Global atmospheric CO2 levels are highly cyclic, and have been above the current level many many times before
Not according to this: http://www.esrl.noaa.gov/gmd/ccgg/trends/history.html. (You need to watch all 3 minutes of it to get the point. It's rather dramatic.)
--
.nosig -
Re:"Global" temperature has not changed in 15 year
References or sources?? Looking at the NOAA reports, there is certainly continuing increase past the year 2000. For example: http://www.ncdc.noaa.gov/sotc/service/global/glob/201201-201209.gif and http://www.ncdc.noaa.gov/sotc/service/global/lo-hem/201201-201209.gif from: http://www.ncdc.noaa.gov/sotc/global/2012/9.
-
Re:"Global" temperature has not changed in 15 year
Not true; the NOAA says global average temperature is rising: http://www.ncdc.noaa.gov/indicators/
-
Re:Could we hear some Germans tell this story?
2011 Heat Related Fatalities
-
Re:But, But....what about all those in the 1950's
If you want to see what it is in the longer term it's all there in the data products. It's got to be a pretty simple calculation with at best maybe 100 data points.
-
Re:American concept of pricing?
Maybe for their next model Fisker will take a few design tips from this electric vehicle
-
Re:But, But....what about all those in the 1950'sAgain, you don't seem to be getting it. There's no official definition of "long-term" in climatology or in CPC work. From the IPCC link:
Climate in a narrow sense is usually defined as the "average weather", or more rigorously, as the statistical description in terms of the mean and variability of relevant quantities over a period of time ranging from months to thousands or millions of years. The classical period is 30 years, as defined by the World Meteorological Organization (WMO).
So no standard time scale from the IPCC. And the "M" in WMO is for meteorology, the study of weather not climate.
But let's go on and ask ourselves, what does the CPC think is "long-term" since that is the crux of the matter. Turns out they think all sorts of time frames are long term (for example, one to five year periods in this graph).
Frankly, it wouldn't have been that hard to consider hurricane records as far back as they were reliable. That's somewhere before 1951 and truly "long-term" in the sense of the word. -
Re:But, But....what about all those in the 1950's
Climate - The average of weather over at least a 30-year period. Note that the climate taken over different periods of time (30 years, 1000 years) may be different. The old saying is climate is what we expect and weather is what we get.
http://www.cpc.ncep.noaa.gov/products/outreach/glossary.shtml#C
In the 1980's the National Weather Service established the Climate Prediction Center (CPC), known at the time as the Climate Analysis Center (CAC). The CPC is best known for its United States climate forecasts based on El Nino and La Nina conditions in the tropical Pacific.
The CPC most definitely does do climate science. Any round numbers that end in zero are popular. There are sets for every previous 30-year period ending in zero, such as 1971-2000 as you point out. They also do rolling sets, such as the current year + the 29-years prior.
The info talked about in this discussion was part of the most recent 30-year set released by the CPC -- 1981-2010. Thus bringing up 1951 and claiming relevance was incorrect in this context.
Also, the IPCC uses the 30-year mark for definition as well.
The classical period is 30 years, as defined by the World Meteorological Organization (WMO).
http://www.ipcc.ch/ipccreports/tar/wg1/518.htm
In short, I'm right and yes, just about everyone in that professional area of study uses 30-year periods as a basis for defining "climate".
-
Re:But, But....what about all those in the 1950's
What probably *hasn't* been pointed out to you is that climate science uses 30-year averages as their basis for "long term" and to differentiate weather vs climate.
Utter garbage. If you're going to make up shit, could you at least make up something plausible? Googling around, the error seems to come from NOAA data products (which cover 30 year time spans) that are updated every ten years. For your information, the NOAA is not climate science, but a government bureaucracy that happens to find a 30 year period useful not because it considers 30 years "long term".
1981-2010 is the latest complete 30-year set. 1951-1980 would be the prior 30-year set, thus is not relevant to what they are reporting on.
The previous NOAA set was 1971-2000.
-
Re:Huge problem in Texas - flash floods on the roa
I'm from Texas, where the OP mentioned the flash floods. I've also been in regular floods. Regular floods are like the Mississippi rising 2" per hour for 24 hours. Flash floods are http://www.srh.noaa.gov/mrx/hydro/flooddef.php floods under 6 hours. So, not just the tsunami-wave style, but rains that bring a 5 hour "regular" flood is still a flash flood. Ever go camping in a flash flood area? I have. You set up camp on a ridge. The flash flood could kill you in your sleep, it's happened before.
Texas leads in deaths at train crossings and flash floods. They are the same. It's usually a case of someone doing something extraordinarily stupid (crossing in front of a train, crossing a flooded road and being swept off the road). -
Re:You don't know what "Hide the Decline" means
So calling out your smug ignorance and broken logic is 'ranting' apparently. http://www.ncdc.noaa.gov/paleo/pubs/moberg2005/moberg2005.html
-
Re:Kahn
>Too bad they don't name hurricanes after men - like Kahn.
What?
Hurricanes have had names from both sexes by the National Weather Service since 1978. Only between 1953 and 1978 were female names the only names given to hurricanes.
http://www.nhc.noaa.gov/aboutnames_history.shtml
--
BMO