 Slashdot Mirror
Domain: noaa.gov
Stories and comments across the archive that link to noaa.gov.
Comments · 2,602
-
Re:Oooo, the sky is falling
Funny how you say that they don't understand genetics, yet that is what they do for a living
Microsoft programmers write Windows code for a living. Ergo Windows is stable, reliable and secure. Obvious, isn't it ?
The people who work in biotech industry are smart and understand genetics. But they're being paid to get specific results, not to worry about long term consequences. It's simply not their job. Hopefully you are not asserting that the whole scientific community regards GM organisms are fundamentally harmless and risk-free, are you ?
Don't release your software under the GPL, you don't know the ramifications of doing so.
If GPL code appears in a program, it can be deleted.
If bio-engineered resistance to a given pest/disease/parasite suddenly appears in wild species through cross-fertilisation, and turns this wild species into an invasive plant (like Caulerpa Taxifolia, but on land), and leads the pest/disease/parasite to mutate into a stronger variant...
then what do you do ?
Thomas-
Academic in training -
Re:night map...nasa night map
Actually, to give credit where credit is due, I believe that the map in question was produced by the DMSP, i.e. the Defense Meteorological Satellite Program. Hardly a NASA effort.
-
Re:Warming also tied to orbit changes....
The 41,000 year tilt cycle and the 22,000 year precession cycle are both far too long to be noticed within our lifetime...
http://www.ngdc.noaa.gov/paleo/milankovitch.html -
Re:More on sinks
-
Re:More on sinks
I thought you might like this page. I happened to find it last night when I saw the first mention of the CO2 changes, and I went looking. For the last few years, I have been seeing mention that 1998 was the warmest year on record. This was fine in 1999 -- 1998 was the latest year in which data was available for the full twelve months. Even in 2000, 2001, and 2002, I figured that complete data wasn't analyzed yet. This kind of thing happens in complex analytical environments.
By the end of 2002, and on through this year, I was still hearing how 1998 was the warmest year on record, so I finally went looking in a real effort to find numbers, and I found that site. I ran some of the numbers (the global mean surface temperature [GMST]) in a spreadsheet and put them in a graph, and while there's a definite increase in the last, oh, roughly 30 years, I also see that the average temps jump around -- a lot. The in 1999, GMST decreased by 0.24 degrees C, the largest drop in the time recorded (1880 to present). There was a further decrease of 0.01 degrees the next year, followed an increase of 0.15 degrees and then 0.05 degrees, and then 2003 was flat. If the current trend for 2004 holds, it will be a touch cooler this year. All of the years are very erratic when looked at in terms of the annual changes instead of cumulative changes.
I'll admit, I'm not a climatologist (nor are most of the people here). There are benefits to come from conserving energy and coming up with more efficient means of energy generation (look at the benefits of Los Angeles air in the last 30 years), and they should be encouraged. But with as much as the numbers jump around, I'm not entirely sure that man has as much to do with it as many people think. -
Raw data has no bias
The data provided is probably correct. What one might suspect is bias in favour of a conclusion that will result in increased funding for Mr. Keeling's activities. I have known far too many scholars to not suspect that most of these 'soft' sciences include heavy bias in favour of one side of the issue or the other. If anyone feels like having a quick go at the raw data, it can be found here: ftp://ftp.cmdl.noaa.gov/ccg/co2/GLOBALVIEW/gv/ As you will notice, the variations are rather large, some even to the point that one must suspect an anomaly local in nature. The variations are also seasonally variable. Might this just be part of a larger seasonal variation? Sun spots? Might a scientist secretly have taken up smoking? As it says in the article, the rise is not uniform across the globe, so it might just be local volcanic activity that sets the Mauna Loa meter off. Is this really data we want to use as a basis for banning fossil fuels? And even if the data correctly predicts rising CO2 levels, is the correlation between CO2 levels on Mauna Loa and global temperature reliable? And if it is, will we be able to substantially affect the outcome by using alternate (more expensive) fuels? And even more pertinent: Will China be in on the deal? One billion Chinese who are rapidly reaching the same levels of industrialization as the West might be reluctant to give up higher living standards for that warm, fuzzy feeling that alternate fuels give you. The advantage of this whole scheme would be that we wouldn't have to kill so many brown people when we don't need their oil anymore.
-
Not sustainable?Someone correct my figures if I'm off, but according to my scratch calculations, this isn't theoretically sustainable without major advances in engine efficiency. Given 3.3 kWh/m^2 (which is average solar radiation in Seattle, according to here), and assuming your average car is about 5m x 2m (rough numbers, recall), it looks like you've got 49.5 kWh to play with.
Then, given 125,ooo BTU/gallon of gasoline, and around 3400 BTU/kWh (from here), you're looking at 37 kWh/gallon of gasoline. No current gasoline-engine car I know of burns less than 1.3 gallons per hour under any normal driving conditions.
Now, obviously, Seattle is the worst-case location in the continental US, but even in the best location (AZ, at 5.7 kWh/m^2), you've got to have a car which burns less than 2.3 gallons per hour. The more fuel-efficient of modern cars hit this pretty well, but I don't think the average is near that.
Or am I making some gross, embarassing error in my figuring?
-
Re:Think about the big picture!
That link points to a image that (I think) was made in the 70's. The next pageshows a more advanced image taken within the last ten years. In most cases WiMax will be added to cell phone towers, and I bet that the service will be an add on to wireless phone service.
-
Re:Think about the big picture!
Unless the range was hundreds of miles you would only end up with thousands of small independent networks.
Here is where people actually live:
http://dmsp.ngdc.noaa.gov/pres/low_light_120701/ht ml/page3.html
Nowhere near dense enough to have a single coherent network. -
Hm. A lot of denial around here. . .How long after The Phantom Menace came out were some fanboys in denial about the fact that it sucked?
Denial of unpleasant truths seems to be a big part of living in Western culture.
Every fifth post through this whole thread is, "The Sky is NOT falling!" and "There is NO link between global warming and strange weather!" Essentially, "NOTHING IS ABNORMAL! LA LA LA! I CAN'T HEAR YOU!"
Ahem. .
First Ever South Atlantic Hurricane Hits Brazil. (March of 2004)
South American Glaciers Melting Faster, Changing Sea Level.
Alaskan Glaciers Melting Faster.
desertification in Africa.
Heck, even the rest of the solar system is acting funny. Remember the. .
Blue Band on Jupiter this past March of 2004?
and
the Huge X-class solar flares of last year?
Interestingly, the evidence of past hurricanes categorized by decade suggests that there have been big hurricanes to make US landfall before. Indeed, the worst decade, from 1950-1959 saw a total of nine storms between category 3 and 4, (though none of category 5) during that ten year period. Sure. But we've just had four in just one summer. Nobody can say that this is par for any course.
Now, I am not claiming that this has anything to do with global warming. But anybody who tells me that everything is normal probably swore up and down that The Phantom Menace was a good film for a whole year after it came out.
-FL -
Why don't you believe the scientists?
Considering that we didn't start measuring the biggest hole, over Antartica, until 1970, that's a huge jump to say that we know for certain the hole was man-made.
Measuring the entire hole requires satellite scanners, which of course we didn't have until the launch of Nimbus 4. But the measurements of Antarctic ozone go back to 1956, and measurements of ozone over the Northern hemisphere go back much further; the discovery of the ozone layer was around 1880, and the measurements of atmospheric ozone go back to the 1920's. We know something has changed since then, even if we can't completely quantify it because historical data isn't as extensive as we have today. Denying it is only possible if you are ignorant or dishonest.We also have excellent models for the mechanisms of ozone destruction, including laboratory verification of catalysis on the surfaces of droplets and ice crystals. If you don't think that this meets the burden of proof beyond a reasonable doubt, let alone a preponderance of the evidence, is there anything that could possibly convince you? Anything?
I accept something as a fact when the evidence in its favor is such that it is unreasonable not to. Ozone depletion is one of those things.
I suggest you read this page first.
He's written similar screeds before. But consider his qualifications to make such claims. Look at his bio; he's an engineer, not a researcher. He writes to persuade and entertain, not for peer-reviewed publication.He may even write to mislead. Looking at that page, I notice a hugely incorrect graph about halfway down. It's titled "Atmospheric sources of chlorine", which is misleading for two reasons:
- What gets into the atmosphere is irrelevant; what matters is what gets to the stratosphere.
- Most of those sources emit chloride, not CFCs or even elemental chlorine.
Don't believe me? Here's the graph of CFC-11 concentration, (see the bottom of the page) and this page (tables 4, 5 and 6) details the reasons why the statements made by Hogan are wrong.
But hey, if you want to follow an ozone-depletion denialist or a platygean I can't stop you. But I will point at you and laugh at every opportunity.
-
The statistical data says "BS"
... As far as the quantity of hurricanes go. Have a look for yourself at NOAA and count them. I did, and here's what I found.
From the year 1901-1940, approximately 1.9 hurricanes made landfall per year during that time.
Have the industrial boom and SUVs doomed us to an ever-increasing number of hurricanes? From the year 1950-2003, there have been, on average, a total of only 1.7 hurricanes that have made landfall per year. That's right, that's less! Go ahead and count them yourself. The theories may be spelling doom, but reality tells a different tale, as it often does.
So we get slammed with 3 in a row and all of a sudden it's the end of the world, and we can blame it all on Chevrolet (or George Bush, if you're so inclined)? Whatever. Three, although slightly above average, is hardly out of the ordinary. What is out of the ordinary is that they all happened to hit roughly the same area. Bad luck? You bet. Global warming? No way.
-
Pork! Re:See, there's a problem here.
http://www.gfdl.noaa.gov/~tk/ Thomas R. Knutson is from the government and he's here to
help you while he helps himself to some more pork.
http://www.okpork.org/
-
Re:Nature's way...It describes what could happen were CO2 concentrations in the atmosphere to increase by 1% annually. I don't know whether this is actually the current trend.
CO2 concent rations in the atmosphere have increased by about 30 percent in the last 50 years, with most of the increase happening in the last few decades.
The actual growth of CO2 varies from year to year, but has averaged about 0.5% per year for the last 15 years, with about 0.9% per year rates in the last four years (but these are probably related to El Nino cycles).
China's rapid industrialization (fuelled mostly by coal---the fuel richest in carbon emissions) threatens to accelerate this growth rate for the next several decades, so 1% annual growth is quite a reasonable estimate.
-
Ozone measurements began in the 1920s -- see here
Pick a database and location. Look at measured ozone level over Antarctica and you can see the "hole" (200 units was normal, before 1980s when the 'hole' clearly shows up and has since persisted). This isn't rocket science, this is geophysics. Destructive testing is ill-advised.
http://www.cmdl.noaa.gov/ozwv/dobson/
"... archived data, papers, and information pertaining to the total ozone project. The Dobson Ozone Spectrophotometer has been used to study total ozone since its development in the 1920's. The observations of total ozone, the total amount of ozone in a column from the surface to the edge of the atmosphere, by this instrument is one of the longest geophysical measurements series in existence.
Graphs of current O3 values from our stations. (Includes preliminary data.)
Archives currently containing selected daily O3 observations for 1962 through December 2003. You may need the key to the data format in this archive... -
Re:Weather is complicated
"Increasing the overall thermal energy of the planet can only make them more probable. "
Not exactly. Hurricanes are fueled by convection so they need warm ocean surface temperatures and considerably cooler temperatures aloft. Warmer temperatures aloft don't support convection as well and will either lead to weaker or fewer storms. Also, during years of El Nino warm conditions in the Pacific, the upper level wind shear is less favorable for hurricane formation. All this shows is that weather is much more complicated than just "more thermal energy = more hurricanes".
Check out this faq for tons of info on hurricanes and tropical cyclone prediction. -
Caution in data interpretation
I would not be surprised by global warming increasing the incidence of extreme weather, but hopefully, non-scientists (e.g., journalists and ordinary people) commenting on future weather patterns in the tropics will keep in mind that this region, like any other, goes through cycles. In particular, hurricane activity is believed to have a cycle of its own. Therefore, for the conclusions of this study to be supported, hurricane activity in the near future should be even worse than it was from 1926 to 1970.
-
Problem is decades awayIt is not correct to link this year's hurricane season with global warming. Any possible current effect of global warming on hurricanes is too small to detect. Any measurable effect of global warming on hurricanes is decades away. From the study:
CO2-induced tropical cyclone intensity changes are unlikely to be detectable in historical observations and will probably not be detectable for decades to come. Related to this issue, SSTs ( sea surface temperature) over the North Atlantic tropical storm basin have not exhibited a significant warming trend over the past half century.
Four hurricanes hitting a single state in a year is unusual, but it has happened before. -
Re:I AM more likely to be struck by lightning
In fact the odds of being struck by lightning in your lifetime are 1/3000.
Not sure what the odds are for getting 0wn3d... -
Re:I AM more likely to be struck by lightningI probably AM more likely to be struck by lighting than hit by malicious code.
I wouldn't be so sure about that. This report says that the US has lightning injuries+fatalities of around 500 per year. That means the average person gets hit by lightning about once every 600,000 years.
The odds that somebody is going to develop a blockbuster zero-day exploit are much higher than that. For example, what if some person or organization discovers something like new flaws in both Cisco routers and the standard JPEG rendering
Most of the computers on the Internet could be compromised within minutes just by ordinary browsing. No amount of patching, firewalls or care on the part of the user would prevent the attack. That is just one scenario; it's not hard to think up countless variations. It may be unlikely that this will happen in any given year, but I doubt that it would be as rare as once every 600K years.
-
Geostationary Satellite Server
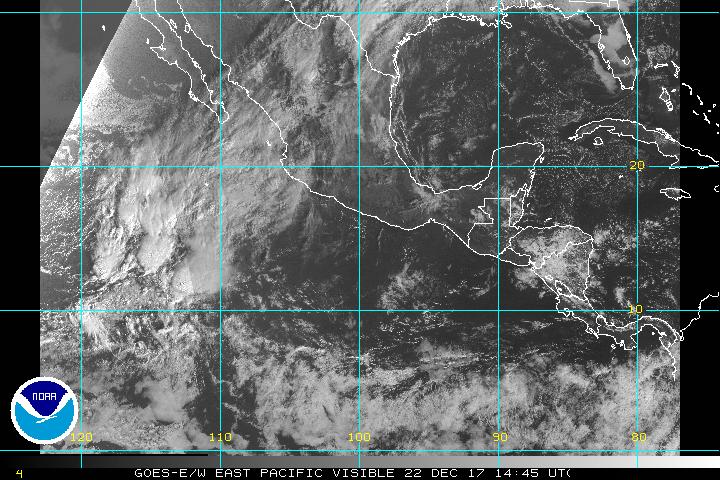
I've been watching the weather and all sorts of neat stuff on the NOAA GEOS site for years. Not great for spying on your city, but great animations for tracking weather and hurricanes
-
Hurricane
Well, for now there are no more hurricanes, but maybe we can save this bomb up for the next big one and see if it's really true that a nuclear bomb won't affect a hurricane.
-
Re:Maybe
I meant to through this link in there as well:
Jeanne Wind Speed Forecast - by the time it gets near florida it will most likely have 100mph+ winds. -
Re:Maybe
although it's a joke, it's kind of an interesting point.
Late last week there were still some people who hadn't had their power restored from the previous hurricane. With all the damage that has been caused (with more possibly on the way - here comes Hurricane Jeanne) there will still be many buildings that need to be repaired well into November. Who knows what the state of repair will be for the election infrastructure at that point?
-
Re:decrease?No, silly, spam is situated in California... The porn sites people sign up for are situated in Florida... Porn spam is down, overall spam is not.
Well, hurricane Javier is somewhat near Cali right now. Maybe it'll take a fortunate turn northward?
-
Re:storm tracking doesnt prevent storms huge impac
What we should be concentrating on is technology to remove a storm from existance as soon as it begins to form.
I was wondering how long it would be until somebody suggested this.
Aside from the fact that we'd be incredibly stupid to even try, we just couldn't even begin to have a significant impact on these storms. It's hard to believe how much energy they contain.
More info from NOAA:
http://www.aoml.noaa.gov/hrd/tcfaq/C5c.html -
Re:the 3 days it takes?
Actually, the day 5 forecasts have an average error of about 325 nm...much less than 800. Prior to 1998, there weren't any 5 day hurricane forecasts, so this is a dramatic improvement. NHC now does 5-day forecasts with similar accuracy to the 3-day forecasts from 10 years ago.
When a tropical system is moving very slowly, it is prone to wobble a bit, so on a time scale as short as 1 hour, there will be a considerable spread in possible movements.
The forecasts for Frances were in fact EXTREMELY accurate. You can view a loop of NHC's forecast images here. If you do you will see that Frances made landfall almost exactly where the 3-day forecast said it would. -
Relevant links from weather geek bookmarks
You can see the current predictions by each model at any given time here:
http://www.weatherunderground.com/tropical/trackin g/at200406_model.html
The NHC discussion of the model guidance for each storm is here, under 'discussion' for each storm:
http://www.nhc.noaa.gov/
They explain why they're agreeing with or discounting each model in their overall forecasts.
Generally, it's difficult to find much prediction of hurricane tracks that doesn't come somehow from the NHC. This isn't because there aren't independent analysists, but because they try not to send mixed signals, which might lead to people not evacuating when they should. The raw information from the computer models is the closest you get to dissenting opinions, afiak. -
Re:Move to California, of course!at least we don't get hurricanes out here.
Hate to burst your bubble, but there's a Category 5 hurricane (Javier) coming towards us.
Well, it was a Cat 5 last night anyways. It's slowing down now. Still will probably be VERY wet and somewhat windy if/when it gets here.
-
OT: alternatives to weather.com
I used to think Weather.com was the coolest thing since sliced bread. Of course, it took Firefox's popup blocking along with the Adblock extension to make browsing it tolerable.
However, since discovering the following resources, I don't even bother with Weather.com anymore.
http://www.weather.gov/
http://www.nhc.noaa.gov/
http://weather.unisys.com/
These sites offer much more in-depth technical information and are not funded by ad revenue. -
Hurricane Ivan could cause *real* damage
The National Hurricane Center is tracking Hurricane Ivan, which is currently on a path similar to the one that Frances just took. It's projected to be here by this weekend, if it does hit Florida (and if their predictions hold true). NASA has already stated that they won't even have time to put on a "band-aid" fix by then, so if Ivan hits, they've got very serious problems. FYI, I live in Orlando, due west of Kennedy Space Center, and I'm getting rather weary of tropical weather systems.
-
Re:Safe as can be
Hurricanes, by definition, are storms with winds above 74MPH. How many storms of that strength have you seen in Minnesota recently?
-
Somehwat OT, but.The NOAA has some decent photos and images of the storm.
I'd hate to be in Florida right now.
-
Somehwat OT, but.The NOAA has some decent photos and images of the storm.
I'd hate to be in Florida right now.
-
Somehwat OT, but.The NOAA has some decent photos and images of the storm.
I'd hate to be in Florida right now.
-
nuke it!
lets just nuke it!
-
It looks like its veering and weakening as of now.As of now the text advisory is at odds with the imagery.
What I see when I look at the visible imagery loop is the eye moving NW or even NNW rather than WNW and it is has become indistinct as of 2:15UTC.
In any case the text report says the maximum sustained winds are 115knots which is just barely category 4. Sure, it could pick up again and change directions back. They say its course is "wobbling" and that it is expected to lose some strength going over some of the Bahamas but pick up some again over the open ocean.
-
Re:Some data, and "this will write NASA's ticket"
Francis is still a cat 4 hurricane as of the 5pm advisory. If you look at the advisory, it shows 115 MPH sustained winds measured in the EYE on San Salvador. It has weaked slightly, but this could be another eye wall replacement cycle (it only raised from 938 mb to 948 mb). It's a very dangerous storm and quite possibly the largest to hit the US since Andrew. They are still predicting it will be a Cat 4 at landfall and possibly a cat 5. There's still plenty of time for strengthening and conditions are still right for this to happen.
-
Make a REAL difference
I don't know what's worse-- the Geraldo quality news story, or the slashdotter over-reaction. If everyone had waited a few hours (Noon Eastern, to be exact), the updated track forecast would have been out.
Guess what? It's going to track far southwest of the Cape by current estimates, and the local forecast, is only calling for tropical force winds to maybe category 1 hurricane winds at the Cape. Science will be safe. Only families and lives will be destroyed in the next few days. Comforting, huh?
The far bigger threat to NASA is the budgetary process in Congress. If every writer in this thread wrote a letter to Congress, rather than worrying out loud about the weather, maybe we could get NASA real resources. In the mean time, send a little support to the Red Cross. -
Hurricane Information from the source...Okay, I'm seeing a few posts about the hurricane that aren't exactly true, so here's where you should probably go if you're also tracking it:
Among other things, as of 1:45 PM EDT the hurricane is still a solid Category 4 with sustained winds of 145 miles per hour (and gusts to more than that), no, they don't know exactly where landfall is going to be, (there's pictures here but the 4-5 day error has been up to 250 miles, and the 2-3 day error has been a tad less), and if you're anywhere within 80 miles of the eye you've got hurricane force winds.
There are disagreements in the meteorlogical community as to whether or not the hurricane will take the Vero Beach Path or recurve north to around Jacksonville or by the Georgia state line.
In any event, the likelihood of a direct hit on Titusville is a long shot, but then again, there's probably a forty to fifty mile length of the coastline that will experience major hurricane strength winds (110 - 120 mph) somewhere, and when you consider there's 350 miles of coastline warned, the odds are quite higher than they would normally be.
-
Re:Hurricane David 1979
Hurricane David was a Catagory 2 hurricane with sustained winds between 96-110 mph. Thats around the range that the area was built to withstand.
Frances is a Catagory 4 hurricane and is currently throwing around winds in the 145-155 mph range. Can you see the concern now? -
Re:Great for GPSGPS works because you can obtain your location based upon the timing signals of a number of FIXED POSITION satellites. Without knowing the locations of the reference points, you cannot determine your location.
This is not correct. My own experience watching my GPS receiver is that the satellites (and their locations) change while I am in a relatively unchanging location. When I move 10-20 miles over a period of hours, the satellite list, and the relative locations plotted on the GPS, change completely. According to NASA, GPS satellite have circular orbit of 20,200 km. A geosynchronous orbit is usually what people mean by "FIXED" and is at 35,786 km. NOAA is responsible for providing GPS ephemerodes and has historical data.
-
Re:Earthquakes, sure...It's built to withstand 3m of water and 220km/h winds. Plus the model is being built in antartica so I think they have the cold down.
Charley was a Cat 4 (145 mph)
Cold isn't just the temperature, but what effect it has on metals under stress. I've found many instances of aluminum becoming more brittle in 10-20 degree F range. Keep in mind any material becomes more brittle at lower temperatures, the question would still remain, is it well enough engineered for extremes?
-
Re:again?
you mean to get a picture like this?
-
Close-up of the U.S.
Here's a more detailed picture of the U.S. for those interested.
-
Re:What about the whole earth?
NM found it here, http://www.ngdc.noaa.gov/mgg/image/2minrelief.htm
l -
There's an interesting presentation...
by the Defense Meteorological Satellite Program called "Low-Light Imaging of the Earth at Night". It can be found at http://dmsp.ngdc.noaa.gov/pres/low_light_120701/i
n dex.html/. -
You have never been to Niagara Falls, have you?
but in the long run the lake will evapourate, making the climate in the region less stable (water holding a lot of heat is one of the main reasons the earth has such a (relatively) mild climate) with hotter summers and colder winters, leading to the requirement of more heating in winter and more air conditioning in summer... brilliant
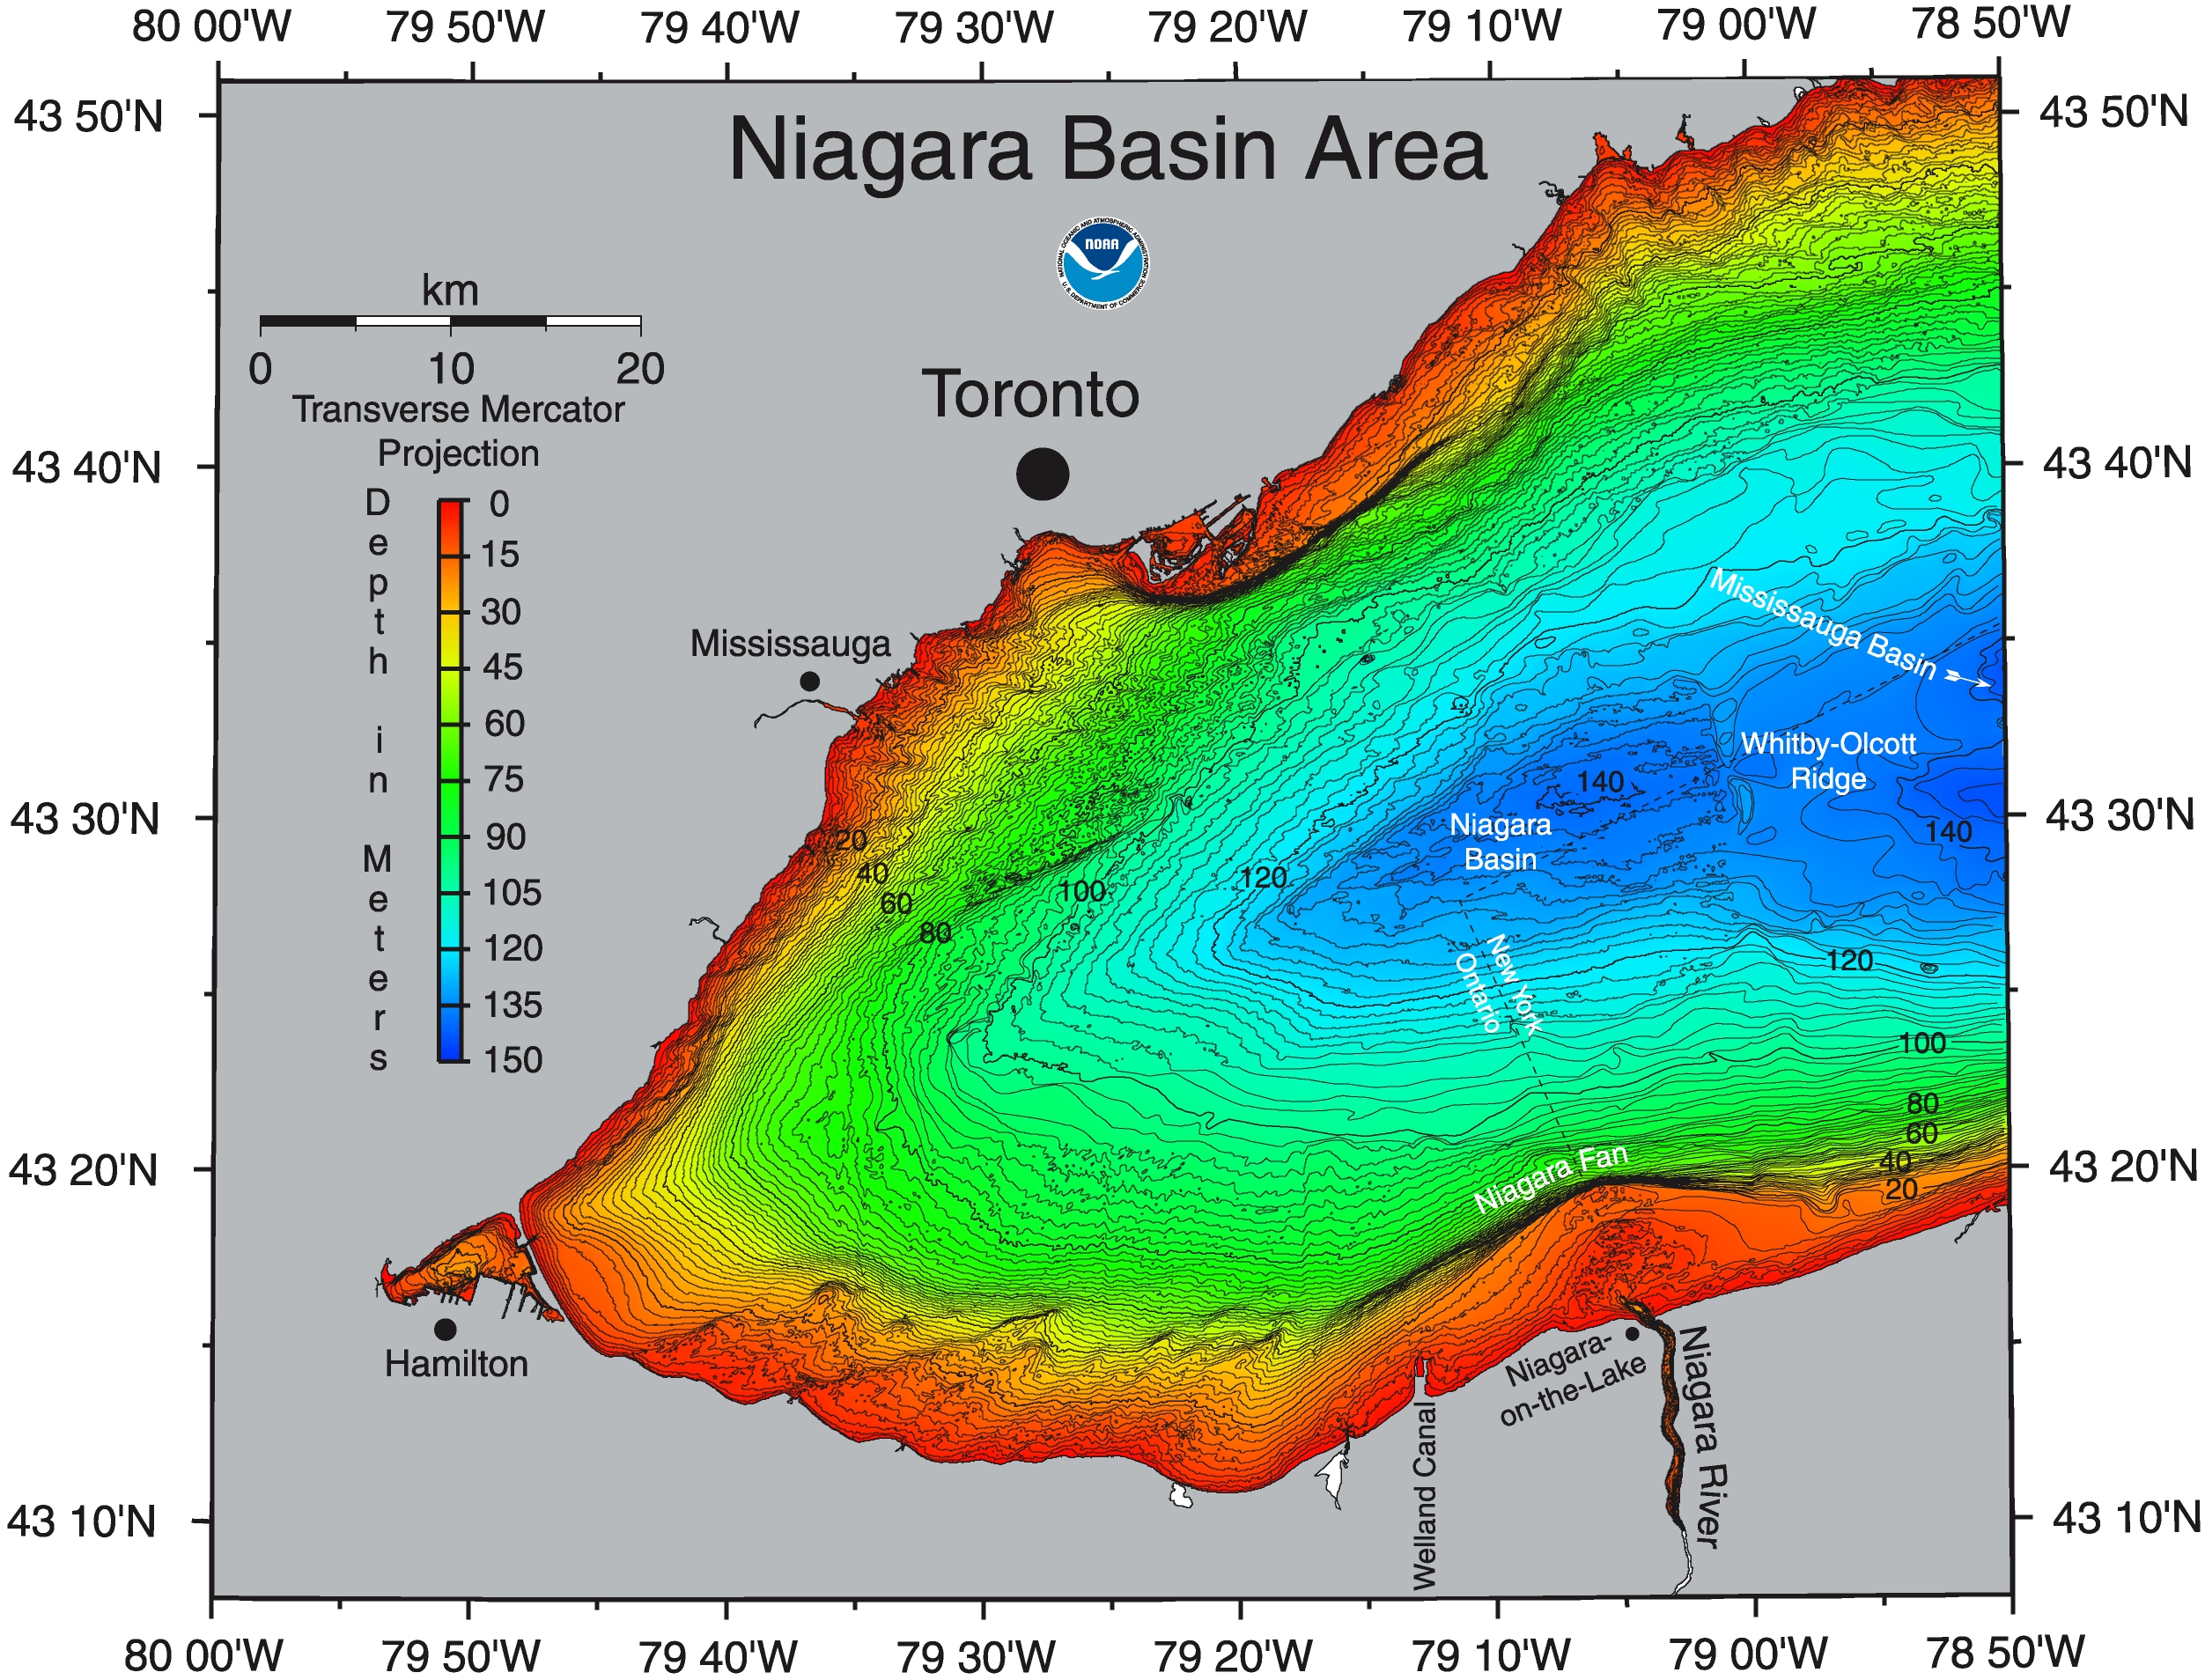
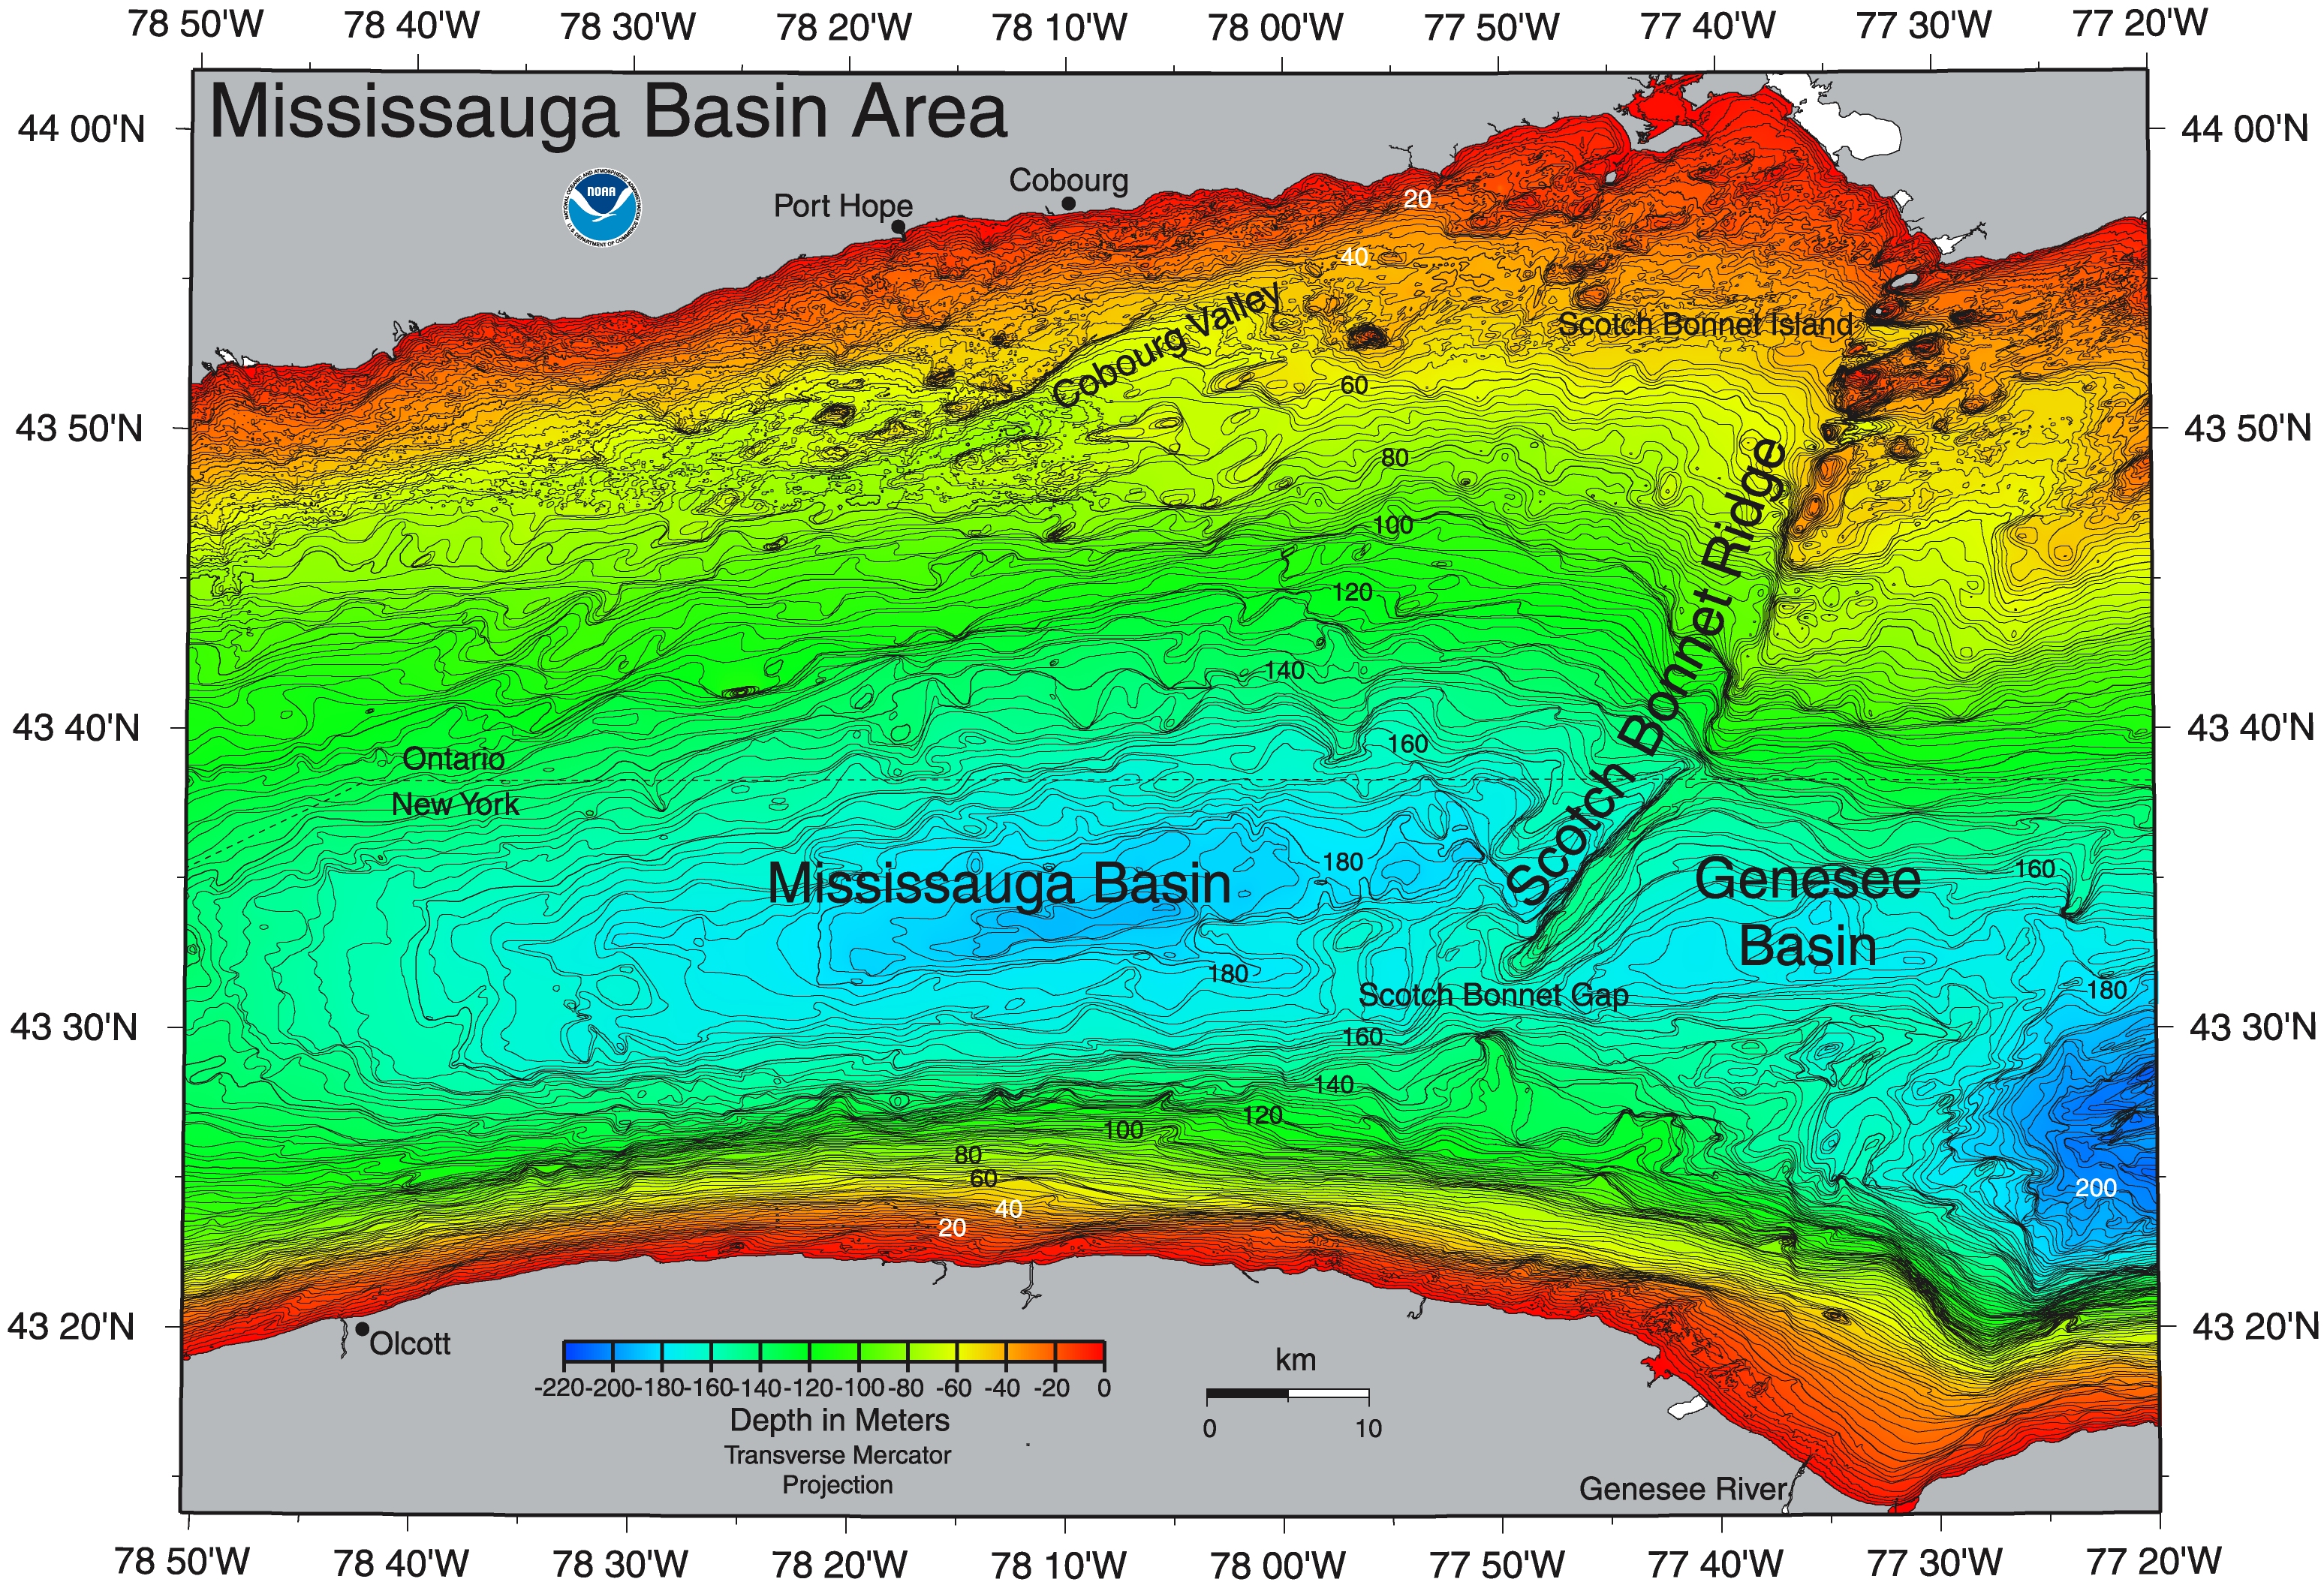
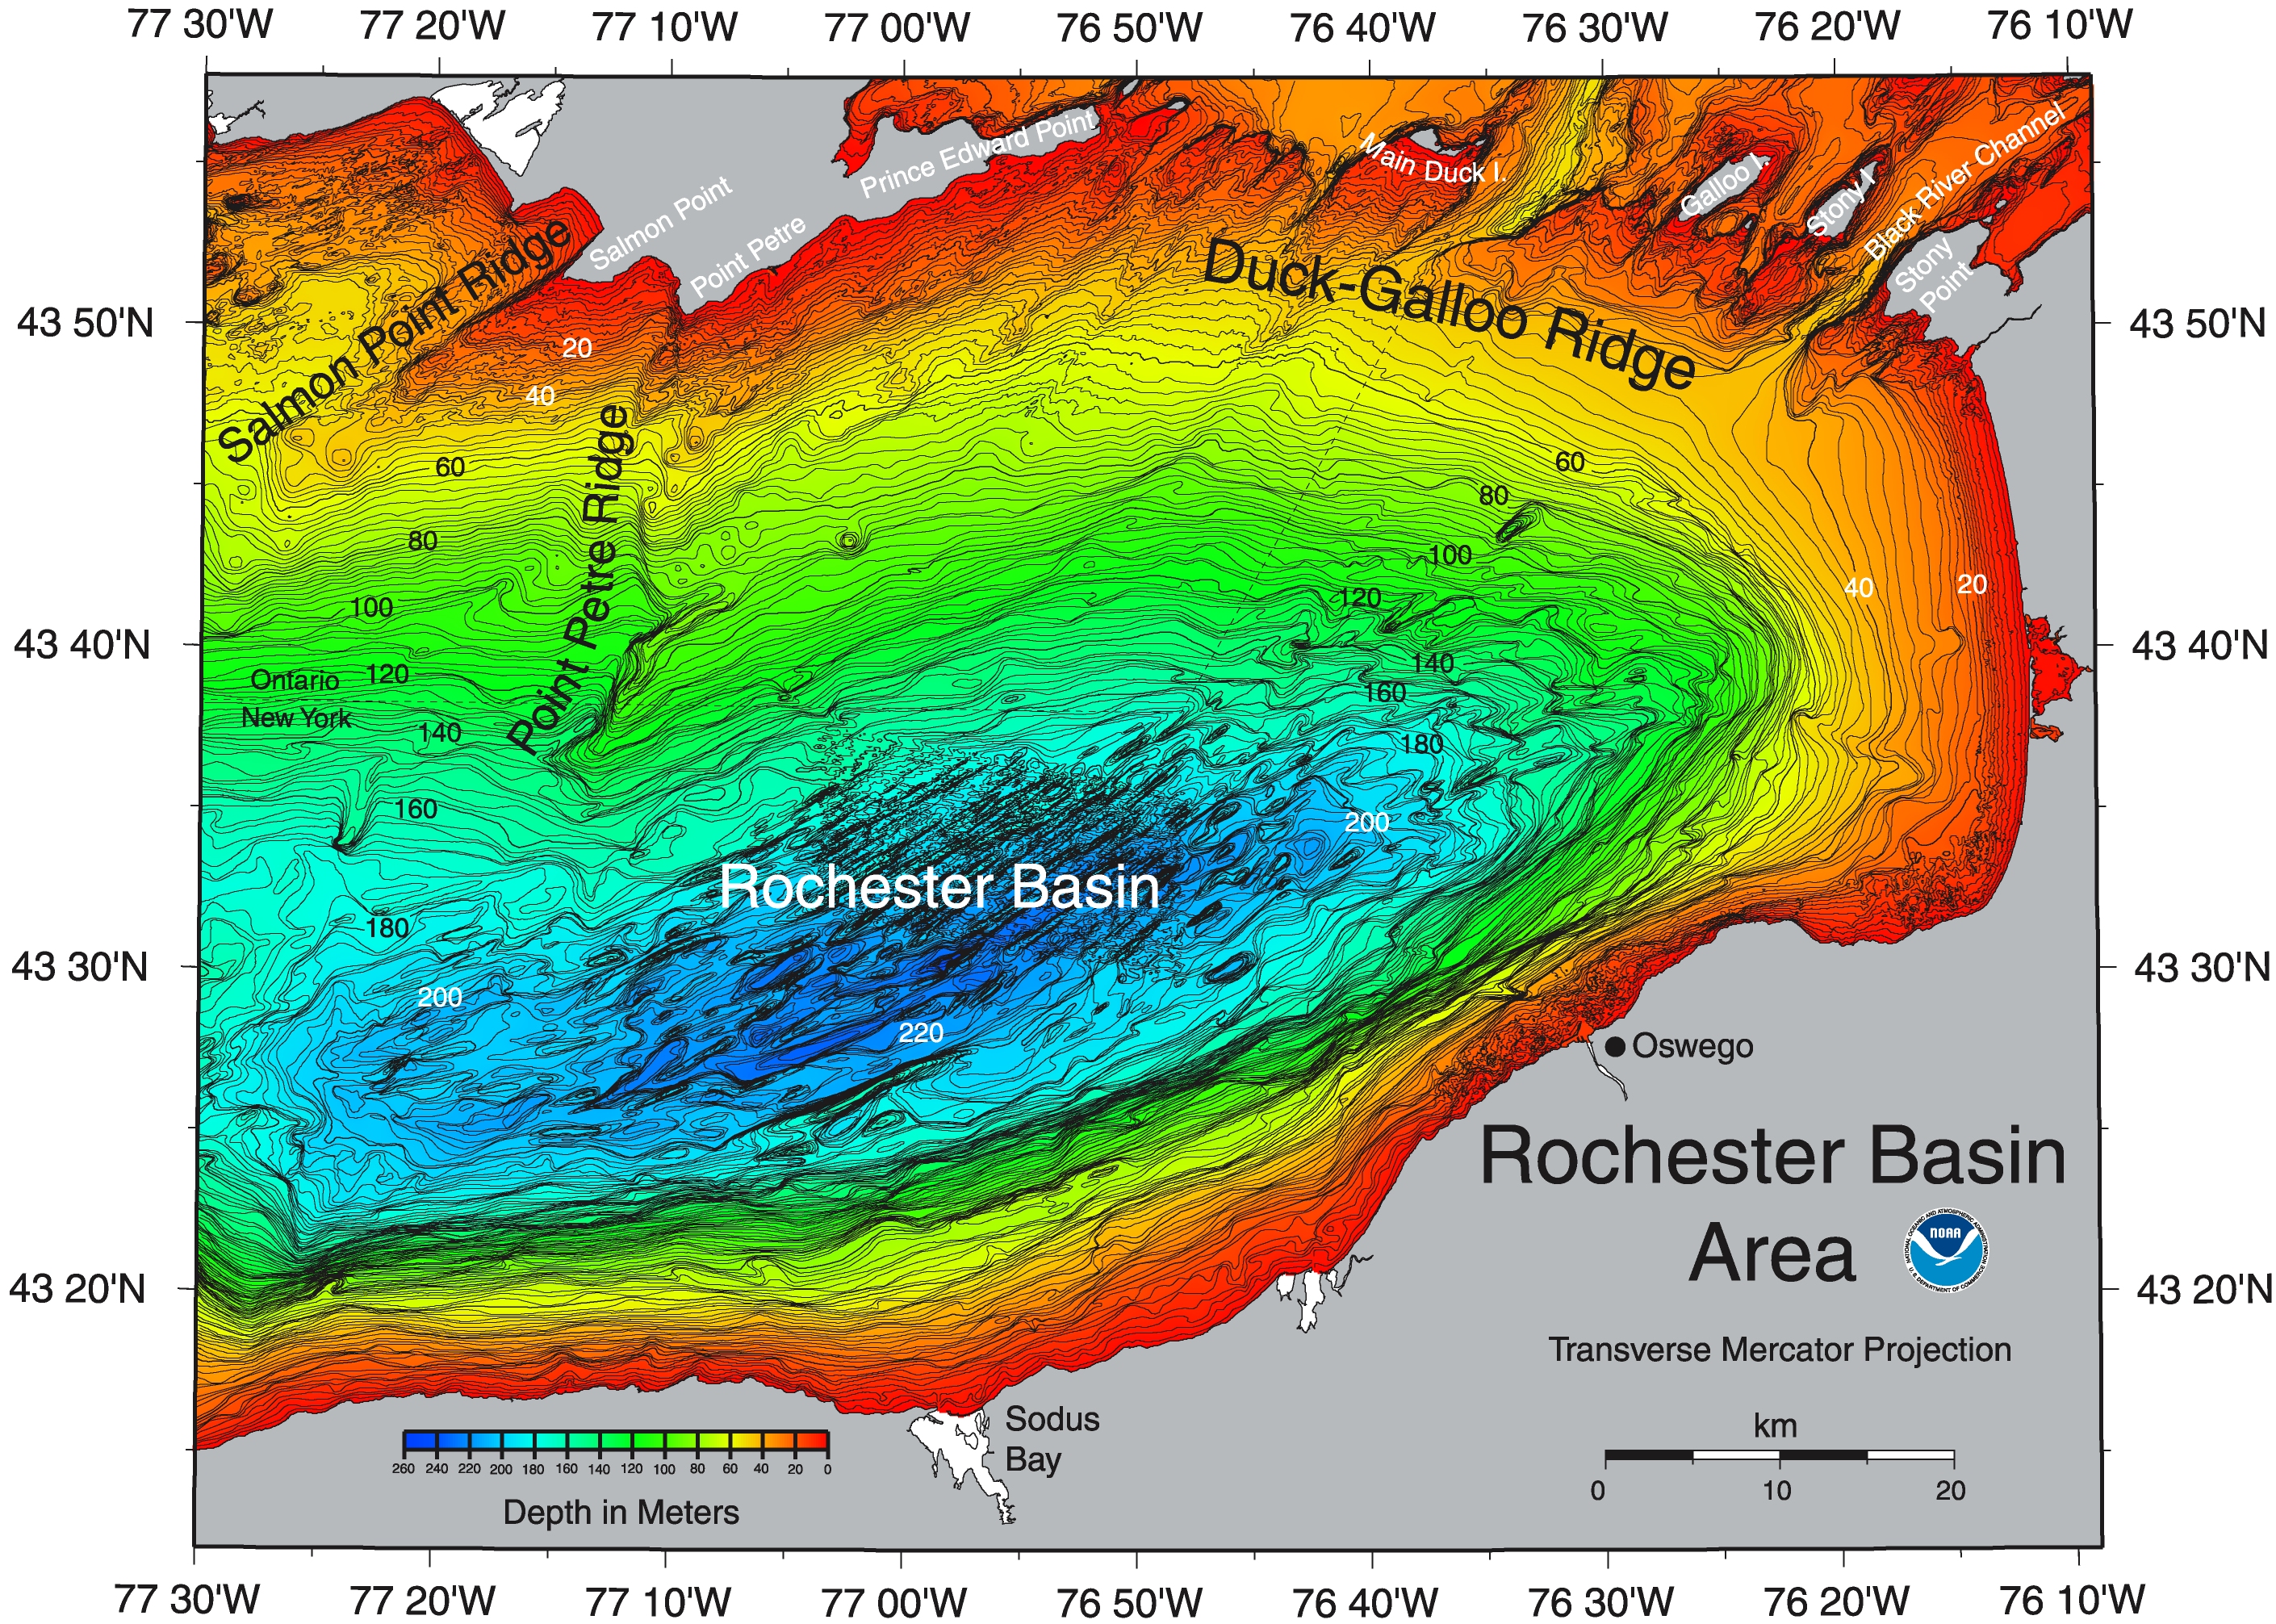
Lake Erie and Lake Ontario have about the same surface area. But Lake Ontario is much deeper and so has a greater volume. I have links here to charts showing the temperatures, at various depths across various slices of Lake Erie and Lake Ontario.
Note that Lake Erie is much warmer. But most of the water in Lake Ontario came from Lake Erie? Why is it so much colder? It cools off in the winter time. It takes water from the Niagara River six years before it flows down the St Lawrence.
If, for the sake of argument, Rochester, Kingston, Hamilton all used deep lake cooling, and they all grew so much that they exhausted the Lake's deep layer, Lake Ontario would still not evaporate, any more than Lake Erie evaporates away to nothing.
Yes, there are deep areas of Lake Ontario that have been at 4 degrees celsius for a long time. How long? Since the last ice age? The glaciers covered the entire Great Lake basin a few tens of thousands of years ago. So that is how long a unique deep lake water ecosystem would have had to evolve.
How much water would the cities have to draw from the deep layer to use up all the cold layer? I don't think you understand how deep the Lake is, and how great its volume. Look at these three maps. West Centre East. So, lets say the deep layer is currently something like half to one third of the volume of the lake. The cities would have to use up the equivalent of the flow of two or three niagaras worth of water in order to drain all the deep cold water.
So long as our winters continue to get cold enough for the lake to cool to 4 degrees the cold layer gets regenerated every winter.
I think it could be argued, if Global warming every gets bad enough that using deep lake cooling exhausts the cold layer in mid-summer that, since we have the infrastructure in place, we use it every summer until it is exhausted. What about the cold deep lake water ecosystem? I am all for preserving interesting, unique ecosystems. But I doubt that a few tens of thousands of years is long enough for it to become interesting and unique.
-
You have never been to Niagara Falls, have you?
but in the long run the lake will evapourate, making the climate in the region less stable (water holding a lot of heat is one of the main reasons the earth has such a (relatively) mild climate) with hotter summers and colder winters, leading to the requirement of more heating in winter and more air conditioning in summer... brilliant
Lake Erie and Lake Ontario have about the same surface area. But Lake Ontario is much deeper and so has a greater volume. I have links here to charts showing the temperatures, at various depths across various slices of Lake Erie and Lake Ontario.
Note that Lake Erie is much warmer. But most of the water in Lake Ontario came from Lake Erie? Why is it so much colder? It cools off in the winter time. It takes water from the Niagara River six years before it flows down the St Lawrence.
If, for the sake of argument, Rochester, Kingston, Hamilton all used deep lake cooling, and they all grew so much that they exhausted the Lake's deep layer, Lake Ontario would still not evaporate, any more than Lake Erie evaporates away to nothing.
Yes, there are deep areas of Lake Ontario that have been at 4 degrees celsius for a long time. How long? Since the last ice age? The glaciers covered the entire Great Lake basin a few tens of thousands of years ago. So that is how long a unique deep lake water ecosystem would have had to evolve.
How much water would the cities have to draw from the deep layer to use up all the cold layer? I don't think you understand how deep the Lake is, and how great its volume. Look at these three maps. West Centre East. So, lets say the deep layer is currently something like half to one third of the volume of the lake. The cities would have to use up the equivalent of the flow of two or three niagaras worth of water in order to drain all the deep cold water.
So long as our winters continue to get cold enough for the lake to cool to 4 degrees the cold layer gets regenerated every winter.
I think it could be argued, if Global warming every gets bad enough that using deep lake cooling exhausts the cold layer in mid-summer that, since we have the infrastructure in place, we use it every summer until it is exhausted. What about the cold deep lake water ecosystem? I am all for preserving interesting, unique ecosystems. But I doubt that a few tens of thousands of years is long enough for it to become interesting and unique.