 Slashdot Mirror
Domain: oetiker.ch
Stories and comments across the archive that link to oetiker.ch.
Comments · 30
-
Re:Send it back....
SNMP your router for interface stats - you'll have to poll this regularly and keep track. http://oss.oetiker.ch/mrtg/ is good for this, you can also do pretty graphs of CPU usage, chip temps and many other things - anything you can query directly via SNMP or script around.
-
Some more tools
Wireshark was already mentioned, so I'll list some other tools I've found useful:
Mtr is better than traceroute. It has ncurses and graphical versions.
For persistent ping tests, I can recommend SmokePing.
Any modern network should have SNMP monitoring capability in the switches and routers. Ask permissions to get read-only access on the devices and there's a wealth of information to be gathered. From basic information like port status, packet/byte counters, to more advanced like topologies learned by MAC learning and neighbor discovery protocols (CDP, LLDP). Or you can just buy one for the class. 100M 24-port managed switches are not that expensive and a Linux server can be used as a SNMP-enabled router (Install and configure snmpd).
To actually act on that data.. You can try one-off tools like Cacti for traffic monitoring, and NetDisco for device and topology discovery. Or a huge does-it-all tool like OpenNMS.
Managed network devices can also dump traffic, either using "monitoring ports" (that mirror traffic from other ports), sflow (sampled stream of packets, unless 1:1 sampling, only useful for statistical traffic measurements) or nflow/ipfix (aggregated flows).
I'm especially fond of nflow, in addition to previous tools. Nflows can be used to analyze, post-mortem, who contacted and where and how much data was transferred at what kind of approximate pattern. This kind of data can be dug out from a full dump, but it's usually infeasible to dump _everything_ to disk. I've used flow-tools.
-
Let the network self document.
I've seen dozens of methods at different companies, but I've only ever seen one that works and it works really well. Many of the top ISP's use a variant of it.
Let the network self document.
What does that mean? Well, typically it means some discipline in how descriptions are written. For instance ISP's will use a standard customer identifier on all ports. An enterprise might just use hostname. From there, tools like Rancid can poll router and switch configs, store them in a version control system, and mail out changes to the entire staff. Rancid is great to use, because it reduces the human work load down to entering a single line for each device (name and OS type), and making sure that the device accepts logins.
Now that all the configs are archived and you have the one true list of devices it's trivial to take that list of devices and feed it to other tools. One of the first might be NetDisco which probes the devices with SNMP and builds adjacency tables, tracks MAC addresses, and so on. From it's database you should be able to locate anything on the network in seconds.
Now that there is a complete picture of the network, it's time for a little scripting. Take the output of Rancid and/or Netdisco, and use it to for instance build an MRTG configuration file, or a list of things for Nagios to probe. It's fairly easy to take the NetDisco adjacencies and run them into a tool like GraphViz to produce a network diagram.
I know of at least two ISP's using this basic formula, and it works really well. Going to an internal web site they can bring up diagrams, usage graphs, MAC tables, IP information and all sorts of other things about any device in the network in seconds. Once devices are in the system it is 100% automated, turn on a new port and it is magically graphed, MAC tracked, and added to the diagrams. Turn it off, it magically goes away. Everything is in version control so old state can be reconstructed. The only human manual intervention is adding/removing one line to the Rancid config when a device is turned up or turned down. I have even seen folks automate that with Netdisco (but, I think that can be problematic, as it's almost circular).
Spreadsheets, Visio diagrams, and the like are always out of date. Someone will always make a change and forget to update it. Some places are only a little out of date, most places are downright wrong. Self documenting is achievable, and always 100% current.
-
Re:Call the ISP
There are lots of free and open source monitoring tools that can help determine if something is out of alignment. SmokePing would probably be incredibly helpful you your situation. Nagios is another popular monitoring tool. Netdisco could help with inventory and topology mapping. It's worth spending a little time getting a good monitoring solution set up so you can be fixing the problem before the phone starts ringing.
-
Re:Plot traffic, establish a norm, compare history
Best way I've found to measure growth is to have a running history of traffic on each router. You don't need a $billion to do it. There are some decent enough FOSS tools out there to do it. MRTG or Cacti will work nicely and integrate with SNMP.
For a smaller network, you could run a span port and graph your own data with a shell script, or hook up NTOP. which will give you real-time views of traffic but you would need to implement something to save those reports daily.
You suggest some good tools, but they primarily measure network utilization rather than capacity. The question isn't "how much data is my network handling now" but "how much data could my network handle at peak"?
-
Plot traffic, establish a norm, compare history
Best way I've found to measure growth is to have a running history of traffic on each router. You don't need a $billion to do it. There are some decent enough FOSS tools out there to do it. MRTG or Cacti will work nicely and integrate with SNMP.
For a smaller network, you could run a span port and graph your own data with a shell script, or hook up NTOP. which will give you real-time views of traffic but you would need to implement something to save those reports daily.
-
Re:to the surprise of even the haters...
I've been using one for a couple years; pricey but it does work well. I had one quit working (replaced by warranty). I wish it had good reports, and I don't really care for Airport Utility... I've got MRTG running on a server to query it... my ISP has been performing pretty badly; I'd like to see how bad; this article inspired me
I'm gonna try and get hourly/daily/monthly totals and identify which port is which tonight... then get some absurdly popular -
Re:Good - more transparency
http://www.kitchenlab.org/www/bmah/Software/pchar/
http://www.isc.org/software/irrtoolset
http://oss.oetiker.ch/mrtg/
http://www.caida.org/tools/If you want transparency, you can always do it yourself. Why wait for Google? You've a list of tools right there that will tell you who is throttling, when, where, how, by how much, and maybe even what they had for breakfast.
http://www.internettrafficreport.com/main.htm
http://www.internettrafficreport.com/namerica.htmThen there's the Weather Channel for geeks. That should give you a good indication of "unusual" packet losses, indicative of throttling.
http://www.noc.ucla.edu/weather.html
http://www.cgl.ucsf.edu/weather/weather.htmlFor more local weather on the tens, there's UCLA and UCSF.
There ya go, and it cost you rather less than the same information is costing Google.
-
Re:Is it really only a matter of scheduling?
Shouldn't the size heuristics be in kernel space? Why should cp be analysing the RAM on the system? Take a look at the obscene hacky amount of heuristics userspace ends up with here, for example: http://insights.oetiker.ch/linux/fadvise/
IMHO, POSIX_FADV_SEQUENTIAL should be sufficient, but it doesn't seem to do anything useful (wrt. the page cache). I'm using POSIX_FADV_DONTNEED continuously on just-read pieces of file for an md5sum-type program (moderate CPU on a one-off sequential read), and this seems to work, but I'll also need to do the Oetiker mincore hack as referenced above in order to avoid evicting files out of the page cache if they were in there before.
This is a massive hack though; why shouldn't POSIX_FADV_SEQUENTIAL suffice? IMHO the kernel should do the following heuristic on POSIX_FADV_SEQUENTIAL: for large files don't cause cache misses to populate the cache. And cp could then do a single posix_fadvise and be done with it.
-
Ping
Now that Apple has an internet web-related / social networking product named 'Ping'..... I wonder how long before they start going after software such as fping, and Smokeping, or World Wide Web / Web2.0 / Blogging products such as Ping-O-Matic, or Pingler
And some OSes even include a command called ping. Think of all the settle to get $$$ and licensing / additional stream of revenue opportunities.....
-
External journal
Something like this might also help:
-
Re:people use PHP?
PHP does not only what you need it to do, but what all sorts of web visitors want it to do as well. Isn't SQL injection beautiful? Thank you, PHP, for such ingenuities as magic_quotes, lack of placeholder/bindings for SQL (do not tell me to use mysqli, fuck you), and lack of casting (hey man let's invent === and !==, everyone will understand).
Why are you using PHP when you could be using Markup::Perl instead? Seriously. Every time I show coders this module, they stare at it for a while and then ask "...hmm, so what purpose does PHP serve again?"
I've read some posts here talking about APC, memcached, blah blah -- okay, memcached is pretty sweet, but APC is a pile of shit. Stay the fuck away from it, you'll thank me later. But people should be asking themselves: why do we need crap like this? Why do we need "caching daemons" and such added infrastructure (not built-in!) to solve shortcomings of languages? Hell, RRDtool has the same problem with regards to scalability -- Tobi's solution? Better introduce a caching daemon rather than admit the original design sucks balls. You can't polish a turd.
This just circles back to open-source and the incredibly-common-in-the-*IX-community ideal: "don't ever re-invent the wheel. Improve on it". This concept/ideal needs to be taken out and beat with a stick a hundred times over. Re-invent something from scratch if the existing design/implementation surrounding it DOES NOT suit your needs, or does not fit with your modus operandi. "It would be like pooping on poop." -- Triumph.
-
Re:The Dangers of averaging
Damnit... I want to keep information on my peaks for capacity planning!
AVERAGE isn't the only archiving function you can use with rrdtool. For your purposes, you should create an additional RRA with an archiving function of MAX. http://oss.oetiker.ch/rrdtool/doc/rrdcreate.en.html#IRRA_CF_cf_arguments
-
Short list
-
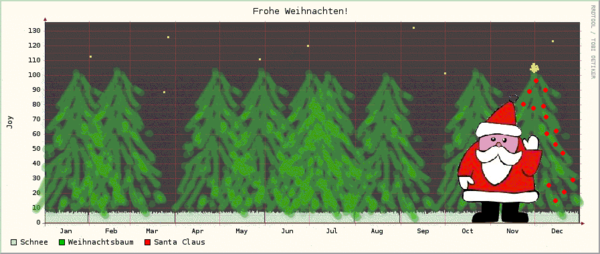
Re:rrdtool.
as you can see from this graph our Santa projections for next quarter are very promising.
-
Re:rrdtool.
and maybe one of the projects that use it.
mrtg and rrdtool are the grand daddies of the monitoring eye candy set. http://oss.oetiker.ch/ for all the projects he made.
-
Re:rrdtool.
and maybe one of the projects that use it.
mrtg and rrdtool are the grand daddies of the monitoring eye candy set. http://oss.oetiker.ch/ for all the projects he made.
-
rrdtool.
and maybe one of the projects that use it.
-
Re:(Useful) Stupid useless articles
I've got to agree that the "Stupid useless" series comes short to what it proposes. I've been reading them with a mix of curiosity and hope and have found the
The mentioned comparison (stackoverflow) brings up an interesting idea of sorting the comments by score rather than just post date, but that link isn't so much better a reference either.
Now, regarding Alexa, I find it hardly reliable to measure traffic, since it depends on users having such a toolbar installed. I'm sure that
-
Re:Internet Axiom: The internet is slow
"Theres nothing like an odometer to measure you're overall useage of bandwidth." I call BULLSHIT! I'm on satellite, and I have to check my bandwidth usage constantly. At work, I check our usage of our fiber connection using Multi Router Traffic Grapher - http://oss.oetiker.ch/mrtg/
-
Re:Why latex at all ?
I've used only three guides to LaTeX to get along with it so far. The first two are free to download, and the third is a book by the father of LaTeX:
1)The Not So Short Introduction to LaTeX2?
2)User's Guide for the amsmath Package (Version 2.0)
3)LaTeX: A Document Preparation System -
\LaTeX is not complex
It's not as bad as it seems.
Let me begin by explaining how I came to use LaTeX. One of my friends pointed me to LaTeX. I read the Not so short Guide to LaTeX and loved the thought behind it. I used it for everything. Biology, chemistry, physics, math, papers, letters, essays, type setting in other alphabets... The list goes on and on.
And I discovered something: while it has a steep learning curve, LaTeX is easy. The problem is that people don't grow up using it.
That said, there are some poorly designed packages... These can be difficult to use... Just search ctan and read documentation till you find one that you like...
-
Re:Seriously?
MRTG says I'm averaging 117.7 kB/s outbound on my router/firewall WAN port over the past few months. A little math gives us:
117.7 * 1000 * 60 * 60 * 24 * 30.4375 = 309,527,460,000 bytes/month
That over 300GB/month upload, and it's only using 6.3% of my connection (15Mbps symmetric), so I could see how 900GB/month might be limiting somebody who has 100Mbps upload speeds.
-
RRDtool ?
What about RRDtool? It's more designed to be used for graphing time based metrics but you could probably use it for other stuff. It's very lightweight and uses a flat file.
-
Re:You only need 16GB of RAM for this to be useful
posix_fadvise() technically does allow you to do what you want. You can use posix_fadvise(POSIX_FADV_DONTNEED) to evict the buffer cache in the IO loop of the program. See http://insights.oetiker.ch/linux/fadvise.html for the ugly details. Unfortunately you can't just make one system call and have it effect an entire file or process. POSIX_FADV_NOREUSE is supposed to be the default in the kernel buffer cache management so it is implemented as a no-op.
-
A bit thin on details
Unfortunately, the posting has very little detail regarding the type of service degradation the poster is experiencing. On my Verizon DSL (3Mbit down/768kbit up) I have noticed over the last couple of months stretches of packet loss to my next hop and my local Verizon core routers in the area. Typically somewhere in the range of up to 5% for a couple of hours. Many times these start at midnight (relative to my timezone) and last until the morning - probably some kind of maintenance. But many times this happens during the day as well. This is when it really sucks because I use VoIP via VPN for office communication. The call center people are useless. They run a local loop test and tell me everything is OK, then they ask me to reboot my DSL modem and router which is useless (I use an OpenBSD PC as router). It is impossible to get to someone with some technical knowledge who doesn't read from a script. I highly recommend SmokePing for capturing data about the DSL connection quality over long periods of time.
-
MRTG
-
Keeping Server cool
I live in Australia too. 3 computers I look after are located in an small room. The temperature monitoring software on the computers was warning us that things were getting to hot. So after trying a few different things we settled on putting an air conditioner in the room. This is then set on a timer controller which turns the air conditioner on for several hours, a few times a day to keep the ambient temperature in the room to an acceptable level.
In the winter we don't need to use it air con at all, in fact we are just starting to use it again now that the weather has heated up.
The other thing I have done is set up Motherboard monitor and SNMP Informant - Motherboard Monitor Edition. I then use MRTG to graph the temperature of the motherboard and cpu. With this information you can use it to only turn the air con on when it is really needed. -
Re:But can I run this on Windows?
Can it run on Windows
Dunno. Don't care either, but it might. Its based on rrdtool which does run on Windows. I don't know if this article is a slashvertisement, or just void of information. I've linked to rrdtool, and here is the munin homepage.
There are _tons_ of these things running around. In my opinion, rrdtool is one of the best tools that has come to computing in a long time. Its awesome. Other packages that use rrdtool are cricket, ganglia, and many others. I believe that the rrdtool site has a listing of some of these.
For those not familiar with it, rrdtool is a database that is designed for time series data. Its kinda like a smart FIFO where it looses details the further back in time you go by storing running averages. I have rolled my own monitoring stuff with rrdtool and perl to monitor CPU, load, temperatures, you name it. One of the cool things about rrdtool is that the database is fixed in size. rrdtool is not easy to initially set up and work with, but the effort is definitely worth it.
Basically, if your a sysadmin in 2006 and you do not have rrdtool based monitoring going on. Well, maybe the job is not for you. Its that important and good. A simple click on a link of a webpage with a rrdtool graph can demonstrate to even the pointiest of pointy PHB that you need more equipment or a trend is going on or whatever.
This is the kind of stuff I would like to see more talked about here on slashdot. -
RMTTFFL
RMTTFFL (Read More Than The First Fucking Line)
Server Monitoring on Windows != "follow this tutorial is to use a command line client/SSH client (like PuTTY for Windows)"
having said that, a good, free, open source server monitoring solution (including Windows Servers) is MRTG.