 Slashdot Mirror
Domain: ucar.edu
Stories and comments across the archive that link to ucar.edu.
Comments · 361
-
Re:Quick...
Read Trenberth's paper more carefully. The problem is nothing to do with the observations of the energy coming in, or leaving, the global climate system. There is a net influx of 0.9 +/- 0.5 W/m^2 - that's already clear from IPCC figures (see Table 4).
What he attempts to address is where the energy is being stored. To continue the analogy, we know we're eating too much relative to our expenditure, we just don't know which part of us is getting fatter because we don't have good enough scales. He suggests the "missing" excess heat is being stored deep in the oceans, and later studies (von Shuckmann 2009) appear to bear that out.
-
Re:end panic driven hyperbole
Yeah, where your data to back that up? "While a couple of hurricane landfalls in Florida have produced pressures in this range, most cities in the Northeast have never reached such values, as is evident in this state-by-state roundup. The region’s lowest pressure on record occurred with the 1938 hurricane at Bellport, Long Island (946 hPa)."
-
Re:End climate silence
...Sandy blows all the historic stats out of the water, including 1938 hurricane Bellport. Calls bullshit on the "75 year cycle storm" theory - where is the data to back that up?
While a couple of hurricane landfalls in Florida have produced pressures in this range, most cities in the Northeast have never reached such values, as is evident in this state-by-state roundup. The region’s lowest pressure on record occurred with the 1938 hurricane at Bellport, Long Island (946 hPa).
-
Re:Detecting anthropogenic movement on the surface
GRACE can resolve nearly uncorrelated mascons that are blocks 400km on each side with a noise floor of ~1cm equivalent water height. (This is latitude dependent because GRACE's denser ground tracks near the poles allow for better resolution.) Each mascon has a mass of ~1.6 gigatons, and a fully-loaded coal train is ~10 kilotons, so GRACE falls short by about five orders of magnitude.
The improved laser ranging on the GRACE follow-on will increase sensitivity, and David Wiese analyzes improvements due to lowering the satellites' altitude and/or adding more satellites to the GRACE system.
You're right to suspect that detecting a tiny change in local gravity is limited by uncertainties in models such as atmosphere dynamics. I've discussed how GPS occultation data (among many other data sources) can be used to reduce these uncertainties.
Other anthropogenic effects such as groundwater depletion can already be detected with GRACE. Rodell et al. 2009 (PDF) and Tiwari et al. 2009 (PDF) observed this in northern India, and Famiglietti et al. 2011 (PDF) recently observed similar groundwater depletion in California.
-
Re:All except Washington
-
Re:Choose, denialists
I hope you're being snarky.
http://www2.ucar.edu/sites/default/files/news/2011/noaa_globaltemp_2010.jpg
Maybe there was *a* summer as hot in '36 but it's definitely hotter overall than '36.
-
Los Alamos's contributions
The article hardly talks about climate research at Los Alamos National Laboratory, which develops the ocean (POP) and ice (CICE and CISM) components of one of the world's leading climate models, CESM. The climate group at Los Alamos got started studying nuclear winter (related work was mentioned in TFA), and built its strength in ocean modeling with new ideas in high performance computing for parallel partial differential equation solvers (fishing for new applications, since they had all these giant supercomputers lying around for nuclear hydrodynamics.). More history here.
-
Not really big news
Hansen's prediction is widely considered one of the most influential models out there for climate change. As it turns out, he made four predictions based on various scenarios of energy use in the future. The one that the article is talking about happens to be his most pessimistic prediction. I had the pleasure of attending a talk given by him recently at the Conference on World Affairs.
It's been 30 years and he's still trying his utmost to get people in power to just listen.
-
Re:Simple solution...
In a word, no. It is more the rule than the exception in physical processes for causality to be able to run in either direction, depending upon boundary conditions.
Really? So, we can heat a pot of water with fire, and also cause a fire with a heated pot of water?
Let's have an actual example.
The reason that they are not sure of the sign is that the evidence indicates that net cloud feedback is close to zero.
Hardly. They have no idea about the magnitude *or* the quantity.
And no, nobody has managed to come up with a model that creates the modern warming through cloud feedback and that is at all consistent with the known climate records.
Again, you're trying to take a failure of the GCMs you have so much faith in, and then assert that this failure must somehow represent an entire solution for the problem at hand? We know cloud feedback is real. We don't have any model that accurately deals with cloud feedback. How can we rely on a model that ignores reality?
every model that is consistent with the known climate record
Models are consistent with the known climate record because they've been curve fitted. Understand this isn't one of their strengths.
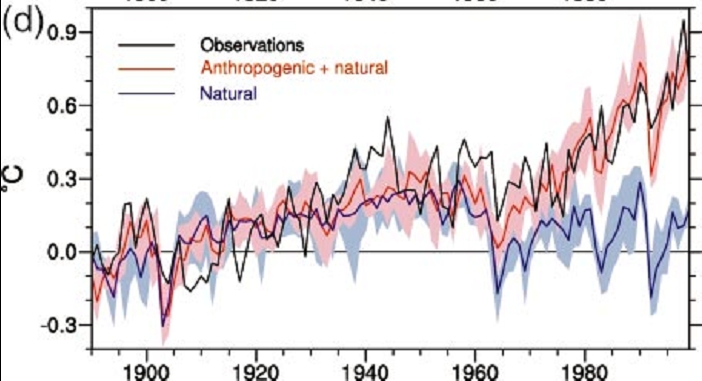
You can't tell much of anything from a graph in which the axes are unlabeled. Warming arising from "natural" sources can be distinguished because "natural" does not mean magic.
The graphs are the same period of time, and the same vertical scale, simply unlabeled as to the absolute value. You cannot discern from either of them which one is supposed to be "natural" as per your AGW hypothesis, and which one is supposed to be CO2 driven.
Given that such a similar period of 50 years exists within the climate record, before any proposed CO2 impact should have even existed, shows great weakness, don't you think?
For example, warming due to an increase in solar output predicts that the upper atmosphere will warm more than the lower (in fact, the upper atmosphere has cooled).
Funny you should mention that:
http://www.realclimate.org/?comments_popup=2019Note
“what would FALSIFY [linking CO2 to ‘warming’]?”Schmidt swings again:
”that the stratosphere is not cooling as expected (this is a cleaner test than the surface temperatures because there are less extraneous factors)”And it’s a miss! The stratosphere hasn’t been cooling in over a decade:
http://www.acd.ucar.edu/Research/Highlight/stratosphere.shtml
http://www1.ncdc.noaa.gov/pub/data/cmb/temp-and-precip/upper-air/uahncdc.ls
http://www.arl.noaa.gov/documents/JournalPDFs/RandelEtal.JGR2009.pdfLike many physical processes, it can run in either direction, depending upon circumstances
Ah, back to the pots of heated water than can create fires
-
Technology, education and Hydroponics
Throwing food at them just extends their demise, giving them technology to build their own tools for survival is what will fix that. I'm sure there are tens of thousands of bright minds in Africa ready to be creative if they just go the means and the tools
Hydroponics; Forget about soil, you don't need it but if you do want to use a substrate than there's Rockwool (they use fibreglass insulation back in the day), Clay Pebbles aka Hydroton, Coco Fiber and Peat. A lot of the plants can be grown in Deep Water Culture, Aeroponics and Aquaponics which require no substrate at all. All you need is access to fresh water and design way to recapture the water that is transpired through the plants and recycle it. Maybe some kind of fully sealed greenhouse where water vapor is recaptured. Mind you you'd than have to supplement co2 but that can be done with burning propane/ng which also creates water vapour which could be captured.
From http://www.ucar.edu/learn/1_4_2_18t.htm
Plants transpire vast quantities of water - only one percent of all water a plant absorbs is used in photosynthesis; the rest is lost through transpiration. In one growing season, one corn plant transpires over 200 liters.
-
Re:Denialism of natural climate change
You misunderstand his question - it was *rhetorical* not scientific. He *presumes* the answer, he doesn't look for it.
That's your interpretation, not mine. I think you're making a pretty big assumption that he presumes the answer.
I'm sure you can't possibly mean that. Human activity generates heat, and that heat will, all other things kept equal, warm the planet. It may be that those things that tend to increase average global temperature are minuscule, and possibly undetectable against the background of natural variation, but they *must* have some nonzero, positive effect.
Human generated waste heat contributes about 0.028 W/m^2 to heating the climate. The additional greenhouse gases in the atmosphere contribute about 2.9 W/m^2, over 100 times as much. More details here. So my saying the UHI effect has no effect on global warming overstated it a bit by not much. If waste heat was the only thing causing global warming it wouldn't be enough to cause enough warming to worry about.
I realize that ice cores can not show the details of CO2 fluctuations on scales of less than about a century. Where is you evidence that there have been drastic fluctuations in CO2 levels that just happen to average 280 ppm on those time scales?
Under normal conditions the left hand will warm up zero or hardly at all because of the human body's heat regulation mechanisms. I don't understand the point you are trying to make. Conduction of heat plays little role in the heat energy dynamics of the Earth. It's mostly radiation and convection.
-
Re:However
http://www2.ucar.edu/climate/faq/how-much-has-global-temperature-risen-last-100-years
we really need to treat climate change as the new evolution it seems.
-
NCAR
The National Center for Atmospheric Research, known as NCAR: http://ncar.ucar.edu/ Located in beautiful Boulder, CO, the Super Computer BlueFire http://www2.cisl.ucar.edu/docs/bluefire-user-guide is a great attraction if they let you go inside, but you can still see it outside the glass. Once you finish there, you can see all the great architecture by I.M. Pei (IIRC), and see awesome weather results like a tornado tube and understand all the different clouds, etc.
-
Re:For those that dismiss these news as irrelevant
Changes in precipitation with climate change [PDF] by Kevin Trenberth.
-
Re:Doing more damage than we can reverse.
Climate is what you expect, weather is what you get. I've heard it put like this: Weather throws the punches but climate trains the boxer. So yes, a shift in weather patterns is a sign of a changing climate
The following graph shows that the ration of US record hot to record cold temperatures has increased steadily up to the point where it was 2:1 in the 2000's: http://www.ucar.edu/news/releases/2009/images/temps_2.jpg
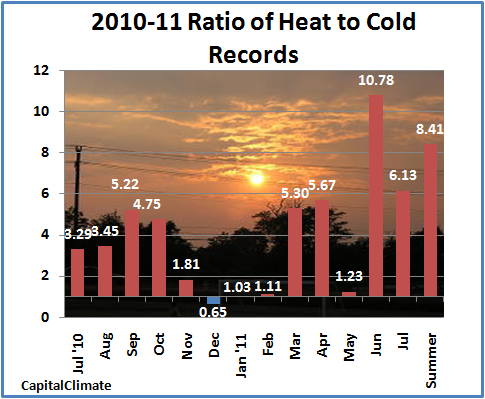
In 2011 it was much worse than that - and this is during a moderately strong la-nina (which drives temperatures down): http://4.bp.blogspot.com/-5baWZYXDlCo/Tjhrbi97kpI/AAAAAAAACSg/YYzIk2KsANo/s1600/temp.records.073111.jpg
-
Re:Science is based on skepticism
In this case, it wasn't even about that... All the data we needed was there... But kept from anyone outside their group... And then modified, and the original data deleted.
This is a widely believed falsehood (you might want to consider who profits from propagating this canard).
In fact, the data has always been available. The groups that analyzed the data previously never owned the data, and never had control over it, so they couldn't have kept it from anybody else or changed or deleted it even if they wanted to do so. This is not even the first independent analysis of climate data. This group got the data from the same sources as everybody else. -
Re:Did it "confirm" it was caused by man?
It was not CRU's data. The CRU is not running monitoring stations, or even collecting data. The data was from the World Meteorological Organization, via the UK Met Office. Neither the CRU or the Met Office magically have permission to give away that data. In fact, CRU didn't even have that data anymore.
But, nevertheless, after all this happened, the Met Office went and asked for permission to release it. And the raw data they were allowed to release (Which appears to be every station but the 19 in Poland for some reason, insert your own conspiracy theory there.) is here.
It's a real good job you did with the Google there, looking for that data. You looked real hard. Or at least read some pages that said the data hadn't been released, and isn't that really good enough?
Of course, almost all that data was already public anyway via World Monthly Surface Station Climatology and the GHCN before the Met Office released the uncorrected data. So people ran statistical sampling by comparing the CRU data to those data sources to see if the corrections introduced any sort of biases. They didn't.
But, hey, I love climate change deniers. In fact, I love all deniers. It's so much fun when they don't get memos and run around demanding that people 'release' information that was released in 2009.
-
Re:The Alarmism misses a key detail
Record high temperature outnumbered record cold temperatures by 2-1 in the 2000's. Admittedly that only covers the US but in 2010 17 countries had all time record high temperatures.
-
Re:Most likely?He is pretty sure:
The problem is that comparable studies published by other authors have already been refuted in open discussions and to some extend also in the literature (cf. [7]), a fact which was ignored by Spencer and Braswell in their paper and, unfortunately, not picked up by the reviewers.
-
Re:Terrible Headline
Apparently, I've forgotten to read between the lines of a scientific paper, because it doesn't sound like much of a polemic.
Here's the discussion.
Discussion and summary:
Consistent with AR4, this analysis demonstrates that observed and modeled late 20th century Arctic sea ice loss cannot result from natural variability alone. Indeed, an anthropogenic influence on the most extreme observed 1979-2010 negative trends is now evident for all trend lengths examined (2-54 years). While CCSM4 can reproduce the observed ice loss, it also shows that internal variability exerts a strong influence on sea ice trends, especially on sub-20 year timescales. Comparing a six-member CCSM4 ensemble to observed trends suggests that internal variability has enhanced observed ice loss and facilitated detection of an anthropogenic influence on observed trends during the satellite era (1979-present). In a warming world, multi-decadal negative trends increase in frequency and magnitude, trend variability on 2-10 year timescales increases, and when internal variability counteracts anthropogenic forcing, positive trends frequently occur on 2-20 year timescales in the second half of the 20th century, and on 2-10 year timescales in the first half of the 21st century.But maybe I've missed something. Read the paper and tell me what you think.
-
Re:Better link
Better yet, here's the actual paper
-
Re:Scientific American throws in the towel
A lot of the "Man is causing Global Warming" science is hard to falsify, but that's because the people doing that research are hiding their original numbers and only using massaged data to "hide the decline" in the amount of Global Warming taking place.
Pure and utter bullshit. Who is "hiding their numbers"? I'm guessing you're referring to the "Climategate" incident in 2009 based on your particular use of the phrase "hide the decline", an oft-repeated-by-the-denialists phrase supposedly indicating it has something to do with the scientists at the CRU actively trying to hide data within graphs.
As oft-repeated as it is, though, it's been even more oft-debunked, so I won't bother even addressing how clueless you are when it comes to this "scandal" (hint: if there was some "conspiracy" to falsely prove climate change, where in the e-mails does it mention said conspiracy? You have a lot of misunderstood phrases taken out of context, but nothing along the lines of "Alert Lord Gore, inform him the coverup of the data is complete! His plans for world domination will come to fruition!!!" anywhere within.) Instead, I'll issue a challenge you'll never take up: The original data for most of what was being worked on in the hacked e-mails comes from weather station data that's freely available at the Global Historical Climatology Network or the National Centre for Atmospheric Research. Feel free to contact either of them and ask for a copy of station data covering the last 100 years and do your own analysis and thus falsify the theories. Recommendation, ask nicely. Like every other person on the planet (who doesn't live on The Jersey Shore), scientists don't like douchebags.
If you can prove the analysis, you'll be the hero of not only the denialist movement, but the scientific community as well. After all, science #1 goal is to be shown it's wrong because it's in doing so that we learn. But, we all know you'll never do that.
For once, a scientist put out an easily falsified Global Warming theory, that is "By 2010, there would be 50 million climate refugees, and they'd come from these specific places." 2010 has come and gone, and there aren't 50 million climate refugees. Therefore, his falsifiable statement has been proven false.
Well, that's true...except for it all being completely false. Read the articles mentioned and read the first comment to see that no scientist actually said that.
It means giving up whatever money was set aside to deal with the climate refugees.
There was money set aside? None of the articles mention it. I realize it's a moot question, but...do you have a source for this?
It means maybe next time, listening to the people who say that there won't be 50 million climate refugees in the next five years. It doesn't mean mocking the people who disagreed with the original prediction for something that has nothing to do with what they said or did.
But, when one group goes out of their way to be wrong so often, you just have to mock them. I know I do. Oh, and I can't find any reference to anyone disagreeing with this until 2010. Apparently, for a group that's ordinarily so vocal in their ignorance, the denialists were silent on this "issue" when it first appeared. Perhaps it's because in 2005 people actually knew that no scientist said there'd be 50mil climate refugees and saying so then would invite a lot of backlash for such a gross misreading? Mention it now, and pretty much no one but the denialists even notice.
A challenge to a theory isn't "an attack on science," but refusing to let go of an idea that has clearly been proven false is.
I couldn't agree more, and yet...here you are defending it.
-
Re:Relax
Everything that we now see happens on top of a base climate. The fact that we are seeing new daily record highs outpacing new daily record lows by over 2 to 1 is a pretty good indication the base climate is changing. [citation].
The heat wave in Russia this past summer was unprecedented. A Russian scientists stated it had been at least 1000 years since such a heat wave has occurred there.
As far as the cold over Europe and the US it is not record setting. Warmer temperatures lead to more snow (until it gets too warm to snow) because the colder air is the drier it is.
-
Re:Passionate scepticism
Still not seeing any citations, but perhaps you should be reviewing your own examples. The hockey stick has been confirmed by multiple independent lines of evidence:
McIntyre 2004 claimed that the Mann 1999's hockey-stick graph shape was a result of the analysis method used (principal components analysis), and was not statistically significant. However, the National Center for Atmospheric Research reconstructed (Wahl 2007) the graph using a variety of techniques (with and without principal components analysis), and with some slightly different temperatures in the 15th century, confirmed the hockey stick. Furthermore, independent measurements from boreholes (Huang 2000"), stalagmites (Smith 2006) and glaciers (Oerlemans 2005) all confirm the same dramatic recent temperature rises. Mann 2008 combines these with ice cores, coral and lake sediments to confirm the same hockey stick shape over the last 1300 years, without requiring the disputed tree-ring data.
If you're referring to Steig 2009, perhaps you can point us to evidence that discredits this? You'll have to forgive us for not taking your claims that it is "unmitigated bollocks" at face value. Rather, measurements from the GRACE satellite (Velicogna 2009) show very clearly that the Antarctic land ice sheet has lost around 900 gigatonnes in the last 7 years, and this loss rate is accelerating, even in the previously-thought-stable East Antarctica (Chen 2009). The Antarctic sea ice sheet is actually increasing, however, for numerous possible reasons, but at a lower rate than the land ice loss.
-
NCAR
Send an email to the folks at the CISL division of NCAR.
They know a thing or two about Crays.
-
NCAR
Send an email to the folks at the CISL division of NCAR.
They know a thing or two about Crays.
-
NCAR
Send an email to the folks at the CISL division of NCAR.
They know a thing or two about Crays.
-
Re:More science still
My biggest concern with climate modeling right now is that climate scientists are not the equal of computer scientists, and this gives one pause [wikipedia]
My problem is with people who take Wikipedia as an authority, and not as a starting point.
Even back in 2004, the models were using adaptive grids (e.g., http://citeseerx.ist.psu.edu/viewdoc/summary?doi=10.1.1.60.5091 ) where it makes sense to do so. And I don't think anybody uses constant latitude-longitude grids any more-- this one http://www.ncl.ucar.edu/Document/Graphics/contour_grids.shtml shows some of the more common grids.
-
Re:In Time?I don't know about the GOM specifically, but models of oceanography of most regions around the U.S. have been under development, availability, testing, and use for quite a while, and substantial toolkits exist, so it's just a matter of putting some fluid of the right density in the right place and getting present starting conditions. The crunch is really getting the computer time to run the models which is what the new money addresses.
And yes, there's also a lot of graphical toolboxes so whipping together a quick display isn't B-movie territory (though using VB is contraindicated: Xwindows and fortran are preferred).
-
Re:Experts
Now, if you're claiming that Watt is a crackpot and making up all of his surface station data, that's another thing entirely, but since his results correlate with other datasets... it's weird form of verification for him.
I'd been reading Anthony Watts's websites for years before Kyle and I discussed surfacestations.org last year. He acts like a serious crackpot on his other site wattsupwiththat.com, but clearly tries to keep a lid on the crazy when writing surfacestations.org.
Taken together, both sites make it clear that Watts believes climatologists are incompetent and/or engaged in a massive conspiracy. He ignores the multiple independent proxies and wind studies which back up the instrumental temperature record. He implies that the urban heat island effect is responsible for the rise of instrumental temperature record because 90% of stations are "poor quality" according to him. So scientists take the 10% of stations that are "approved" by Watts, and its time series is very similar to the time series of all stations. Furthermore, the abstract of the Menne 2010 paper I've already linked pointed out that the bias was "counterintuitive" to Watts's preconceptions. This is not a verification of Watts in any sense.
James Annan claims that the date (1990) was cherry picked as a minimum.
That's not how I read James Annan's series of three articles. He seemed to mainly be criticizing Pielke's sloppy statistics. I've previously described this in many places, but the best I can find at the moment is here. Again, the analyses I've linked take proper ensembles of the AR1 models, updated with actual emissions and other forcings, and analyze the results with an understanding of the statistical limitations imposed by the need to average out weather noise. I don't see any evidence that Pielke actually did any of this, which is probably why he hasn't gotten any of these rants published in a reputable journal.
Again, I think the stratospheric water vapor issues I've previously linked and the inherent unpredictability of turbulence like ENSO are enough to explain most or all of this difference.
Sure, if you make your error bars large enough, you can always be right. =)
Even the "large" uncertainties in current GCMs are small enough to show that anthropogenic greenhouse gases are responsible for the warming since 1970. Even though the two curves have wide error bars, they don't overlap. What other objective measure should we use to determine when the error bars get "small enough"?
Care to send me the link to your presentation?
I've recently been threatened with a lawsuit on Slashdot, so my commitment to anonymity is stronger than ever. I don't want to end up like the CRU scientists. But I've described my
-
Re:What could
I admit one mistake, then, it's not _your_ straw man. You see, this article was written by reporters for the general public. Both of these groups are not known for grasp of technical matters, scientific ones or even numbers. If you'd apply your thinking to actual data, such as papers published by scientists (for example, this and this) you'll see the actual number is about 30kg of water per second per ship, and the proposed method is to use wind powered robotic vessels. The second article, by the way, is very informative.
-
Here's some scienceSlashdot folks like science, so read the papers on John Latham's website. Here's his synopsis:
John Latham is working with several collaborators (including Prof. Tom Choularton, University of Manchester, UK; Prof. Stephen Salter, University of Edinburgh, UK; and Prof. Mike Smith, University of Leeds, UK) on a proposed geo-engineering technique for global warming mitigation (Latham, 1990 and 2002 , Bower et al. 2006). A detailed account of this work is presented in the three papers linked, above.
The basic principle of the scheme is advertently to increase the droplet number concentration N in maritime stratocumulus clouds, thereby increasing their albedo (reflectivity) for incoming sunlight and also their longevity. This would produce a cooling effect, the magnitude of which could be controlled, and calculations and GCM computations both indicate that its magnitude could be sufficient to balance the warming due to increased atmospheric carbon dioxide concentrations resulting from the burning of fossil fuels. It is proposed to increase N by atomizing seawater at the ocean surface (producing copious quantities of droplets of around 1micron in size), and the significant fraction of these which rise into the low-level clouds above would act as cloud condensation nuclei (CCN), thereby creating additional droplets and enhancing N. The seawater droplets would probably be disseminated from a fleet of satellite-controlled unmanned vessels, deriving their required energy from wind or wave-power. Control over the degree of planetary cooling could be achieved via albedo measurements linked to a global climate model.
Technological questions regarding the production and dissemination of these particles remain to be resolved. Also, detailed examination of the meteorological and climatological ramifications of this proposed geo-engineering scheme would need to be conducted before justification would exist for its operational deployment. Two advantages of the scheme are that: (1) it is relatively benign, the only raw material being seawater; (2) if the disseminators were switched off, the droplets introduced into the atmosphere would fall back into the oceans within a few days.
-
Re:Ultimately
HERE IS YOUR FUCKING RAW DATA (because you are unvilling to search it for yourself -- and call yourself a skeptic...):
ftp://ftp.ncdc.noaa.gov/pub/data/ghcn/v2 [noaa.gov]
ftp://ftp.ncdc.noaa.gov/pub/data/ushcn/v2/monthly/ [noaa.gov]
http://dss.ucar.edu/datasets/ds570.0/ [ucar.edu]
http://www.antarctica.ac.uk/met/READER [antarctica.ac.uk]
http://eca.knmi.nl/ [eca.knmi.nl]
http://www.zamg.ac.at/histalp/content/view/35/1 [zamg.ac.at]
http://daac.gsfc.nasa.gov/atdd [nasa.gov]
http://mirador.gsfc.nasa.gov/cgi-bin/mirador/presentNavigation.pl?tree=project&project=SORCE [nasa.gov]
http://amsu.cira.colostate.edu/ [colostate.edu]
http://www.pol.ac.uk/ntslf/data.html [pol.ac.uk]
http://www.geo.unizh.ch/wgms/dataexp.html [unizh.ch]
http://www.marine.csiro.au/~ttchen/argo/gmap.htm [csiro.au]
http://icoads.noaa.gov/ [noaa.gov] -
Re:Are climate researchers....
YOU IDIOT!
Here you are, PLENTY of RAW datasets:ftp://ftp.ncdc.noaa.gov/pub/data/ghcn/v2
ftp://ftp.ncdc.noaa.gov/pub/data/ushcn/v2/monthly/
http://dss.ucar.edu/datasets/ds570.0/
http://www.antarctica.ac.uk/met/READER
http://eca.knmi.nl/
http://www.zamg.ac.at/histalp/content/view/35/1
http://daac.gsfc.nasa.gov/atdd
http://mirador.gsfc.nasa.gov/cgi-bin/mirador/presentNavigation.pl?tree=project&project=SORCE
http://amsu.cira.colostate.edu/
http://www.pol.ac.uk/ntslf/data.html
http://www.geo.unizh.ch/wgms/dataexp.html
http://www.marine.csiro.au/~ttchen/argo/gmap.htm
http://icoads.noaa.gov/Let me repeat:
YOU IDIOT -
Re:Absence of Evidence
*cititaion [sic] needed otherwise it's just hyperbole
For what, thousands of specialist scientists? Too easy! See Annex II and start counting
-
Re:Science or Religion?
Actually, three years ago in December there was a major snowstorm in Boulder/Denver. That may not seem odd, but most of our snow comes in the Spring. Local climatologists (they work here in Boulder) said that we should expect more early snowstorms (not just snow, but 12+ inches at a time) as a result of global warming.
-
Re:Great
-
Re:This is not science.
"And as I noted, the most common way is to not be a party required by law to comply with the FOIA. Moving on, just because something is legal to do, which incidentally doesn't appear to be the case with the CRU FOIA requests"
Mann was cleared of most of accusations: http://www.research.psu.edu/orp/Findings_Mann_Inquiry.pdf
"doesn't mean you should do it. Hiding important data and computer models is unscientific as noted by the original poster."
Certainly. However, models were available to other researchers and most of data is (and was) free.
"Ok, I looked. Not sure what your point was supposed to be. As I understand it, there are three prime aggregators of paleoclimate data, the CRU, a NASA unit headed by James Hansen, and something similar in the NOAA (the last being the only one that isn't running some obvious unscientific agenda). If there are other aggregators, then maybe you could just mention them by name rather than throwing links at me?"
Which data exactly do you need? I personally worked with CSIRO HADISST dataset for ice coverage. There is GHCN-Monthly for temperatures. And GPCC from Germans which are also the part of the conspiracy.
A colleague here tells me that CISL also provides aggregated datasets: http://www.cisl.ucar.edu/dss/
And anything (and I really mean _anything_) Steve McIntyre says is probably false and/or misleading.
-
Re:This is not science.
FOIA in UK laws do not give you permissions to request any data at any time. There are valid and lawful ways to deny them.
And as I noted, the most common way is to not be a party required by law to comply with the FOIA. Moving on, just because something is legal to do, which incidentally doesn't appear to be the case with the CRU FOIA requests, doesn't mean you should do it. Hiding important data and computer models is unscientific as noted by the original poster.
CRU surely is important, but there are other independent aggregated datasetes: http://dss.ucar.edu/datasets/ - just look here.
Ok, I looked. Not sure what your point was supposed to be. As I understand it, there are three prime aggregators of paleoclimate data, the CRU, a NASA unit headed by James Hansen, and something similar in the NOAA (the last being the only one that isn't running some obvious unscientific agenda). If there are other aggregators, then maybe you could just mention them by name rather than throwing links at me?
Most important data from CRU is in HadCRUT3 dataset, and I don't think its validity was questioned. CRU's analysis of this data (the famous 'hockey stick') was called into a question, but not the data itself.
Well, there's a pile of articles from Dr. McIntyre. Many of these criticize HadCRUT3 or its components. So yes, the data itself has been called into question repeatedly.
-
Re:This is not science.
"Is the prior poster subject to FOIA laws? Do they do work that affects the global economy and billions of people like climatology and global warming does? No? Then it is a failed analogy."
FOIA in UK laws do not give you permissions to request any data at any time. There are valid and lawful ways to deny them.
"As far as I know, all climate models have been calibrated on this aggregation of data. It also formed the basis of IPCC announcements and decisions which is the internationally recognized organization for addressing global warming concerns."
CRU surely is important, but there are other independent aggregated datasetes: http://dss.ucar.edu/datasets/ - just look here.
Most important data from CRU is in HadCRUT3 dataset, and I don't think its validity was questioned. CRU's analysis of this data (the famous 'hockey stick') was called into a question, but not the data itself.
-
Re:Seems reasonable
Most, if not all work done at US universities or government institutions is required to be made public. In fact, you can already find climate models from the main US based investigators:
http://www.ncar.ucar.edu/tools/models/
http://www.giss.nasa.gov/tools/ -
Re:Sounds like a coal industry shill
The *direct* result of CO2 warming is only about 10% of observed warming
The *direct* result of CO2 is a +1.66 +- 0.17 W/m^2 forcing "solely due to increases in atmospheric CO2". The total forcing from human-added GHGs is +2.63 +- 0.26.
Let's run down the forcings from other human influences and from feedback effects. Stratospheric ozone forcing is -0.05 +- 0.10 W/m^2. Tropospheric ozone forcing is +0.35 (-0.1,+0.3). Stratospheric water vapor from CH4 is +0.07 +- 0.05. Total direct aerosol is -0.50 +- 0.40. Direct sulphate aerosol is -0.40 +- 0.20. Direct fossil fuel aerosol (organic carbon) is -0.05 +- 0.05. Direct biomass burning aerosol is 0.03 +- 0.12. Direct nitrate aerosol is -0.10 +- 0.10. Direct mineral dust aerosol is -0.10 +- 0.20. Cloud albedo effect is -0.70 (-1.1, +0.4). Surface albedo (land use) is -0.20 +- 0.20. Surface albedo (carbon black on snow) is 0.10 +- 0.10. Persistent linear contrails is 0.01 (-0.007, +0.02). Solar irradiance is 0.12 (-0.06, +0.18).
The biggest non-GHG factor by far is cloud albedo, and unfortunately, it's not well constrained because cloud modelling is a very difficult process. We get better at it each year, including since the AR4 reports, but there's still a good ways to go. So we'll go with the AR4 number, -0.70 (-1.1, +0.4) W/m^2. However, GHGs are by far the largest factor, and of those, CO2 is the largest.
What's the point of all this? Let's just sum up: Your "10% of observed warming" number is garbage.
-
Re:A couple errors in a 3,000 page document
Wow! That'd be such a zinger if I hadn't repeatedly written "a couple errors". If I had written "a single error", I would be so dissed right now!
These reports are NOT peer reviewed science and DO NOT belong in the IPCC report, which claims to be properly peer reviewed.
You know, do you ever bother to check any of this stuff out by yourself?
I just went to the reports and loaded what is probably the most important from a scientific perspective -- Ch. 2: Changes in Atmospheric Constituents and in Radiative Forcing (the Summary for Policymakers is just a summary of the technical reports, in plain English, and doesn't do refs on its own). If you read Watts, this is all based on WWF reports. Load it. Search for WWF. And enjoy your zero hits. The references run from pages 89 to 106, hundreds of them in this single document alone, and not a single one of them is from the WWF.
-
Re:Shhhh!
The problem is simple. Take a look at how massive the amount of material from the IPCC is. It would take a bloody miracle to not have at least one error in there. They have the unenviable task of summarizing the results of literally thousands of research papers.
Unfortunately, people are going to leap on this as though an error in one paragraph on one page means that all thousands of pages are totally invalid.
-
Re:Deniers
I've posted this before, but heres a non-comprehensive list of the raw data: knock yourself out.
Data:
NOAA NCDC: http://www.ncdc.noaa.gov/oa/ncdc.html [noaa.gov]
NOAA sattelite data: http://www.class.noaa.gov/ [noaa.gov]
ARM data: http://www.archive.arm.gov/armlogin/login.jsp [arm.gov]
NASA GISS data: http://data.giss.nasa.gov/ [nasa.gov]
NCAR data: http://www.ncar.ucar.edu/tools/datasets/ [ucar.edu]Models:
NASA GISS GCMs: http://www.giss.nasa.gov/tools/ [nasa.gov]
NCAR models: http://www.ncar.ucar.edu/tools/models/ [ucar.edu]That being said - I think this whole 'give me the raw data' thing is just a big red herring. What are you going to do with it when you get it? Do you understand all the sources of the data, their biases and errors? Do you understand how they calculated some of the parametrizations in the models for bulk cloud parameters? Do you think its just a matter of plugging the data into a code and getting a Yes/No result about global warming? Come on! Theres a reason this stuff generally requires a PhD or years of experience to understand. But there it is, lots of data. Now shut up about the data or methods being unavailable.
-
Re:Climate change is a security threat
There is a calculation difference of nearly a degree in those climate models, whereas the temperature itself has varied significantly less than that. Do these models really inspire you to trust them? They are not very convincing to me at all.
My point in emphasizing the future projections was to stress that this uncertainty doesn't grow over time (aside from uncertainties as to which emissions scenario we adopt.) But even the "large" uncertainties in current GCMs are small enough to show that anthropogenic greenhouse gases are responsible for the warming since 1970. Even though the two curves have wide error bars, they don't overlap. The entire point of that graph you're fixated on is that the observed temperatures stay within the IPCC's error bars. You couldn't even see the prediction for the temperatures without human greenhouse gas emissions on that plot (as in the Meehl 2004 plot), because they'd be far below it.
-
Re:Climate change is a security threat
And maybe the CIA can spin how record heat waves next summer are a result of global warming as well. Please direct me to a source for "the coldest winter in decades worldwide" statement. They had a record heat wave in Australia in November. The third one in the last 2 years.
Of course weather happens. It's just the noise signal on the climate carrier wave. It's winter and we expect cold weather. Sometimes records will be set. Across the Continental US in the 2000's the ratio of record highs to record lows is 2.04:1. In the 1990's the ratio was 1.36:1. Those are the kind of statistics that have something to do with global warming.
Personally, I see far more twisting of facts coming from the anti-global warming side of the argument.