 Slashdot Mirror
Domain: advisorperspectives.com
Stories and comments across the archive that link to advisorperspectives.com.
Comments · 23
-
Re:Coddling.
You need to look at the numbers instead of intuition and guesswork. Real buying power rose consistently, and at a remarkably steep rate compared to most of the word, in the US from the 70s to about 2000. It's been effectively flat since then (lots of short term up and down, but little net effect), mostly because the economy has sucked.
Median HHI (but just since 84): https://fred.stlouisfed.org/se...
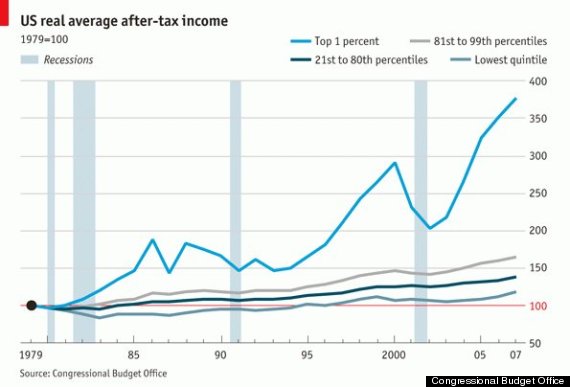
The second chart on this page is good, shows quintiles: https://www.advisorperspective...
You might find the total inflation-adjusted growth by quintile enlightening.
-
Re:Those who were there vs those who were not
The home ownership rate is higher today than in 1967.
Median home prices are about the same today as they were in 1967 after you adjust for inflation.
Mortgage interest rates are lower today than in 1967.
Median income is up for all quintiles since 1967 after adjusting for inflation, even the bottom two. Meaning the home price to income ratio has fallen since 1967 (you need to use a smaller percentage of your income to afford a home).
I'm sorry for your situation, but you are an outlier. Not representative of the norm. Home ownership is easier today than in 1967.
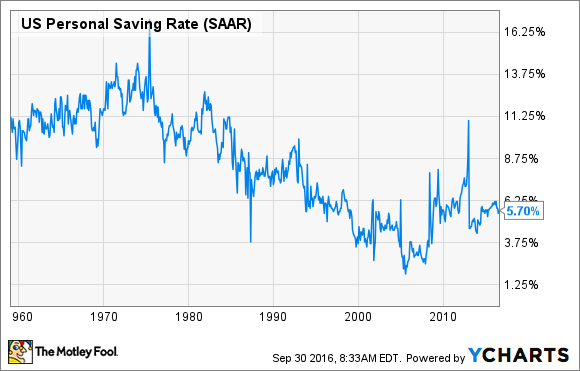
If you want to know why you Millenials are having a hard time buying a home, the answer is really simple. The savings rate has fallen from 12% in 1967 to about 6% today. Basically, you spent all your money instead of saving it. Contrast this to, say, the UK - where the savings rate has actually gone up since the 1970s. It's not all bad news though. Young people began saving more beginning about a decade ago. Unfortunately, you actually had a negative savings rate from about 1995-2007 (you were spending more than you made). So combine your higher savings rate with paying off your accumulated debt, and you can't afford to rent an apartment so you end up living in your parents' basement. -
Re:work less
compensation per hour worked has also increased.
Citation needed.
This (using Census Bureau data) suggests that for most families, inflation-adjusted incomes have been declining for most families since the year 2000.
-
Re:I appreciate using the correct Unemployment met
I dispute those numbers.
There has been a very real growth in nominal median household income, while people claim that real household income is flat even as far back as pre-1970.
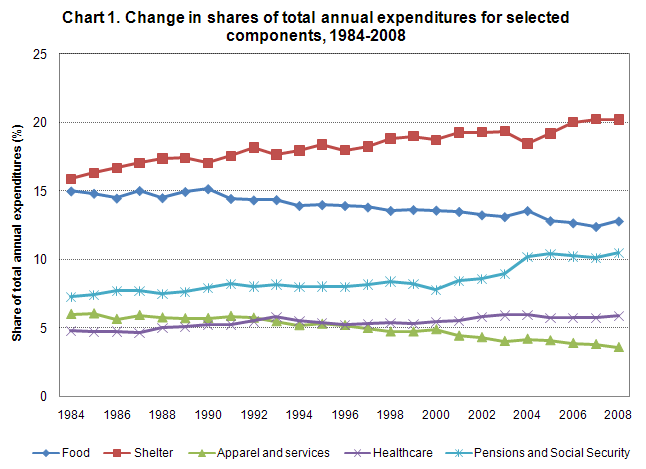
Meanwhile, we see in the long term reductions in the percent of that income spent on food and clothing, as well as a 31% increase in spending on shelter while the median size of shelter increases by 56% and the household size (persons) decreased by 15%. That means spending 84% as much on shelter (and 71% per area per person, but that's irrelevant except to say that we're not cramming lots of people into cramped little spaces).
Even since 2005, the food expenditure was 13% and it's now under 12% (personally, it's 3.9% for me, and I eat out a lot--frequently spending $15 for one meal, but not nearly on every meal). Across the past decades, people have been enabled to put more money into savings, buy more and better healthcare, and spend much of their money on entertainment and other discretionary spending.
That doesn't even get into what accounts for "equivalent goods and services" these days.
Dual-core desktops hit the market in 2005. That's quite a shock compared to 66MHz 486DX or 200MHz Pentium Pro chips that cost $200. Never mind the constantly-falling price of RAM, hard disk, and SSD. PCs, costing thousands of dollars in the early 90s, were $350 commodity items in the mid-2000s.
Cell phones of 1983 cost $4,000 for the phone and $55/month for the service, plus 42 cents per minute voice. Two hours per week would net you $250/month service. That's a $9,000 phone and $550/month service today. Somewhere along the line, we got consumer cell phones with $100/month service; then we had $250 flip phones, $40/month service, and text and video messaging; and now we have heterogeneous hex-core smartphones with 2GB RAM for $350, backed by $60/month service with high-speed data (although I pay $35/month to Ting instead).
An ISDN 128K line in 1998 cost $35/month and required a $250 modem. Today I get 200Mbps Comcast service over an $80 modem--it's $54,687 worth of ISDN lines all tied together for $83. Do you remember DSL talking about their wicked-fast "three megs" in 2005? I have 70 of those.
Even cars only standardized transistor radio and air conditioning in the 1950s. Now we have antilock brakes, traction control, EFI, complex suspension systems, air bags, vehicle dynamics that prevent rolling and skidding, sensors and cameras to assist in lane control and parking, and all other manner of highly-complex systems with many moving parts. Somehow, we don't pay a bigger chunk of our income for these things: cars cost about the same proportion of our income, but come loaded. This will remain true when we all have self-driving vehicles.
Your argument is essentially that somebody else has told you that we're producing more, we're not earning more, and our buying power is not increasing. My argument is that the percentage of the median income being spent on goods like food, clothing, and shelter square-footage has gone down; people have spent more on luxury, leisure, savings, and medical care; and that the common goods and services we consume have rolled in more stuff we couldn't have afforded years and decades ago, essentially taking the same portion of our money and giving us more stuff in exchange.
Reality suggests buying power has increased. A lot. People like me--at $75,000 income--are pocketing all the extra money. I bought a house and paid off the mortgage in 3 years. I'm getting ready to buy a car, but I have a couple debts I want to clear out first (adding payments on top of other payments is stupid). I bought myself a $7,000 piano for the house. I put $18,000 into my 401(k) and $3,385 into my HSA this year
-
Re:That can't be right
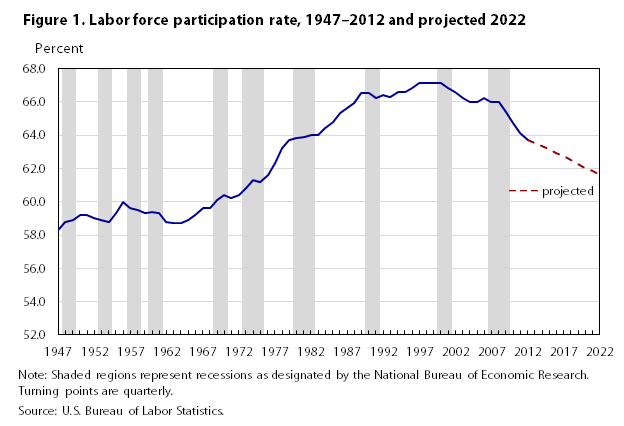
Let's consider just one statistic - workforce participation as a percentage of the population. Around the year 2000 it was about 67%, it has been fairly steadily declining since 2008 from about 67% to 63%...
In other words, 4% less of the working age population is employed.
I'll just mention in passing things like the majority of newly-created jobs being part-time, wages being stagnant for the last 8 years, and a national debt that has increased from an "unpatriotic" $11 Trillion under President Bush to nearly $20 Trillion after 8 years of President Obama...
That is what passes for "generally positive economic growth"?
-
Re: Own It
Only the top 5% really succeeded during the Clinton Administration. The vast majority of Americans have been treading water, or slowly submerging.
-
Re:Affordable for a select few
Everybody has graphs backing up their views:
http://www.advisorperspectives...
I will point out that analyses of workers in specific fields absolutely neglect the unemployed. That pattern of needing to be a local business owner (or otherwise financially not-dependent on your neighbors to grant you a decent income for your labors) repeats through all small towns I have known from Florida, through Alabama to Texas. The free market directly implements the golden rule: he who has the gold, makes the rules.
-
Re: Recession is really a depressionNo, I'm not saying it. You're projecting. I'm saying that the actual food prices haven't gone up significantly.
You make the statement that this is simply due to inflation, as a reminder inflation isn't calculated against all items in an economy(hint: most of those data sets are using the "core inflation number").
You can check the general inflation. It's called "headline inflation" and is tracked separately by BLS: http://www.advisorperspectives... - same result.
-
Re:Doesn't address job quality
If these factors were thrown in the mix, that raw percentage would go way up. I remember reading a statistic a little while back that showed that every net job gain since (I think) 2005 has been due to "gig economy" types of arrangements like Uber driver, etc. That's great for Uber and Taskrabbit and the like, but lousy for someone who needs stable full time work to support a family.
Not even close to reality, the government rates line up pretty well with what ADP reports and since ADP is not going to be aware of gig economy jobs (you don't pay a subcontractor through ADP) the growth numbers have to be primarily coming from traditional employers.
As far as full versus part time, the numbers show we crossed over back in Q1 2015.
-
Re:Yeeeeeahaaaaaw!
You're operating on a vacuum assumption in your own head without looking at the world around you. You go, "Oh, that doesn't make sense to me, so I'll make up bullshit and claim everything based on solid analysis and understanding is made-up bullshit."
Put up or shut up time: predict the next major recession. Right now. Can't? Hmmm.... So, with that out the way, you've made some other major assertions that many just don't agree with:
No, the cost-of-living hasn't gone down; the standard-of-living has gone up.
I'd say inflation has done a number on the median income and reduced disposable income to lower levels. So I suppose it's a good thing those toys cost less, because there is less to spend on them.
I already demonstrated that we're in a labor force participation rate bubble,
TBBA (Truth by Blatant Assertion) Merely pointing at a graph or mentioning various cherry picked statistics doesn't prove a bubble.
Let's not argue so much over *why* labor force participation suddenly grew. Let's ask another question: Why was it so low in 1970? Well, I can find as far back as 1947 at a glance, and the answer is it's always been that low.
Actually, let's do discuss it, because it's quite relevant. You see, in the late 60s, with women's lib and societal upheavel in the US and the rejection of the June Cleaver role, women actually demanded that they be treated as equals in society. Because of the aforementioned appliances etc, they had more free time and they not only went to work but stayed at work, developing careers as a normal activity. That increased the labor pool, it was not a bubble, but a raising of the available level. Now you can dispute that the pool got bigger or address the drop off since the peak, but you can't say the increase was a bubble as several fundamental shifts in society occurred to drive that effect. That would be like saying an asteroid only caused some minor temporary damage 65 million years ago.
Globalization started in the 19th century--some economists want to take this back further--with the reduction of shipping costs. That whole shipping textiles and spices and liquor around? That's outsource labor, pushing manufacture to cheaper labor markets.
Really? Try the 70s for when textiles really started losing business fast. You're seriously stretching there with ancient trade. That trade was for goods unique to production areas, not a move to replace domestic production with cheaper foreign production. It's a simple test really, was whatever was being brought in made domestically as well? No? Then it wasn't outsourcing.
At the same time, income per household has increased even as labor force participation decreased, which suggests the jobs we're gaining are higher-paying jobs.
You might want to check your numbers as it is obvious that real median income has dropped since the 70s, with the exception of the last report, which still indicates that median income has dropped since 2000. Add to that that actual cost of living has increased....
First, we don't have a lowered median income.
TBBA - Several links from authoritative sources a
-
Re: Trump just says stuff
Except wages haven't declined. You might notice that when Bush started wage growth at the low end flattened. You could easily attribute to the trade deals and the repeal of Glass–Steagall just prior to Bush Jr. takeover.
-
Market Cap to GDP: The Buffett Valuation Indicator
"it is probably the best single measure of where valuations stand at any given moment." - Warren Buffett
http://www.advisorperspectives...
Both Buffett Indicator And Shiller P/E Continue To Imply Long Term Negative Market Returns; 2015 Market Valuation
http://www.forbes.com/sites/gu...Yes, the market is looking a bit frothy. Locally here in NYC, assets such as real estate are looking pretty high...
-
Re:Economics is a science!
Also, looking at this graph of Q-ratio, I notice that Q-ratio does not predict the 1992 crash or the 2009 crash (reputed to be a bigger crash than the great depression).
For this hypothesis, what observations would invalidate the predictions made by this theory?
But maybe I'm not spending enough time looking at the numbers, maybe I'm not reading deeply enough.
Perhaps we should look at the "percent from its arithmetic mean", or maybe the "change from its geometric mean", or the "real S&P composite and the Q-ratio adjusted to its arithmetic mean", or the "net worth over market values outstanding"...
All of which can be found on this fine article.
If we look at the numbers in enough ways, I'm sure we'll find something that has a P < 0.05, then we can publish!
-
Re:It's finally time
http://www.advisorperspectives...
80% of people make less than $185,206 household income, 95% make less than $322,343, so 90% being around 200k is possible. Household income Personal income.
-
Re:Why America dont do the same.
For many, they honestly don't have the extra 10% to spend. Look at some charts of inflation adjusted income since the 60's.
Something like this: http://www.advisorperspectives... -
Re:Driving isn't fun anymore
The article only notes that teenagers are driving much less. Total miles driven has only declined very slightly in the last few years (starting with the recession), and was steadily climbing for decades prior to that.
Here's a chart: http://www.advisorperspectives.com/dshort/updates/DOT-Miles-Driven.php
-
Re:Of course, he'll have affluenza
Close.. but not exactly.
Try a median of 51k.
However that median is brought down by young kids who don't have children who go to university.
The typical wage earners in a family that send their kids to university will be arround the 45-55 mark (having had the kids around 25-35)
http://advisorperspectives.com/dshort/updates/Household-Incomes-by-Age-Brackets.php
backs my figure up, and earning twice what the average earn (pre-tax) doesn't make you rich, it's just a divide and conquer that the truely rich like to put out there.
$150k a year for your household means you can afford a hosue about $400-450k, something like http://www.trulia.com/property/3029951135-8514-S-124th-St-Seattle-WA-98178, sure a nice house, but not rich by a long shot.
-
Re:No such thing as a corporation tax"In theory, low capital gains rates encourage investment over consumption, which is good for long run growth."
If anything, it seems like there is a surplus of capital, with no good place to invest it. Interest rates are nil, and so are market returns. Since the height of the bubble in March of 2000, "Total return, including reinvested dividends, certainly looks better, but the real (inflation-adjusted) purchasing power of that $1,000 is currently, over 13 years later (4 OCT 2013), is only 10 bucks above break-even." (cite.)
I think there is not enough consumption to grow the economy because too much of the wealth is tied up in the accounts of extremely wealthy people who already own everything money can buy. When a poor or lower middle class person gets their paycheck, they spend it immediately (if not sooner, through increased borrowing), thus creating jobs and higher overall productivity.
-
Re:Definition of a cap
> Wages in the US have not been on an inevitable downward march,
Adjusted for inflation, this statement is bullshit. Since 1999, household income has *fallen.* That's 14 solid years.
But hey, you go look up these facts yourself. They're googleable.
--
BMOUmm, I'm not sure where you got your data since you didn't provide a source, but googling produced something different. Inflation adjusted wages have been pretty flat since 2000 at every income level. I actually have graphs to back this up. The bottom shows them going up from 2000 to 2007 and then dropping as would be expected in a recession.
http://www.advisorperspectives.com/dshort/charts/census/household-income.html?household-incomes-mean-real.gif
http://en.wikipedia.org/wiki/File:US_real_median_household_income_1967_-_2011.PNG -
Re:Using real numbers rather than invented numbers
Mmm, those are interesting numbers. They seem quite low, though.
How about these:
http://www.ofm.wa.gov/trends/economy/fig101.asp
http://www.demographia.com/db-pc1929.pdf
http://www.advisorperspectives.com/dshort/updates/Household-Income-Distribution.phpLooking at the last one, it seems that the xls describes income levels for the 4th quintile. Do you have a link to the page that links to the xls?
-
This is a slice of a bigger phenomenon...
Y'all are making excuses for a much larger phenomenon. The implosion of the middle class. Here's a comparison of wage growth for Americans from 1967 until 2011. Look at the various jumps in the curve. You can see the big jump in the late sixties of the lowest quartile, the clear results of the war on poverty. The economic doldrums at the end of the Carter Administration. The sudden increase during the Reagan first term, but take special notice of how the rise benefits the upper quintile and even more so the top 5% (and if you could see the top 1% and top 0.01% I think you'd see something shocking.) The subsequent fall during the senior Bush Administration followed by the boom of the Clinton years (and make no mistake, the booms during both Reagan and Clinton involved huge economic expansions in industry, heavy industry for Reagan and information industries for Clinton. Then junior Bush's Terms, and here's where it get's interesting. Notice the steady decline in advancement. The majority of Americans are seeing their wages crashing towards stagnation or worse. In fact looking at the lowest quintile, over the last 10 years they've had a 20% drop in real wealth. Even the first quintile has remained stagnant with extreme fluctuation. So this is not just an IT thing. The only folks to see dramatic increase in personal wealth over the last 10 years I in a group smaller than the top 1%.
While that was going on, the real wealth of Americans at large has been disappearing. Here's a brilliant lecture on the looming collapse of the Middle Class and the economic forces responsible for the situations we all face today. Contrary to pundits conversations Americans spend significantly fewer inflation adjusted dollars on food, clothes, appliances and cars. Where they are getting killed is Cost of Housing, revolving credit and loan debt, Medical Insurance and drugs, Child Day Care, Cost of Fuel/Energy, that and there are new expenses surrounding electronic gadgets that have been a steadily growing part of the cost of living since the late 80s.
The Banks (both in banking, loans and real estate), Big Medicine/Pharma, and Energy have put the American Family in such a precarious position, that any small disruption or disturbance results in almost immediate financial collapse. The critical events facing Americans are Death of a spouse, Injury or Serious Illness, Divorce and extended Unemployment. Any of these (singly or in combination) are enough to initiate a cycle of debt, penalties and ultimate bankruptcy. Add to this growing inflation and the erosion of our savings and investments, and you can see that the American Family is under extraordinary financial stress. The American dream for a growing population is just being able to get by.
-
Re:Two things...
Just in case anyone believes this, federal taxes in the US are at their lowest point in living memory, and the US's social safety net would be considered a sad joke almost anywhere else in the developed world (The fact that its for-profit healthcare system is allowed to hang the most expensive medical millstone in the world around the neck of every business here, and that Americans routinely go bankrupt because they have the temerity to get seriously ill and not be rich doesn't help).