 Slashdot Mirror
Domain: bom.gov.au
Stories and comments across the archive that link to bom.gov.au.
Comments · 109
-
Re:So?In Australia, the seasons are defined by grouping the calendar months.
- Spring - the three transition months September, October and November.
- Summer - the three hottest months December, January and February.
- Autumn - the transition months March, April and May.
- Winter - the three coldest months June, July and August.
-
Re:No links
No links? The article that was liked to contained links to both the report summary, from which you can download the full report, and also a sub-site where you can get the data. It might be worth reading the whole article and checking your facts rather than just posting your unchecked reactions.
-
Re:No links
There are links right there in the article to the State of the Climate 2018 report from the Australian Bureau of Meteorology. The report addresses most of your issues, and has plenty of embedded references that you seem to have missed because they weren't all bundled up in the end-matter.
But you probably didn't have time to look into that without sacrificing first post.
-
Re:Progress
Yes it does.
But both phenonema have the exact same effect: only at different places on the earth. While El Nino makes is cold her and warm there, La Nina just reverses that.
So: the average temperature as far as the two ENSO extremes are concerned: are the same.E.g. look at the maps here: https://www.climate.gov/enso
The BoM used to have good maps, but they reworked the website so I don't find them right now, but here is a start: http://www.bom.gov.au/climate/... -
Re:This is stupid...
Around here (New-Caledonia) marine weather forecast is in UTC.
It seems to be the same in Australia : http://www.bom.gov.au/products...
-
Re:El NinoWe don't get an "El Nino" every year, there is an El Nino (heating) / La Nina (cooling) cycle.
El Nino events are associated with a warming of the central and eastern tropical Pacific, while La Nina events are the reverse, with a sustained cooling of these same areas. These changes in the Pacific Ocean and its overlying atmosphere occur in a cycle known as the El Nino-Southern Oscillation (ENSO).
-
Re:El Nino
Neither El Nino is supposed to heat the globe nor La Nina is supposed to cool it.
Both phenomena simply change wind patterns and surface currents in the ocean, and hence lead to different didtributions of warm and cool water and hence rain patterns.That is all.
Except for perhaps more clouds (globally?) none of them has any effect on global warming, and my bet would be that El Nino causes more clouds and hence has a cooling effect.
The idea that El Nino is heating up the earth is a
This is an El Nino ocean temperature distribution picture: http://www.bom.gov.au/climate/...
This is an La Nina picture:
http://www.bom.gov.au/climate/...As a laymen you can not even guess which is which.
And as final note: both phenomena are restricted to the Pacific and have e.g. no influence on the weather of Canada, most parts of the US, Europe or Africa or Asia/Russia/Siberia.
The idea that one of them has an warming effect or cooling effect on the globe is completely ridiculous, even if you know nothing about the phenomena it should be obvious to everyone.
-
Re:Problem being
Neither does a La Nina effect globaly cool the planet nor does a El Nino effect heat it.
Both effects are mostly focused on the southern part of the Pacific and more important:
both simply have cold and warm temperature anomalies simultaniously
Here you can see how a La Nina changes surface temperatures: http://www.bom.gov.au/climate/...
And here the same for an El Nino: http://www.bom.gov.au/climate/...In those particular examples, bottom line the areas where it is warmer than "usually" is in the case f the la Nina, significantly bigger than in the case of the El Nino.
In the global picture both El Nino and La Nina are completely irrelevant regarding global warming.
-
Re:Truly ironic
Tuvalu, really? Plotting the data and running a linear fit results in a 0.3mm change per year, at best. That's about 1.2 inches per century/ I guess that's an obvious rise?
-
Re:DUH!!
Extreme weather events have been decreasing in number and possibly intensity for decades in Australia.
Here's some results for Onslow, WA
The Bureau of Meterology has this to say about cyclones in its Climate Change report:
Potential changes in tropical cyclone occurrence and intensity (a measure of wind speed alone rather than the amount of precipitation or coastal flooding) are discussed in detail in the 2007 report, Climate Change in Australia, Technical Report. There is substantial evidence from theory and model experiments that the large-scale environment in which tropical cyclones form and evolve is changing as a result of greenhouse warming. Projected changes in the number and intensity of tropical cyclones are subject to the sources of uncertainty inherent in climate change projections. There remains uncertainty in the future change in tropical cyclone frequency (the number of tropical cyclones in a given period) projected by climate models. -
Re: Semantics
The sat data doesn't go back very far. The dutch data does. Furthermore, I really have to be clear here... I am not questioning the oceans are rising or that the temps are going up. I question the correlation with CO2 emissions. And if you don't have correlation, then you can't have causation.
As to temp data, I'm not interested in talking about that data set because is basically opaque. Its like that joke computer from The Hitchhiker's Guide to the Galaxy... meaning of life is 42. Its a generalizing and averaging issue. Lets focus on the sea levels and the theory. I can audit those. The I can't audit the temp data. Its not reasonable to cite data that can't be audited.
As to links, here is a fun one:
http://www.bom.gov.au/oceanogr...The dutch link takes a bit more work. I'll get back to that if you're open to debate. The issue and the good thing with the dutch data is that it is raw. Also when the dutch started taking these they didn't think the oceans were rising. They just thought the ground was sinking. So their old dike graphs which were kept accurate so they knew how high to make the dikes... Anyway, they're cited as subsistence graphs. But they go back to 1700. The trick is to figure out what the real subsidence was... then tilt the graph so that that line is horizontal. Values above that line are sea level rise and lines below it are sea level fall. Anyway, its a pain in the ass.
Most sea level charts that I see that cite a specific auditable tide gauge show no acceleration in the sea level rise. And where you do see that, if you query that source you tend to find references to a subsistence rate that is not factored into the tide gauge data. When you do that the curve tends to flatten. Look, if I trusted opaque numbers that can't be audited using methodology that is often not fully detailed... then I'd be right there with you and agree with everything you're saying.
I don't trust things that I can't audit. I like information that is either raw or very easily reconstructed because the methodology is detailed specifically enough that I can put whatever transformation in reverse and get the literal original. I don't like super averages of huge data sets. It requires that everything being averaged together be "like" elements. Going through every one of those stations and auditing the information individually is not something I think anyone does when they build these tables. They maybe discard outliers. But I really think you have to go through all those stations one at a time and make sure each one is properly calculated. And that process has to be part of the actual paper that averages them. You have to show in the paper that averages that the things you're averaging can be averaged. Something I'm aware of is that subsistence is a really big problem with these graphs. I really doubt that the majority of people on this site that will tell me I'm a fool for not just listening and believing to whatever you say... I doubt most of them would know what subsistence was if I didn't explain it to them. Once you internalize things like that the political impact of lots of people disagreeing with you becomes ignorable because they didn't look into it at all.
As to terms you won't debate... I won't debate terms that you won't debate. You either debate or you don't.
As to your assertion that science is in fact a democracy, I have no problem with the statement that the consensus is likely to be correct. However, it is not always correct. It is sometimes in error. There are many documented cases of the consensus being wrong. Thus it is a fallacy to say that because the consensus says X that X must be true. You can say that your "vote of hands" idea is often correct. However, it isn't always right. So that isn't evidence of being correct.
As to listening to climate experts... there are climate experts that say many different things and many of them are contradictory. Your policy is to go with t
-
I call bullshitIf you look at the temperature map produced, it shows the vast majority of Australia as being 1-2 degrees Celsius above the base line.
Doing some basic research by going to the Australian Bureau of Meteorology, their report says overall Australia was only 0.21 degrees above the base line...that's a pretty significant difference!
http://www.bom.gov.au/climate/...
I'd love to know how GISS comes up with these over-inflated figures?
-
data
I find you quite arrogant and condescending.
So, basically, you consider it condescending that I insist that you should actually look at data. Real data. Not blog posts.
And you complain that I only gave you a link to one source of data. OK, here are data from four continents:
Berkeley Earth: http://berkeleyearth.org/
Hadley Center Climate Research Unit: http://www.cru.uea.ac.uk/cru/d...
Goddard Institute for Space Studies: http://data.giss.nasa.gov/gist...
Japanese Meteorological Agency: http://ds.data.jma.go.jp/tcc/t...
Australian Meteorological Agency: http://www.bom.gov.au/state-of...
NOAA: http://www.ncdc.noaa.gov/cag/t... -
Re:Scientists are government officials too
Citing "Australia right now" in support of "Global Warming" (also known as "Climate Change") is ridiculous
Maybe, unless you have insight into the trends and Australia Now is consistent with those trends. Extremes that would have happened about 2% of the time in the 30 years prior to the 80's were happening about 6% of the time in the 30 years prior to 2010. In the last 15 years they have occurred about 10% of the time: http://www.bom.gov.au/state-of... . This trend of increasing extremes is what we would expect in a warming country: http://www.bom.gov.au/state-of...
The picture becomes even more cohesive if you look at the temperature trend in the context of radiative physics and what we know about the atmospheric CO2 trend.
-
Re:ha ha ha...
Average temperature seems to sit between about 32 and 37 degrees Celsius for Perth. I'm certain if the average were a full 10+ degrees over this, the DC would have been built to accommodate this significantly higher temperature. Not really a useful comparison.
-
The third law of slashdot.
iii - Mention pseudo scientists and one will always turn up to tell you how cold it's been lately.
Troll food: The min temp anomaly map for Australia over the past six months, it's clear minimum temperatures have been warmer across most of the continent. It also clear that maximum temps have been well above average for the same period. -
Re:And the US could turn Russia into vapor
I don't think "spring" has a standardized or universal definition. There is certainly no "official start of spring" or other such nonsense. I believe the National Weather Service in the US goes with March 1. Austrailia seems to agree, though obviously it is swapped with autumn down under. The UK seems to "officially" recognize both the astronomical and traditional definitions.
-
Re:No, tides at Bowen are much lower.
You've got your location wrong. The tidal range at Abbot Point is less than 4 meters.
http://www.bom.gov.au/oceanogr...
I should have specified that I mean 1000Kms north and it was from memory. I don't see that they would be much more than you say - thanks for the info.
-
No, tides at Bowen are much lower.
You've got your location wrong. The tidal range at Abbot Point is less than 4 meters.
-
Re:more information here
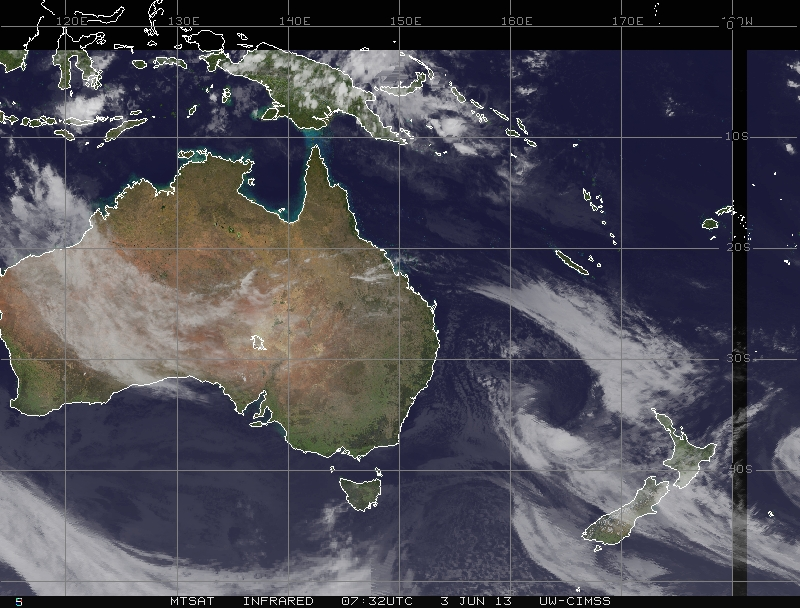
Good thread. If someone Evi loved and respected were lost at sea, she might want to help organize a crowdsourced search and rescue effort like the one used in search of Jim Gray, Tyler Wright and Steve Fosset. What we need is data. As someone who has sailed for decades, I won't underestimate the scope of the effort. VHF radio doesn't reach much beyond the horizon and a mast of a ship that size wouldn't be seen or return a RADAR reflection more than about 7 miles under ideal conditions. So if EPIRB, HF and Satellite are down, the ship only has a 6 or 7 mile radius of observability, less if it has been dis-masted. (Somewhat likely given the conditions.) But the Tasman sea is huge so we need to use data to focus the search effort. The coast guard has a protocol which does this, based on tidal and weather patterns. But we can extend this based on the particular kind of boat, how well it sails into the wind, how fast it is, the captain and crew's behavior and the recommendations to go south of a low on June 3rd, 2013. Apparently GPS coordinates weren't part of Evi's last broadcast. But we can take the same reasonable assumption that I've see rescue people speak of, that they were in th center of the storm. Here is a weather satellite photo of the area on June 3rd. The storm seemed strongest at about 38S 165E. If they were in the thick of it by June 3rd, they were already pulled south of the rhumb-line to their destination, they might have drifted or been forced even further south. The storm grew stronger for at least another day as it moved east on June 4th. If they were ahead of (West of) the storm, they were almost certainly pushed north and west because lows circulate clockwise in the southern hemisphere. If they were behind it they may have been pushed south but I think this is less likely since they should have been already pretty far from NZ and the storm was moving east as they were moving west. Here are the weather satellite photos for the rest of June. But what we need are high resolution satellite or aircraft photos. Unfortunately this part of the world at this time of year is covered in clouds much of the time. Even the recon mission photos might not show much. So like the guy who looks for his keys under the streetlight, we might be limited in where we can crowdsource search. If someone were really industrious, they'd send out drones or balloons equipped with high resolution cameras. It's still a needle in a haystack, but its something. And if it helps bring these people home, it's worth it. If you ever want to read a harrowing story about someone lost at sea, only a few dozen miles from shore in the relatively tiny Irish sea, read the story of Fastnet 79, "Left for Dead." Evi, we're not giving up on you or the rest of the crew so keep hopeful and focus on yours and your friend's survival.
-
Re:and in tsunamis?
I don't think that would be a problem at the water depth they're talking about. Even a very powerful tsunami would only be about a 3m wave at those depths.
Here's an interesting write up about how tsunamis work. -
Welcome to Australia
Two weeks ago we had massive fires across about a quarter of the continent.
But that's alright because the fires are being put out by a cyclone/rain depression.We're in Brisbane surrounded by flooding which has gone from the top of the cape
and is now going down into N.S.W.For you small minded people that's over 3000 Km in a week.
http://www.bom.gov.au/australia/charts/synoptic_col.shtml
http://www.bom.gov.au/australia/charts/viewer/index.shtmland it's still going down the coast probably run out to sea tomorrow
down N.S.W. south coast, but it's still pissing down here.If you have your head where the sun don't shine,
I don't expect you will notice the drastic weather.The only good thing about global warming is the surf is only going to get better.
Cyclone swells. -
Re:Thanks
need to add the weather events to the map
Cat 4 cyclone off WA -
Re:Headline will read:
The Black Saturday fire a couple of years back was also throwing spot fires 20km down wind. That was the hottest day on record for Victoria. The conditions are similar now, the day the fires started was the hottest day ever in Tasmania. I've lived in Oz for 50yrs, we used to get this sort of catastrophic bushfire once every 20yrs, it seems to be once every 4-5yrs since about the mid 90's. El-Nino conditions returned last April, I think people are going to stop complaining about the cost of the desal plants when this new drought starts to bite so soon after the last one.
-
Re:Ah, so there we go....
You can plainly see from the blue lines on that graph that the 1993 altimetry data does not start on "an unusually low year" - that trough is clearly the 1997 El Niño. The Funafito data starts years later, and the other data starts years earlier. Your other points about cherry picking kind of fall down when you can't even get that right. But please keep telling me how my claims are confused.
You can propose alternate hypotheses all you like, but if you want anyone to take them seriously, you'll need to actually present observational evidence that supports them. So far all you've done is claim that that Becker's data is not accurate enough, despite not having laid eyes upon that data, or knowing anything about its error bars, and despite the other studies. Why should anyone listen to you, instead of a sizeable group of scientific experts who do this for a living?
You deny my claim about linkage to AGW with nothing more than "just isn't right", but it's not even me who's making these claims. I'm just pointing out the many studies by people far more expert than I (look, here's a few more reports that show continuing sea rise far exceeding subsidence). If you feel you know their jobs better than they do, go right ahead and tell them that, but I expect they'll find your unsubstantiated denial even less convincing than I do.
-
Re:Another possibility
Like you, I don't ascribe one strange season to CAGW or its absence It's still interesting
-
Re:Before you buy Dr. Hansen's goldmine, check it
Weather is getting more severe
Not according to science.
The bar chart below indicates there has been little trend in the frequency of the strongest tornadoes over the past 55 years.
http://www.ncdc.noaa.gov/oa/climate/severeweather/tornadoes.html
Several studies show that the anomalous long-lasting Russian heat wave in summer 2010, linked to a long-persistent blocking high, appears as a result of natural atmospheric variability.
http://journals.ametsoc.org/doi/abs/10.1175/MWR-D-11-00249.1
The problem is actually one of age of man
-
Re:More proof that carbon pollution costs the econ
Well, I asked the CSIRO and they said "The recent South-East Queensland (SEQ) drought was likely caused by shifts associated with climate variability over decades rather than climate change". Oh wait, you mean the floods. I asked the BoM who show this one was mild compared to historical events. See, there's this thing called El Nina that was responsible for the floods of the 1890-1900s, 1940s and 1970s as it was of the floods of today. Weather is not climate.
-
Re:If you can predict the weather 100 years from n
That was not the consensus view
No, I guess the consensus view then was that the globe was uncontrollably cooling due to man's pollution.
You are mistaken. The greenhouse effect has nothing to do with greenhouses.
Greenhouse gases in the atmosphere behave much like the glass panes in a greenhouse.
That was easy. Greenhouse effect is a unproven theory that lies at the heart of AGW. I'm telling you it's just a theory just like AGW is, and you should avoid calling it fact when it is not.
I asked that you explain your theory and make it falsifiable.
You actually quoted me and then went on to not answer the question? You cannot falsify it, can you? Doesn't that make you question the theory? Why not answer that simple question?
The 70's were 0.03C wamer than the 60's. The 80's 0.18C warmer than the 70's. The 90's 0.12C warmer than the 80's. The 2000's 0.24C warmer than the 90's. This is exactly consistent with the theory.
Citation please.
And then the warming stopped?
Fact of decreasing N. American temperatures over the last decade
decreasing European temperatures over the last 8 years (Compare Seasonal Averages) 2001 - 2009
decreasing Australian temperatures over the last decade
But really, you need to provide links to the sources of your information, I'm not going to just take your word for it. If you can't do that than this is sort of pointless. -
Graph of Latest River Height at Ipswich
This is quite beautiful in it's way: Latest River Heights for Bremer R at Ipswich
At the time of writing, the graph seems to have levelled out at what is expected (hoped) to be the peak of the Ipswich floods.
This curve should be repeated a few hours later in brisbane, when the water reaches us. How long this graph remains at it's currently insanely high mark will determine how much of Ipswich and Brisbane get washed away.
Isn't math pretty?
-
Re:Please Donate
While climate change is definitely happening, this current flood is not exactly unique in the history of Australia, just the worst that a whole generation has seen. http://www.bom.gov.au/hydro/flood/qld/fld_history/index.shtml Australia just simply has a history of flooding and droughts. It's up to you to personally decide if these people who have lost their homes, cars, possessions, and I might point out ALL their Christmas presents, 'deserve' donation money.
-
Remember when you're reading this...
Remember when you're reading this that it's currently summer down here.
In the region (Brisband) the average temperature for this month is around 27 degrees celsius (80 degrees fahrenheit) and average rainfall is around 100 milliliters for the month (6.1 cubic inches).
In fact, the entire country has had an extremely wet summer, and an extremely dry winter for the last year or two.
If you want to feel the effects of climate instability, you just gotta come down here, where it's sunny and 36 degrees celsius (96 degrees fahrenheit) one day and raining and 22 degrees celsius (71 degrees fahrenheit) the next.
It's been fucking insane.
-
Re:Britain/Northern Europe is Ocean regulated.
Yes snow recently fell on the hills around Melbourne (where I have lived for 50yrs) but the December temprature anomally for SE Australia was still 1-2degC above normal. Also it's not as rare as you seem to think to get snow in Oz during summer storms, it happens every 2-3 years.
-
Re:Computers are a dying breed
Thats true. She is mainly interested in "passive" content. She loves the Bureau of Meteorology site for example because she loves to garden, but needs to correlate her gardening with the weather. I set up an RSS feed reader with links to blogs such as boingboing, and news sites, but she is not so interested in those. A tablet would be fine but we are kidding ourselves if we think malware is going to just go away.
-
Re:I usually just point out
Yeah, and some of us have downloaded the numbers and crunched them
Citation needed.
Until then you have no way to compete with NASA GISS, MET and BOM.Now tell us something we didn't know 100 years ago.
Just did, 100+ years of temperature measurements, the measurements do not seem to support your theories which are pretty much unsupported anyway. Your entire post is one giant bare assertion fallacy after another.
-
Overgrazing 70 years ago - Rabbit plague
70 years ago the Rabbit plague was in full swing (until the Myxoma Virus was introduced in 1950's). Rabbits combined with overgrazing it amplified El Ninyos drying effect on Australia (Learning from history: land and pasture degradation episodes in Australiaâ(TM)s rangelands).
Today due to climate changes effects on the ocean currents, El Ninyo could quite possibly become permanent rather than a periodic event - which if happens, will freeze eastern Australia in a permanent drought conditions (and South America in permanent flooding conditions). A bit of drought in half of Australia and a few major floods in South America would be the very least of the worlds worries though... climate change screwing up the ocean current system is implicated in the Anoxic event which eventually led to the death of 90% of life on earth
>Climate change is a farce. im a sydneysider, this is the worst duststorm we've had in 70 years
No worries mate, the planet will be just fine. Nothing we can do to the planet short of complete nuclear Armageddon that Mother earth can't recover from in a few million years. Its not the planet we have to worry about... its our survival on it as a destructive, greedy, self serving species - and that's just a random sampling of our "elected" leaders -
Re:c-c-c-c
"Climate change is a farce."
No, farcical is believing an obvious lie such as the claim that an active super volcano is melting either or both poles.
Also you haven't defined "worst dustorm"? - I would assume TFA is measuring the duststorm by the area it covered. In which case this one would be the "worst" of the two since it streached from South Australia to Queensland where as the 1984 one (that I experienced as it rolled over Bairnsdale) only covered Victoria and parts of NSW / S.Australia, at a rough guess that's about 1/4 of the area.
"It's the first year of el nino, the ground is going to be dry"
El Nino has not kicked in yet and it is NOT forecast to do so this year, this dust has accumulated under El Nina conditions. When ENSO does in fact flip to El Nino conditions the ground is going to get even dryer than it already is.
Did you (while reading up on non-existant volcanos), fail to notice that the majority of Aussies are living with strict water rationing laws? Are you unaware that practically all the state capitals in the country are frantically pouring billion$ into building some of the largest desal plants on the planet? Have you not noticed that most aussie grain harvests over the last 10yrs have seen a 50-60% drop in size when compared to pre 1990 averages? Is there not a giant scar on the Victorian bush from what was an upnprecedented firestorm (I say this having wittnessed first hand all three major fires in living memeory, 2009, 1984 & 1968(?) ). Are the hydro plants in Tassie not silent due to lack of water in their recently completed dams? Is Melbourne currently not at it's lowest winter water reserves on record?
Please also explain to us (without invoking invisable volcanos) why an entire forrest of 600yo river red gums has not survived this particular drought, when according to you conditions have been much worse at various times in the last century or so.
Like some of the other replies, I really have no explaination for why people post bullshit like the steaming pile in your post, is it attempted gallows humor? Are you paid? -
Re:c-c-c-c
So that would roughly line up with the 1937-1947 drought, when the following happened:
As the drought extended into 1945, large rivers virtually dried up. By December 1944 the Hunter had ceased to flow along most of its course; by January the Hawkesbury was dry at North Richmond. By April 1945, most Victorian water storages were empty, the Murray had ceased to flow at Echuca, and Adelaide faced water shortages. As far north as Townsville here were water restrictions. Dust storms raged in South Australia, northern Victoria and southern NSW on many days in the summer of 1944-45
I don't know about you, but that's not something I'd like to experience with the current population of Australia. If there's some part of cutting CO2 output that would help avoid such a situation, I'll gladly sign up for it.