 Slashdot Mirror
Domain: lmsal.com
Stories and comments across the archive that link to lmsal.com.
Comments · 49
-
Re:spaceweather.com
Bah
- NOAA SWPC
- CCMC's iSWA
- Helioviewer
- SDO's daily movies
You might also want to check The Sun Today, which tends to have good explanations of what's happened, and they have a few movies for this event.
(disclaimer : I work at the Solar Data Analysis Center, and have worked on some of the sites that I've mentioned, and know the sysadmins for all but one of 'em)
-
Probably THE best way to "watch"...
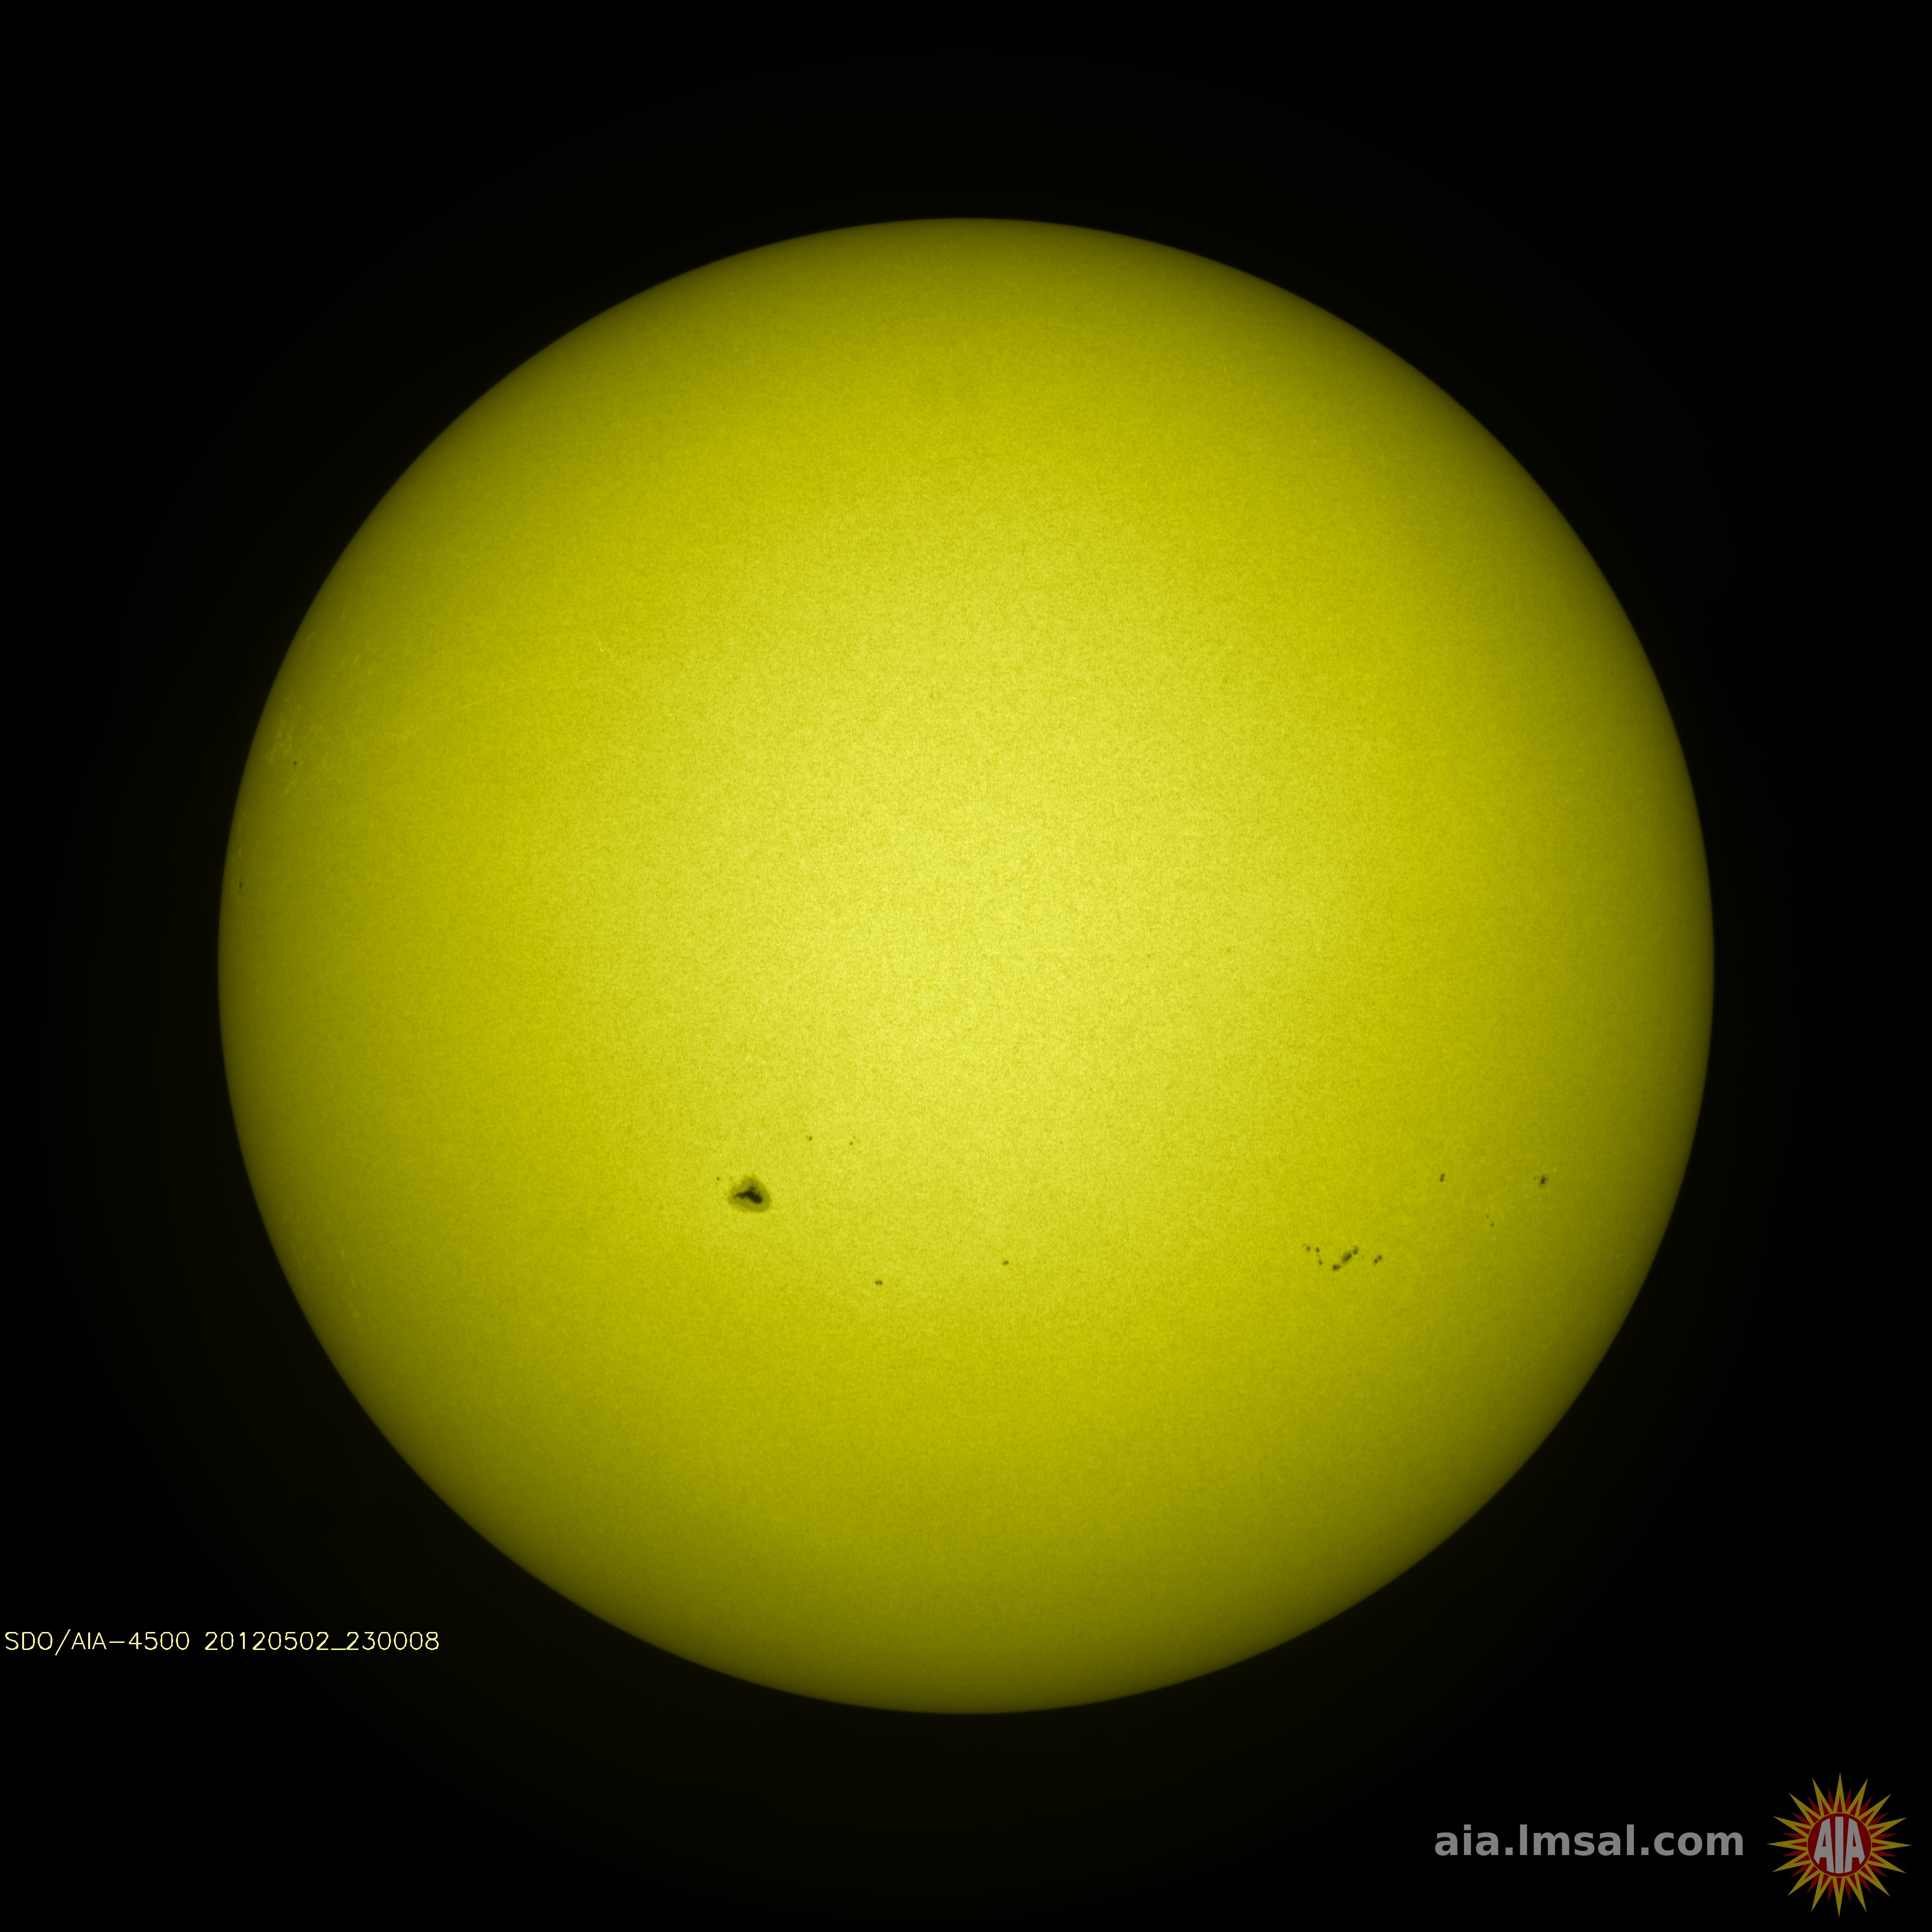
The Sun Today - Atmospheric Imaging Assembly
Most likely the best view: 4500k - Visible Light
Images are updated every 30 minutes.
-
Probably THE best way to "watch"...
The Sun Today - Atmospheric Imaging Assembly
Most likely the best view: 4500k - Visible Light
Images are updated every 30 minutes.
-
All of this has been done / possible / etc.
For #1, there was The Journal of Earth Science Phenomena (hasn't had anything new in over a year), where they'd publish what they called 'micro-articles', which was mostly just a picture and a short description. Unlike a tweet, it actually had some peer-review, and enough information to make the item useful in its own regard. In solar physics, it's not a journal, but there's the Heliophysics Event Registry, where scientists can submit events/features/phenomena, but it's not peer reviewed. (and some are submitted via pipeline processing, so there might not've been any human involved in the detection other than writing the software)
For the negative results, there are plenty of dedicated journals in various fields, and if there isn't, there's always PLoS ONE. It's possible that they might take the irreproducable stuff, too. In their description, they say they'll take anything that's 'technically sound'. They do use a model that's different from other peer-reviewed journals, and go with the author-pays approach, which many of the other journals claim makes them invalid (yet, those same journals charge even more to make your article 'open access' if it gets accepted)
-
Re:And we know this because...?
Look, solar irradiance averages about 1366 W/m^2 and a has a variation of about 1 W/m^2 (using a one-year moving average). That's 0.073%.
You are referring to the Total Solar Irradiance (TSI). But it is not total: the satellites used to measure it have a spectral window from 2000 nm down to 200nm. That leaves out the EUV and X-Ray region. There, the variation is huge. See for example this factor-of-three variation over the solar cycle in the 26-34 nm band.
In the X-ray region variations can be orders of magnitude. Looking at any EUV of X-ray image, it is obvious that the short wavelength intensity from the corona much exceeds the black body radiation coming off the surface. So the conventional view that the EUV and X-Ray region is just an irrelevant tail of the black-body curve is wrong:the flux there is much more intense.
Then there are serious doubts about whether the TSI time series as published are actually all that constant. There have been per-instrument aging calibrations that have removed slopes in the raw data. The question though is whether this slope was really due to aging or due to a systematic trend in the solar irradiance. Also, the long-term TSI curve spans a number of instruments (satellites) with some gap in between. There is a lot of discussion about whether this gap has been bridged without skewing the data towards less variance than there really is.
There. A tiny bit more research shows that the sun can have a rather greater effect on Earth's temperature than it is given credit for.
And no, climate scientists are not familiar with this. The importance of the EUV and X-Ray region has been overlooked in the past and only recently has started to gain attention.
-
Re:Sun - Earth Connections
However, solar variation in radiation is not the cause (this is what is taken into account in climate models) but the magnetic fields and the solar wind appear to play a much larger role.
I would not be so sure about that since there is a bit of a blind spot in the theories, models and observations: EUV and X-Ray radiation. Take, for example, this time graph of the 26-34 nm EUV band. A factor of three or so variation in flux over the course of the solar cycle.
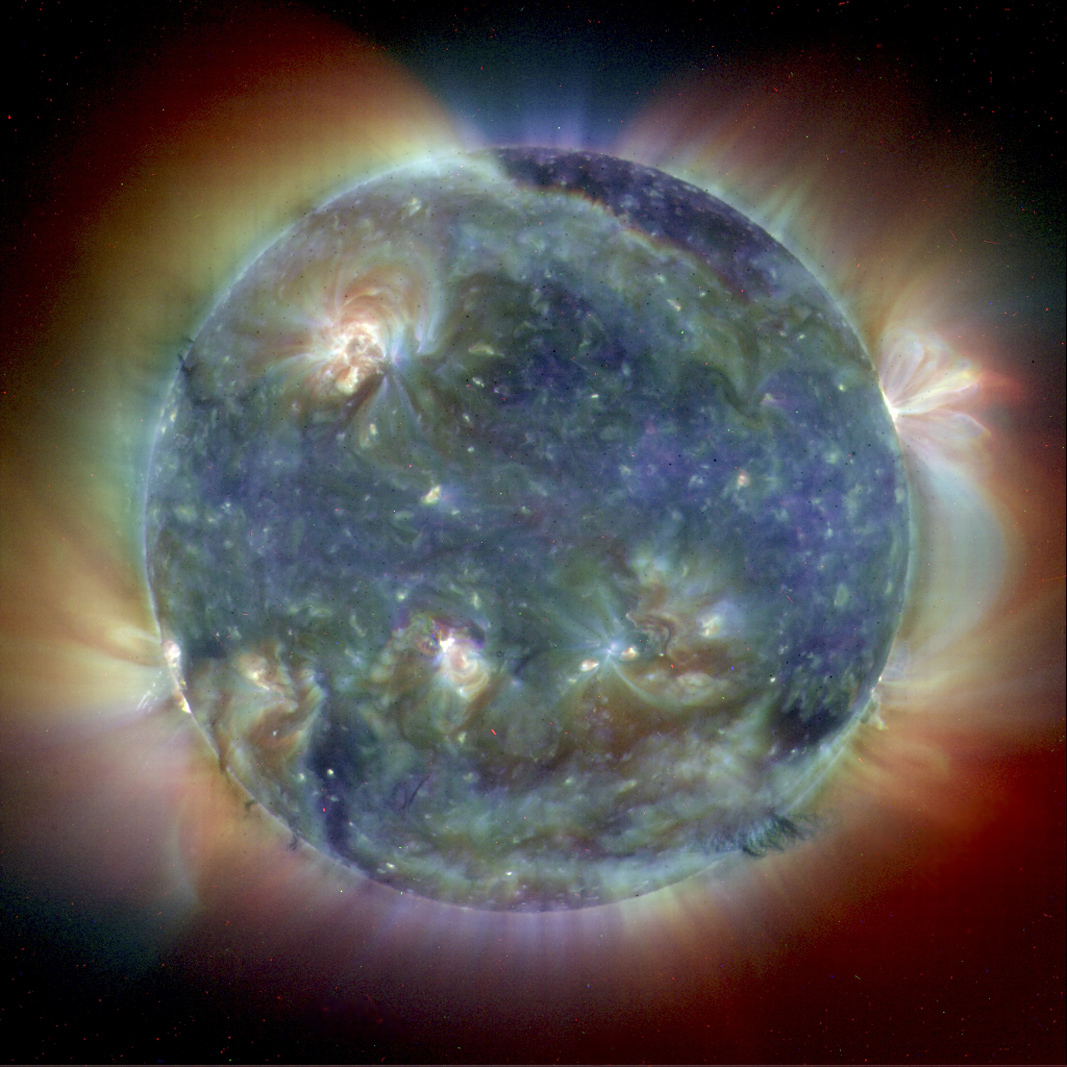
Look at any EUV or X-Ray image of the sun, and it is obvious that we are talking about radiation that much exceeds that what would be expected from the short wavelength tail of the solar black body curve (the surface, which is the source of that tail, appears relatively "dark" at those short wavelengths). Indeed, the spatial distribution of the source of the short wavelength emissions looks determined by magnetic field loops and surface bundles as can be seen in this three-color composite EIT synoptic image in 171 Å (blue), 195 Å (green), and 284 Å (red) . So yes, there is a correlation with magnetic fields and the solar wind, but it is likely still direct EUV and X-Ray radiation (absorbed in the very upper layer of the atmosphere) that affects the climate on earth.
-
Re:What video
The best videos, processed and raw, are available in javascript, flash, and mpg from the lockheedmartin/solarsoft group that handles SDO AIA: http://sdowww.lmsal.com/sdomedia/ssw/ssw_client/data/ssw_service_110606_235609_98013/www/
If you look at the proton monitors in L1 http://www.swpc.noaa.gov/ace/SIS_24h.html and earth geosynchronous http://www.swpc.noaa.gov/rt_plots/Proton.gif orbit there is a very suggestive correlation between this flare and a flux of high energy protons! The timing is about right and the flare itself is positioned such that the parker spiral http://spaceweather.uma.es/solarstorms_files/figura1bc.JPG of the interplanetary magnetic field http://www.youtube.com/watch?v=2434rAbImf0 would put earth in sun spot 1226's path http://i.imgur.com/ZIffl.gif. This tight coupling of timing between the flare time (~06:30:00) and proton arrival (07:00:00) suggests not a coronal mass ejection (that takes days) but instead of weakly relativistic particle beam traveling down the magnetic field lines to earth in only tens of minutes. This interpetation is confirmed by the UMA automatic solar energetic particle forcaster http://spaceweather.uma.es/forecastpanel.htm and later in the day mentioned by a press release http://www.physorg.com/news/2011-06-unusual-solar-storm-disrupt-earth.html.
-
More images -- 4096 x 4096 stills
Lockheed Martin (AIA PI institution) has some of the 4096 x 4096 images available:
I have no idea why they didn't match the same color tables for the 304/171/19[35] images as SOHO and STEREO.
-
Re:Torrent Please
http://aia.lmsal.com/public/firstlight.html
In the "Movies" section.
-
Re:Torrent Please
I am seeding! I imagine until we get a lot of peers direct download from the websites will be better
So, if you download from the web, please seed them
http://sdo.gsfc.nasa.gov/firstlight/
http://aia.lmsal.com/public/firstlight.html -
Re:Prediction depends on an unproven thesis
Are you saying that a significant fraction of the Sun's energy output is at EUV or X-ray wavelengths?
Yes I am.
a black body radiator at just 6000K isn't going to have X-rays as its primary radiation.
True, but the Sun is not just a black body radiator at 6000K. The solar corona has a temperature of 1-2 million degrees Kelvin. Though the corona is not really a black body radiator either, it definitely has massive short-wavelength emissions as evidenced by the X-ray image I linked before. Just look at the solar surface in that image: it is relatively "dark".
The coronal emissions vastly outweigh the surface emissions already at 171 Angstrom as can be seen here.
-
Re:Prediction depends on an unproven thesis
And we know it's not an increase in solar output causing the warming we've observed.
Sorry, we do not know that. The conclusion that it cannot be because of the sun is based on space-based measurements of the total solar irradiance (TSI). These found a fairly stable 1365 W/m^2 (see for example here). But these measurements are wrong! Why? Because the EUV and X-ray part of the solar spectrum is not included.
Take for example ACRIMSAT. It is sensitive only down to 200 nm and as such it wholly misses out on the EUV and X-Ray bands. Moreover, to properly observe the whole x-ray flux you have to capture a fairly wide field of view that includes the corona as this X-ray image of the sun shows.
-
Re:causality is possibly wrong
Though there is little variation at visible and near UV wavelengths, the solar flux has a huge (factor of three) variation with the solar cycle in the extreme UV: http://www.usc.edu/dept/space_science/sem_data/SEM%20Data%20Graphs/SEM_1996-2009.jpg.
EUV and X-ray photons constitute a marked fraction of the total solar output. A much larger fraction than you would expect from the short-wavelength tail of the black-body spectrum of the solar surface. Indeed, these emissions are mostly from the corona, not the surface: EUV at 171A http://www.lmsal.com/YPOP/ProjectionRoom/latest_TRACE_171.html, and an X-ray image http://www.lmsal.com/YPOP/ProjectionRoom/latest/sxt/full/sxtdag_512.gif.
Such high-frequency photons are absorbed in the very upper layers of the atmosphere. However, roughly 50% of the secondary energetic effects (heating, fluorescence, ionization-recombination emission, etc.) will reach ground level instead of going back out into space.
If something here on earth is varying with the solar cycle, the first cause to consider is therefore the solar EUV and X-ray flux.
-
Re:Sea level has NOT been rising
Every climate model that utilizes atmospheric chemistry uses UV since it plays an important role in ozone and methane in the atmosphere.
Please do read before commenting: I was referencing EUV, not UV. That stands for extreme UV. Recent space-based observations of the sun have shown that the EUV and X-Ray components of the solar spectrum are highly variable, are not caused by the short-wavelength tail of the black-body spectrum of the solar surface, but instead are correlated to the solar corona, solar magnetic fields, and solar wind.
The EUV flux graph I linked to shows the variability. To observe the mentioned correlations, have a look at the following EUV (171A) and X-ray images of the sun: http://www.lmsal.com/YPOP/ProjectionRoom/latest_TRACE_171.html, http://www.lmsal.com/YPOP/ProjectionRoom/latest/sxt/full/sxtdag_512.gif.
Has this variation in the short-wavelength part of the solar spectrum, which is obviously highly relevant to climate change, been included in the models you fawn about? No, it has not.
You can read the various refutations of the guys claims.
So predictable: when the official dogma is in danger, the heretic has to be burned.
Do you really think there is a worldwide conspiracy for climate change?
In 1993, the Club of Rome published the book "the First Global Revolution" in which they explained their reasoning behind pushing the environmental agenda. Quoting:
"It would seem that humans need a common motivation...either a real one or else one invented for the purpose....In searching for a new enemy to unite us, we came up with the idea that pollution, the threat of global warming, water shortages, famine and the like would fit the bill. All these dangers are caused by human intervention, and it is only through changed attitudes and behavior that they can be overcome. The real enemy then, is humanity itself."
-
Re:Ingnoring the electric field
In visible light, sunspots look "cooler" than their surroundings. This is because their emissions are further up the spectrum. Take a look at sunspots in the xray region sometime.
Indeed, there are short-wavelength emissions associated with sunspots. But these are non-thermal: it is not a black-body spectrum with an emphasis on emissions at shorter wavelength because of a higher temperature. Were that so, the emissions in the visible would still be higher than for lower-temperature regions since the black body radiation curve not just shifts its peak but also increases in intensity across the spectrum with increasing temperature: http://en.wikipedia.org/wiki/File:Blackbody-lg.png
Moreover, the x-ray emissions seem to originate mostly from the corona and not from the surface: http://www.lmsal.com/YPOP/ProjectionRoom/latest/sxt/full/sxtdag_512.gif. The spatial correlation of coronal activity with sunspots is likely the result coronal plasmas being caught up in the magnetic-field loops pinned down by sunspots. See for example this EUV image: http://www.lmsal.com/YPOP/ProjectionRoom/latest_TRACE_171.html.
-
Re:Ingnoring the electric field
Sure, there are hand-waving mechanisms consistent with the mainstream astronomy view that are interesting to entertain as hypotheses. But if, as you claimed, solar EM phenomena would indeed be well-understood, there would instead be models encompassing the major observable phenomena with quantitative accuracy.
As to coronal heating, a picture does more than a thousand words. Have a look at this soft X-ray image of the sun: http://www.lmsal.com/YPOP/ProjectionRoom/latest/sxt/full/sxtdag_512.gif. Does that not look awfully like energy production in the corona? Not surprisingly, several experiments have been done that have verified the existence of an energy production mechanism under coronal conditions, though an appropriate theory is still lacking. The mechanism occurs in a low-pressure plasma containing helium and hydrogen, see for example http://arxiv.org/ftp/physics/papers/0509/0509127.pdf and http://www.springerlink.com/content/3u3v2eqnv9y1jmwg/.
Pure hydrogen plasmas without helium do not show anomalous energy release. Given that, it can be understood why the solar wind is strongly modulated by how much helium is present: http://www.sciencedaily.com/releases/2007/05/070530114957.htm
-
yep, scientist geeks.
There's lots of scientist geeks out there who interact with the sun. (and by 'interact with', I mean, sit in basements and look at pictures of it)
- http://www.spaceweather.com/
- http://www.lmsal.com/solarsoft/latest_events/
- http://www.sec.noaa.gov/today.html
But I've actually seen some of them go into the big blue room while the glowy thing is still out.
-
Re:yet another cool image
-
Re:yet another cool image
-
yet another cool image
Here is another rather awe-inspiring picture from Lockheed Martin Solar and Astrophysics Lab.
-
yet another cool image
Here is another rather awe-inspiring picture from Lockheed Martin Solar and Astrophysics Lab.
-
A scientist who falsifies data is amazingly stupid...because he knows up-front that others will try to duplicate and build on his work. In other words, if you falsify data you will be found out. That is to say, in addition to wasting your time and others, in the long (or even medium) run falsification cannot possibly succeed.
The example I like to think of is a NASA scientist who worked with my advisor when I was a graduate student.
Our project was a suborbital rocket payload that would pop up above the atmosphere just long enough to snap about 300 pictures of the Sun in extreme ultraviolet (which doesn't penetrate the atmosphere); in some ways it was a prototype for the TRACE spacecraft that is in orbit today. Part of the project was finding a photometric calibration for our photographic film. We would expose our film to extreme ultraviolet that we made at a local synchrotron facility under controlled circumstances, then later measure how dark the film got.
This fellow, call him Mr. Electrolux, developed all the film that we calibrated that way -- but he seems to have failed to write down which processes were used on which piece of film. At the end of the day (we think) he simply wrote down a bunch of processes in a plausible order.
The result? Although he didn't get ridiculed at the moment, once we analyzed the data (three to six months later) we realized that we'd flushed nearly $100,000 and six months of our lives down the toilet because the calibration data didn't make sense and we had to redo the work.
I often marvel at the chutzpah/stupidity that goes with such a move: scientists are in the business of figuring out ground truth, and if you lie it will be uncovered.
-
Re:Obvious question
SOHO has served us well. That said, it's only made of metal plastic and silicon parts and after being blasted by the solar wind for so many years, it's bound to fail eventually. SOHO's replacement is called the STEREO mission. It will actually be 2 separate spacecraft that view the sun simultaneously, in order to acquire STEREOscopic observations of the corona and coronal mass ejections. It was sometimes difficult for SOHO to tell what direction a CME was traveling in because it had only one point of view. STEREO launches in 2005. In the meantime TRACE can do a few of the things SOHO did and while at it, do some things SOHO could never do, like take these SPECTACULAR movies and images of the corona and photosphere at very high spatial and temporal resolution.
-
A federally-funded researcher's point of viewI study the Sun under grants from NASA, through the Southwest Research Institute. Plasma physics in the solar corona is complex enough to require sophisticated numerical methods to understand them, and numerical methods are crucial to current research and theory.
Even ``morphological'' studies are no longer done with magnifying glasses and film, but rather with large collections of digital images from spacecraft such as SOHO and TRACE. Image calibration and reduction software is mandatory if one is to do meaningful experimental analysis.
Fortunately, the solar community has by-and-large been good about releasing analysis tools into the public domain -- in fact, there's a homebrew distribution system that grew up, mostly before CVS, to nearly-universal status within the research community. Without the tools that are available via solarsoft, I literally could not do the work that I do without developing similar things myself (in fact, I do develop tools myself, and publish them... but that's another story)
Even within the relatively open solar community, there are software-based barriers to entry. For example, most of the current community develops in a proprietary language called IDL, which was developed in significant part (in its early years) with public funds. The developer, David Stern, started RSI, inc. to capitalize on his language. Currently, IDL licenses start at $1,000 per year, double the current cost of an entry-level workstation.
When workstations cost $10,000 and only large organizations could afford hardware capable of doing image processing, this cost was excusable. But now, in an era of cheap computers, high connectivity, and readily available space-borne solar data, the cost of supporting IDL is the main barrier preventing hobbyists, high school students, and interested amateurs from doing their own research programs. If IDL were open-source and free, RSI might well still exist (under the Cygnus / Red-Hat business model), and solar (and other) research would be much more accessible to the masses.
One may argue that IDL (and its competing product, MatLab) wouldn't have developed into the large, powerful packages that they are without commercialization. But such arguments are spurious: PDL, the Perl Data Language, is entirely open-source and free, and powerful enough that that I am now devloping tools in it instead of in IDL.
I signed the petition, and I encourage you to, too. Publicly funded intellectual property is your property, just as the national forests are your forests. Demand them.
-
Most modern NASA software is open
Most of the software developed for NASA projects these days is open -- at least, the scientific operations and data analysis software. For example, check out the solarsoft distribution of solar physics analysis software, including planning tools for most existing solar instruments. CVS and Sourceforge it ain't -- but you can get your hands on the actual software that is being used in the SOHO, TRACE, Yohkoh, and HESSI missions (and soon STEREO and Solar-B too).
-
Re:Claim is not unreasonable...
We were looking at images of the solar corona. It's a distributed object with faint gradations in intensity. The biggest problem we had in general with compression was that cosmic ray spikes and stars in the field of view tended to cause "ringing" with JPEG and similar Fourier-type compression schemes.
I figured 0.33 MB per frame because 640x480 is about a half-megapixel, and you'd probably be happy binning it down to 320x240 (more typical of VHS video), yielding an eighth of a megapixel.
Putting in three color planes takes you back
up to something like a third of a megapixel. Eight bits per color plane gives you a third of
a megabyte. (Note that that's not really a good
way to think about it -- usually there's a LOT more information in the luminance signal [the RGB common mode] than in the hue and saturation signals -- so you might need fewer initial bits...)
Our 50:1 figure came from a single, noisy image plane with the criterion that 99% of the pixels had to be within 1 DN (12 bit DN) of the original value, after compression and restoral. The test image on which we applied 50:1 compression was from the TRACE satellite -- click the link for some sample images.
-
Specific example of invalidating prior artThere is at least one specific example of prior art for this patent. It is the SolarSoft distribution system developed by Sam Freeland out at Lockheed-Martin, to distribute solar physics related software across the internet. It uses a web interface to generate a script that runs on the client's machine, pulling pre-configured software across the internet and then updating it regularly.
Solarsoft has been in use since before 1995.
-
Re:What hardware is it running?As for hardware and protocols, I guess it could be interesting as a amateur science project, and NASA are usually quite open about such things. The link posted by lemox, has the e-mail address of the project manager at the bottom of it. Why don't you contact him and ask about the feasibility of building something to downlink data and analyze them. You know, I think most old scientists would provide that inforamtion very cheerfully.
My additional question is what practical use it's information would have today, with all the monitoring equipment we have on Earth and have sent into orbit.
Very little, I'm afraid. There are many more very good instruments, most notably SOHO, TRACE.
However, for a amateur science project, it would be great, as you're working on data from a spacecraft that made history, and you're the only one who does it.
The question remains, how expensive it would be to build an antenna to downlink the signals.
-
Re:Were are the hi-res eyecandy images?Did I miss a link?
No, the link was easy to miss, and then, once you're there, it's easy to think you missed something. Those images only technically satisfy Rob's first rule of art... if you're running 1280x1024 or bigger, they don't quite look like Rob-qualified art. Crisco pulled out the best links for us, though.
I wager that if you write to the folks who run the TRACE gallery site, they will point you to images that you have to scale down to fit on your desktop. At least, this worked for me for Hubble Space Telescope images.
In the meantime, check out the awesome image I use for my desktop. (Tips: Click on the small one to see the real eyecandy. Crop off the credits, and place on black background. Collect compliments from fiends and cow-orkers. Distribute only the original, please.)
-
Here are some that weren't very difficult to find-- as they were linked to from the page CmdrTaco linked to.
Anyway, here are some of my favorites:
http://vestige. lms al.com/TRACE/POD/images/T195_000715_111152.gif
http://vestige. lms al.com/TRACE/POD/images/T171_000930_000227.jpg
http://vestige. lms al.com/TRACE/POD/images/T171_000412_033151.gif
http://vestig e.l msal.com/TRACE/POD/images/TRACEtruecolormosaic.jpg
http://vestige.lmsa l.c om/TRACE/POD/images/T171_0602_14UT.gif
http://vestige
There are a few to start, someone else was moaning about the average 640x480 or so resolution, I say combine a few in The Gimp and give it some extra coloration and you've got a decent desktop. Now too bad I don't have time to make a magnetic-field-line theme, wouldn't it be cool to have those fuzzy lines for your window borders? -
Re:Jesus in the Sky!!
(by the way, I found the Jesus link one one of the pages this story is about)
If you're not wasted, the day is. -
Re:Jesus in the Sky!!
(by the way, I found the Jesus link one one of the pages this story is about)
If you're not wasted, the day is. -
Jesus in the Sky!!
My bretheren (and sisteren), followeth this link to seeth a Divine image of His face... He has gaineth a little weight in the cheeks over the years, but verily, the True Believers will recoginize... the Time is at hand!
If you're not wasted, the day is. -
Better movies of the eventHaven't yet checked out the SOHO page, but TRACE caught it: