 Slashdot Mirror
Domain: noaa.gov
Stories and comments across the archive that link to noaa.gov.
Comments · 2,602
-
Re:Security rules
I'm a little suspicious of the claim that this is being "interpreted in a new way", and it generally sounds like the reporter is more interested in manufacturing controversy for a catchy story than actually figuring out what is going on. The NOAA release says that SpaceX has a license already, so that's not "new". I'm wondering if, in a previous launch, they violated some "conditions" that nobody on either side wants to talk about specifically. Another option would be that there was something special about this launch that fell on the wrong side of the "conditions" of SpaceX's license. But the reporter apparently couldn't be bothered to actually report the story, they just made up something vague and inflammatory that isn't even consistent with their own primary sources.
-
March 18 Geomagnetic Storm
For a real forecast of geomagnetic storms, go to the Space Weather Prediction Center.
There may actually be a geomagnetic storm on March 18. A Kp index of 5 or higher indicates a geomagnetic storm. It's not rare at all, and it's enough to get auroras in the far northern US. The effects of such a storm would be quite minor.
The fake news articles are describing something on the level of the Carrington Event. A coronal mass ejection (CME) comparable to that of the Carrington Event did occur on July 23, 2012. That CME missed the Earth, but had it been directed at the Earth, it could have caused massive damage on a planetary scale. The Carrington Event induced currents in telegraph wires, which caused sparks and started fires. In the present day, it would probably blow out lots of transformers at once, and taking down power grids. The difficulty in replacing all of the damaged transformers would result in long term power outages, which we're just not prepared to deal with. My understanding is that the return period for a storm of that strength is about 150 years. It will happen again, just not on March 18, 2018.
-
Re:Bullshit!
depends on which species your talking about doesn't it?
Here's cod
https://www.st.nmfs.noaa.gov/p...
and you're really gonna sit there and tell me that bluefin tuna catches are the same size since 1980. now that's some bullshit.
fishing is anything but a healthy trade, it's freaking dangerous and overfishing is a well-documented problem.
-
Re:Adios, bureaucrats! There's an app for your job
-
Re:Fastest transition to 3rd world nation?
Hyperbole much?
Just so we're clear, the actual budget for forecasting proposed calls for a 4% reduction in forecasting services, not the 8% suggested by a careless reading of the Washington Post's article, though that may have been their intention for readers. As an aside, the Washington Post is just about as much a joke as Fox News... I can't believe anyone takes their articles at face value.
Anyway, here's the actual budget. You'll want to look at Chapter 5 for the National Weather Service:
http://www.corporateservices.noaa.gov/nbo/fy19_bluebook/FY19-BlueBook.pdfKey take away: the budget for "ANALYZE, FORECAST, AND SUPPORT" services was $492,014,000 but now it's $471,792,000. Will that reduction break forecasting? Perhaps, but I strongly doubt it. More likely, it'll result in cuts to people who have been there for a while, but hardly do anything (legacy folks), yet cost a lot, and/or cuts to open recs that have yet to be filled, or were just recently filled. In other words, people who, despite all of the yammering, are actually expendable with regard to the services they're supposed to provide.
Still, it's easy for partisans, such as yourself, to observe a 4% cut, and babble, "[the US is] transforming itself into a 3rd world country." After all, Trump's suggestion is a bit like suggesting cuts to a fire department: regardless of how much deadweight is involved, there are always going to be fires, and only an 1ns4n3 politician would suggest cutting any of the fat, right?
Oh, and just so you don't dismiss me as a Trumpkin (even though you or someone else probably will), I'm not a supporter, and there's a lot to despise in Trump's budgetary plans. Calling for more military bloat for an already bloated military, for example, is pretty cringe-worthy to me. Still, even if substantial budgetary increases to the military are the wrong call, minor decreases to the weather service may in fact be the correct call to make. It's a major, really unsupportable, leap to suggest that the weather service decrease is a shortcut to 3rd world status, and it just makes you look, well, childish.
-
Re:Analyze all of the data
When they analyze all the data that exists, that's the opposite of cherry picking. [Geoffrey Landis]
Indeed. I made this same point after Jane/Lonny baselessly accused Layzej of "cherry-picking" when Layzej loaded all the UAH data. Jane/Lonny then suggested cherry-picking at 1998, and keeps insisting that this somehow isn't "cherry-picking".
Ironically, I even gave Jane/Lonny R code which calculates trends and accelerations of global mean sea level (GMSL) data. That graph accounts for autocorrelation- the red lines are 2 sigma uncertainties. The trends and accelerations are calculated over periods which all end at 2009.5. The new significance.zip (backup copies) contains my R statistics folder, including many data sets.
Again, note that this approach avoids cherry-picking by using the entire dataset. Also note that all the best-fit accelerations are positive.
Once again, that's consistent with this NOAA article:
"Sea level is rising at an increasing rate
And once again, that's consistent with the 2013 IPCC AR5 SPM:
"Proxy and instrumental sea level data indicate a transition in the late 19th to the early 20th century from relatively low mean rates of rise over the previous two millennia to higher rates of rise (high confidence). It is likely that the rate of global mean sea level rise has continued to increase since the early 20th century."
That's also consistent with the US NAS's statement that "Sea level is rising faster in recent decades".
-
Re:poles
Las Vegas renumbered this year, Seattle has renumbered recently, its a regular thing. depending on where you are the magnetic variation can easily shift 0.5-1.0 deg / year. Usually the runway renumber happens when the mag heading shifts across the 5 deg boundary. most runways are built on ordinal true headings that are then converted to the nearest 10 deg magnetic equivalent for numbering. my local example is DEN - rwys 7/25 and 8/26 are currently both 82.1 mag with 8.4E mag var or 90 true. the mag var in DEN is changing 0.1 deg/yr W ( it was 9.6E in 2005 ). https://maps.ngdc.noaa.gov/vie... lets you look at the mag var over history
-
Re: 2018 making up for it
"All good points... additionally, the global temperature is an average of all weather stations around the globe, the majority of which are found in city center - aka, urban islands, which tends to be warmer than the average temperature of non city centers due to all of the blacktop (roads and rooftops"
Go read about the US Climate Reference Network which has the approval of even the deniers over at WUWT
https://www.ncdc.noaa.gov/data... -
Re:Denial
I would like to see what they historical population ratio has been over the years, and if there is a trend, an anomaly, or if this is in the band of typical.
So would the scientists.
In truth, the only way to determine if this is a problem is to study the species and if they go extinct, then determine why.
Incorrect. They can monitor population trends and cycles, then determine when things are out of the normal range.
Define "normal range: Especially in a long living animal like a sea turtle. http://www.fpir.noaa.gov/PRD/p... Then there is that "historical" bit in the mix. This is where problems occur. You hit on it yourself, so I wouldn't be in such a hurry to diasagree with me agreeing with you.
Animal species populations fluctuate all the time. Sometimes wildly. Chipmunks are a good example, and one that most of us could verify. Some years there are dozens running around my back yard, then a year later, almost none. This correlates with the availability of acorns, which vary in production. The best production of acorns comes in what are called "mast years".
simple terms - lot of acorns = lot of chipmunks. Not many? They largely die off. Fluctuations do tend to work best in rapidly reproducing and short lived animals.
Certainly at the 1 percent male level, most females will not reproduce.
"Most" females may not need to reproduce in a given year to maintain the population. What is the typical ratio range? That information is not provided.
http://www.seaturtle-world.com... Sea turtles reproduce by mating with several males. The females lay eggs around a two year schedule once mature.
There is clearly not enough information to draw any conclusion. But don't let that stop you.
Tell me Mr D from 63 - what exactly was my conclusion? I don't recall making any conclusions.
Do you disagree that we don't have long term data?
Do you disagree that genetic imperfections can cause problems?
Do you disagree that in a widly dispersed population such as seagoing turtles that it becomes difficult to have a harem reproduction strategy?
And do you disagree that temperature plays a large role in sex of many reptiles?
Those are not conclusions, those particular bits are facts.
Rather than drawing conclusions, I was attempting to answer questions that you have shown by your response - that at best you are not taking input, and rejecting any attempts to give you input. That is the conclusion I have made at this point.
Feel free to show what I wrote was wrong.
-
Re:Grab some popcorn
We can't accurately predict the weather for 5 days
Can't predict a coinflip either, yet we can predict very accurately the average result of 10,000 coinflips. Same with climate, which is a long-term aggregate of countless individual weather events. But sure, all those thousands of egghead climate scientists from all over the planet are obviously just making shit up, right? And apparently coordinating it all in a massive global conspiracy.
It's not a fact.
Then how do you explain the vast amount of peer-reviewed evidence supporting it that's cited in the IPCC reports? Gonna wave that all away?
There certainly is a huge monetary motivation to say it's NOT a fact.
Fixed that for you. And if you doubt me, let me know if you find any monetary motivation bigger than $33 trillion in stranded assets. Or perhaps just compare salaries.
Everything they do makes it LOOK like they are covering shit up.
According to whom? Certainly the studies cited in the IPCC reports are about as clear as it can get. Every scientific institution and meteorological department in the world endorses its conclusions - are all of them also covering this shit up, risking their reputations and sabotaging everything science stands for? Or perhaps other interests just want you to think so? There's certainly plenty of direct evidence for that.
You want data? Oh we deleted it.
You have an opinion we don't agree with?
Then provide evidence to back it up, or STFU. That's how science works.
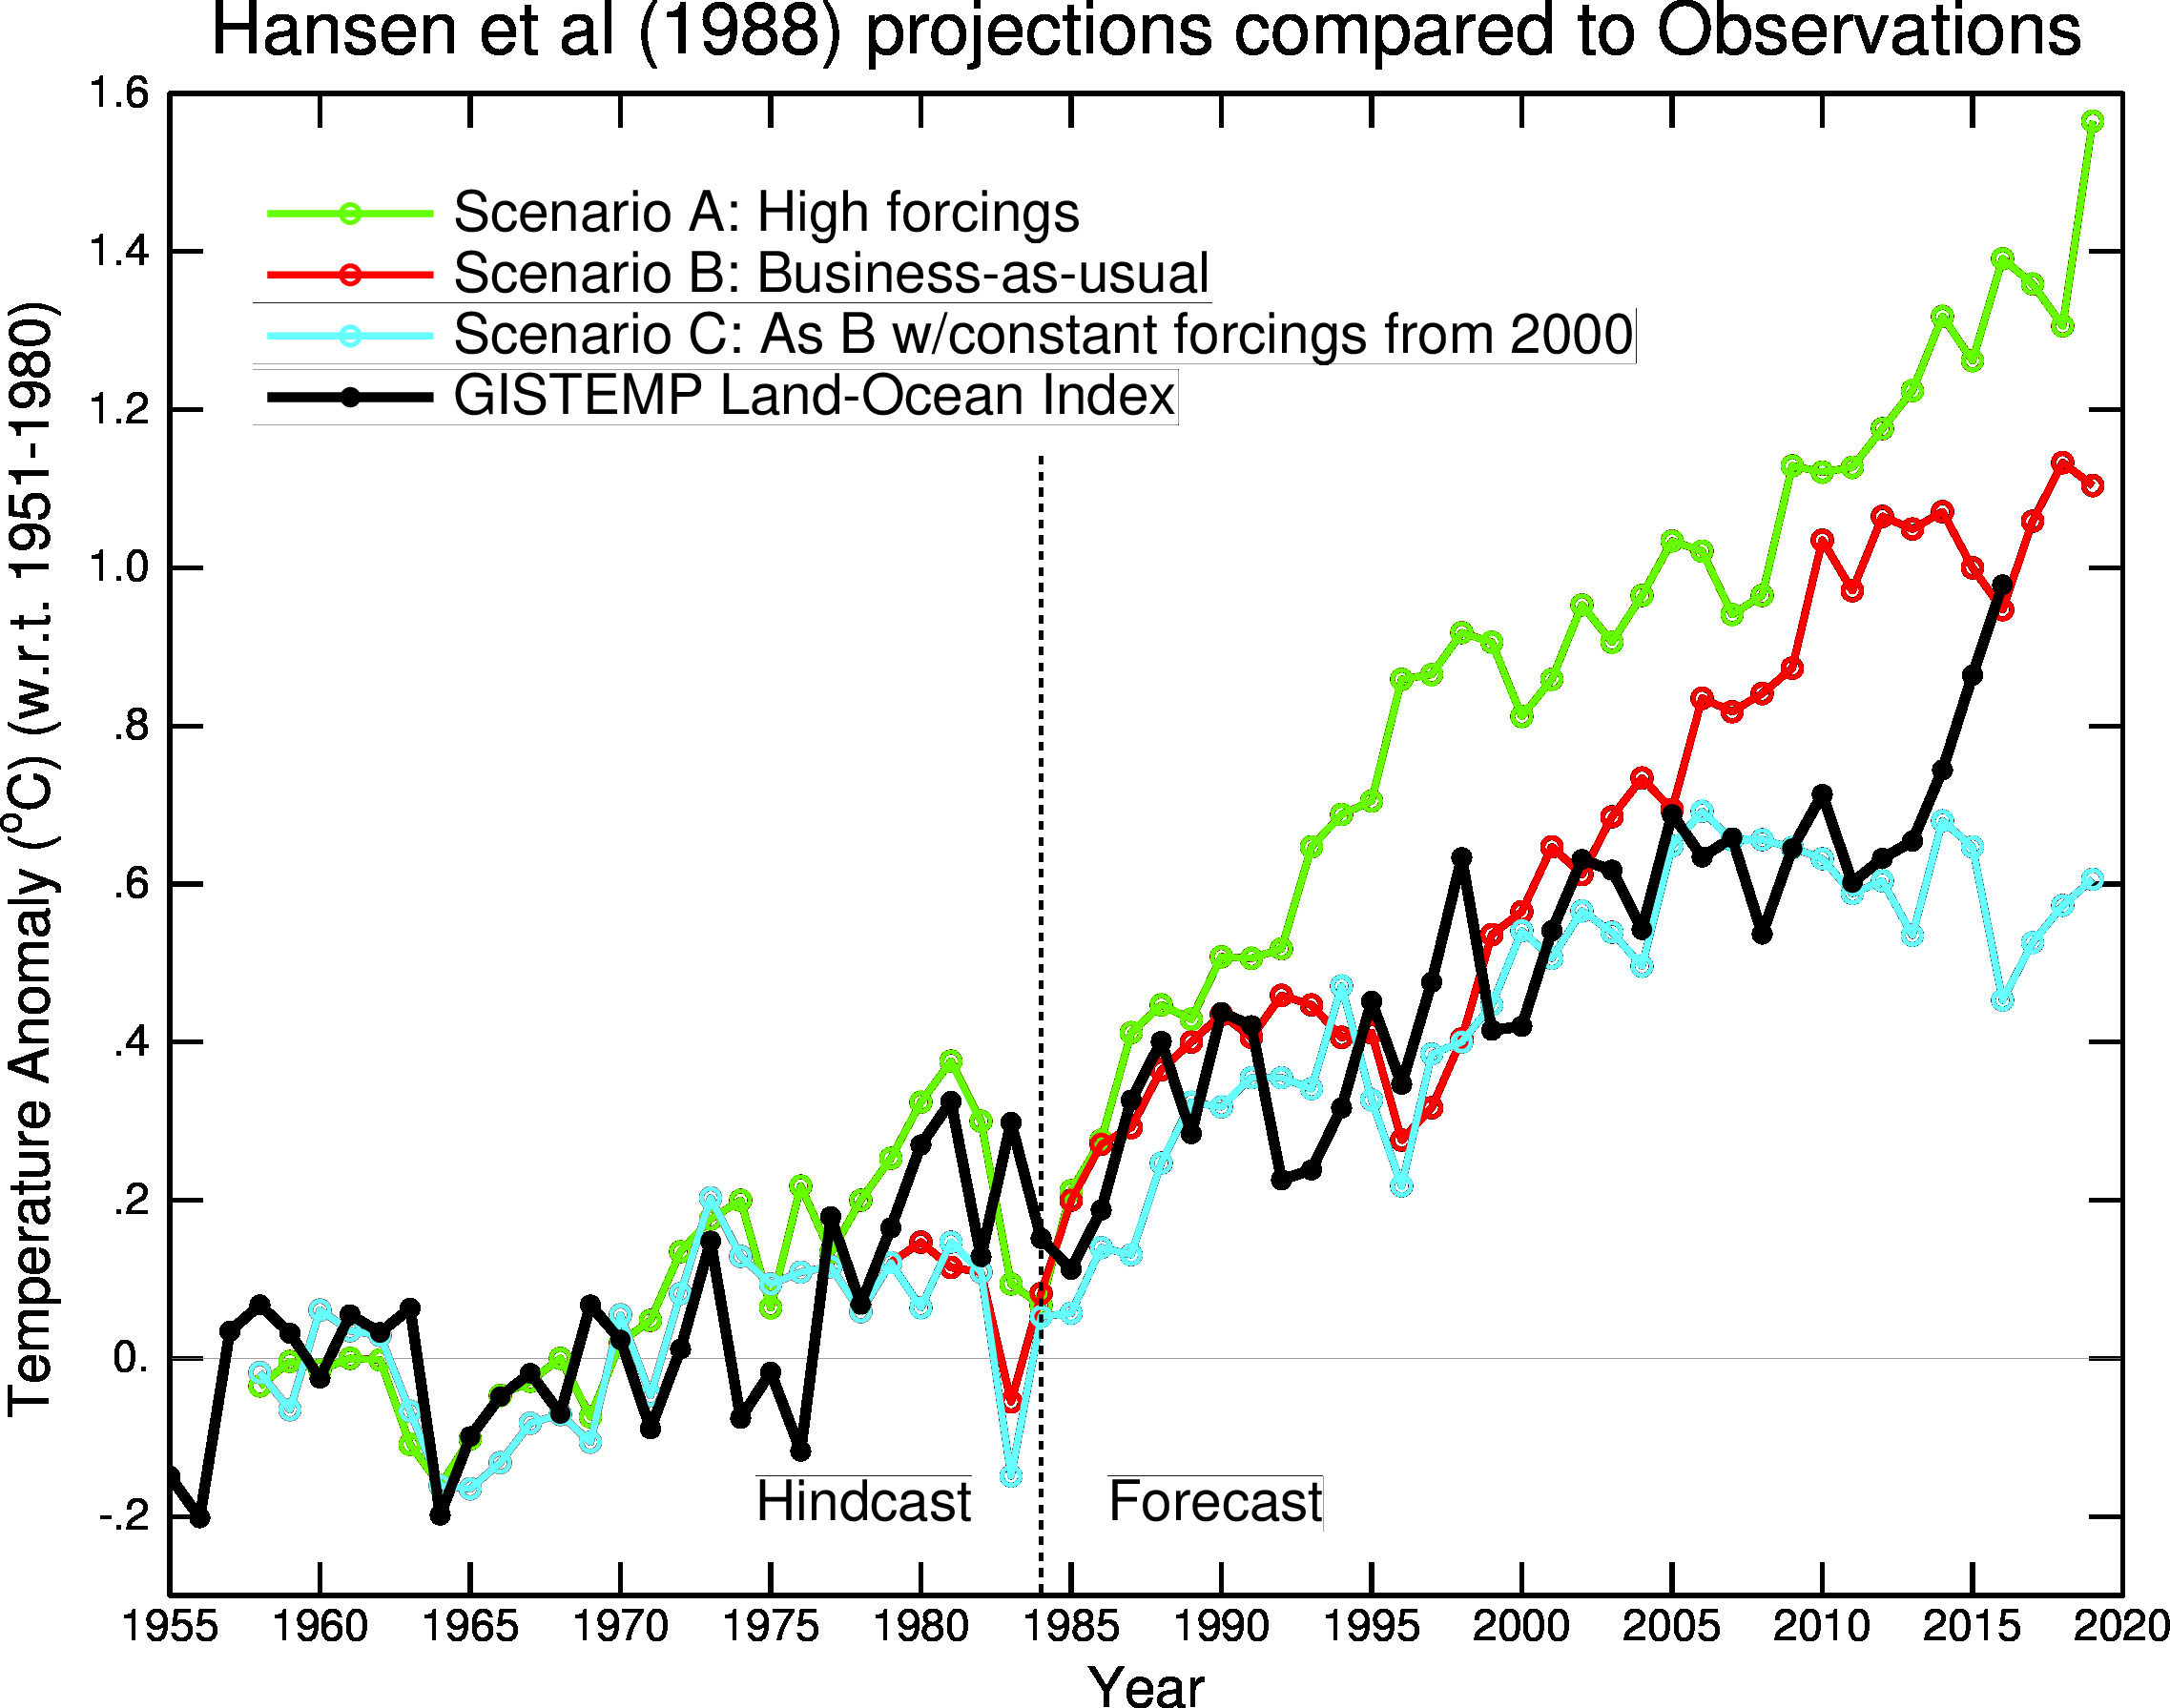
The curves don't match what we said was going to happen ten years ago?
They look OK to me.
Don't get me started on having Al Gore as a spokeman
Haha, nobody elected Gore as any sort of spokesman other than himself, and certainly he has ZERO to do with the scientific case for AGW. That's like saying the entire Republican party are frauds because Trump is kind of a dick.
show me a solution that does NOT put us back into the dark ages
Well first off, the type of solution has NOTHING to do with the existence of the problem. Seriously, are you really going to deny the problem even exists just because you don't like someone's proposed solution to it? Is that rational?
Second, there are any number of proposed solutions. Pick some that you like. Nuclear is fine by me, if you can make an economic case for it (and certainly in some areas it makes a lot of sense). Solar and wind are obvious choices to be part of the energy mix, particularly in areas where there's lot of sun and/or wind. Geothermal, wave power, thorium - there are plenty of carbon-neutral energy sources to choose from.
And for intermittency, power companies already have to deal with that, since no power plant is perfect - e.g. coal plants are offline 40-60% of the time, so they have to be covered too. The answer is wide distribution and redundancy from a variety of sources ("the wind always blows somewhere") with some storage
-
Re:How to cause panic with statistics
No, you are making things up without a shred of proof, just because you *think* that's what is being said.
various model such as the IPCC make show warming causing stronger hurricanes by end of 21st century, but that is not hard proof in the present.
Real scientists:
https://www.gfdl.noaa.gov/glob..."It is premature to conclude that human activitiesâ"and particularly greenhouse gas emissions that cause global warmingâ"have already had a detectable impact on Atlantic hurricane or global tropical cyclone activity. That said, human activities may have already caused changes that are not yet detectable due to the small magnitude of the changes or observational limitations, or are not yet confidently modeled (e.g., aerosol effects on regional climate)."
-
Re: Political tax
This obvious warming is hard observational fact, from land, sea, and satellite measurements all around the globe - not a model. Here is the dataset.
I guess reality itself must be alt-left.
-
Re: Political tax
This obvious warming is hard observational fact, from land, sea, and satellite measurements all around the globe - not a model. Here is the dataset.
I guess reality itself must be alt-left.
-
Re:Dummies
We don't even know all the inputs into the system. You repeat "physics!" like a madman while avoiding pesky things like that. We don't even know for certain what the actual composition of the planet is beyond about 40,000 feet down in one particular spot and while we have evidence of planetary magnetic field inversions we've never actually experienced one in recorded history.
We can't even get next week's weather forecast in any given place right more than 40% of the time. Since guessing the future climate is basically nothing more than a long-term generalized weather forecast for the entire planet, why should I assume that climate models for which several inputs aren't known and not all inputs are completely understood have more of a chance than that same 40% to be accurate?
Come on, Commander Physics. Explain how we can't predict the weather more than a week out correctly over half the time but we are supposed to predict the long-term global weather with high accuracy. "Physics" is not an answer, it's avoidance because you don't actually have one. Appeals to authority are not valid here. -
Re: Blames Wizards.
This one. Dunno why you couldn't look it up yourself, do you need a link to Google?
-
But how cold is the water?
Saltwater freezes at 28.4 degrees Fahrenheit. How did these sharks get so cold if they were underwater?
-
Re: Climate Change?
-
Re:Fine
Why more floods? Most of the world is looking at less than 1 foot change over the next century. Some places are looking at more - others are looking at less. But the vast majority are plugging along at a pretty sedate rate... If that is enough to cause a massive increase in insurance, then I hate to see what happens with a 15 MPH wind and a high tide, where your whitecaps might be 1 foot higher than normal...
-
Re:Good luck with that 30% cut to NASA's budget
Maybe NOAA can build the satellites with their budget, and NASA can figure out how to get them up in orbit with their budget?
Wait a sec, that's exactly what's already happening.
Except that today, NASA had earmarked some of their budget to also develop climate change monitoring satellites (4 missions).
Instead, Trump has said use that money to get back to NASA's core strengths, which is blowing up said satellites on the launch pad.
-
Re: uh oh
Funny, we just ended an 11 streak of no hurricanes in the US. Tornado activity continues to trend down. Antarctica is accumulating snow and ice mass faster than it's losing it. Methane has been increasing steadily since the 50s and Russia, the source of that permafrost was massively down in the 2000s, and still not close to the peak back in 1990. So that's all four of four of your "checked" predictions that are actual failures, not successes.
-
Re:I refuse to be trolled
All hate groups are growing. You clearly didn't even try. This is not merely an American problem, either. Neo-Nazis are actively recruiting and the downtrodden are ever easy targets.
Please wake me up when you have anything statistically significant to offer showing a statistically significant trend line not dominated by uncertainty, noise and the story of the day.
I clicked on a few of the links and read some of the data. Noted some KKK and SPLC stats and was thoroughly unimpressed. If you care to site anything specific. Perhaps an impartial academic study of some kind with real data I would gladly consider it. I have no doubt local variations exist over space and time for all manner of localized reasons yet this is quite different from a historical trend line.
Interpreting the past year or two from questionable (e.g. SPLC) sources as a trend is epic stat 101 fail. It's essentially looking at this graph:
https://www.esrl.noaa.gov/gmd/...
Noting a single instance of the red line going up or down and drawing some crackpot conclusion from it.
Nazis are not just pro-murder, pro-racism, they actively perpetrate abuse. Acceptance of abuse is not tolerance, it is only abuse. Nazis are actively doing harm not just by promoting genocide, but by actually engaging in violent and antisocial acts. Anyone who suggests that we accept that is, not to put too fine a point on it, a complete and total piece of shit.
This is a prejudiced statement. Not all Nazi's perpetrate harm or condone murder as a means to getting their way. Being a Nazi more or less means you think you are genetically superior to others and want to be left alone with others of your own "superior" tribe.
Did you know... Not everyone who attends Saudi funded Madrassas are members of Daesh. Not all short people are Chinese and not every Comcast CSR is a lobotomized zombie.
While I may think being a Nazi is lame if someone wants to express their views or march in a stupid parade I'm going to tolerate it because tolerating idiocy is a necessity underwriting all free societies.
Committing murder or otherwise using or plotting violence is obviously a different story. The subset of Nazi's doing this shit need to be fed to the gators roaming Trumps golf courses as far as I'm concerned.
There are people who are so afraid of the spread of ideas they absolutely hate be it a certain religion they vehemently disagree with, growing or shrinking acceptance of abortion or various views for or against certain tribes. So fearful they take it is a moral imperative that action must be taken to stop the spread of x,y and z by any and all means necessary. I say fuck these people. Either grow a pair and work to build consensus for your views or live with the consequences. Refusing to tolerate idiocy of others and shutting down freedom because your scared, unwilling or unable to step up is BS.
-
Re: This shows we can handle environmental problem
The annual ozone hole is a natural phenomenon, but historically the hole was a small fraction of the size than what we have had since the 1980's.
https://ozonewatch.gsfc.nasa.g...
Compare the 1979-1982 ozone hole size and Antarctica ozone levels before 1983 to after.That the ozone depletion/ozone hole continued to grow after the Montreal agreement was predicted.
The problem we faced is that the rate of production of CFCs vastly exceeded the rate of degradation of CFCs in the atmosphere so we were facing an accelerating rate of ozone depletion. The ozone hole was growing rapidly in size every year, and the global ozone levels were decreasing.
https://www.esrl.noaa.gov/csd/...The problem CFCs and related compounds have a very long lifetime in the lower atmosphere, on the order of a century, and on the order of decades in the stratosphere. Once a CFC is degraded by UV and releases a free chlorine or bromine, the free Cl or Br atom can continue to catalyze ozone to O2 for a few years before the free atom binds with hydrogen and falls back down to the lower atmosphere and get washed out.
Here's a document with graphs showing the continuing post-Montreal increase and subsequent drop-off in atmospheric concentrations.
https://www.esrl.noaa.gov/csd/...Here's an executive summary of the situation in 2014.
https://www.esrl.noaa.gov/csd/...Actions taken under the Montreal Protocol have led to decreases in the atmospheric abundance of controlled ozone-depleting substances (ODSs), and are enabling the return of the ozone layer toward 1980 levels.
The sum of the measured tropospheric abundances of substances controlled under the Montreal Protocol continues to decrease. Most of the major controlled ODSs are decreasing largely as projected, and hydrochlorofluorocarbons (HCFCs) and halon-1301 are still increasing. Unknown or unreported sources of carbon tetrachloride are needed to explain its abundance.
Measured stratospheric abundances of chlorine- and bromine-containing substances originating from the degradation of ODSs are decreasing. By 2012, combined chlorine and bromine levels (as estimated by Equivalent Effective Stratospheric Chlorine, EESC) had declined by about 10–15% from the peak values of ten to fifteen years ago. Decreases in atmospheric abundances of methyl chloroform (CH3CCl3), methyl bromide (CH3Br), and chlorofluorocarbons (CFCs) contributed approximately equally to these reductions.
Total column ozone declined over most of the globe during the 1980s and early 1990s (by about 2.5% averaged over 60S to 60N). It has remained relatively unchanged since 2000, with indications of a small increase in total column ozone in recent years, as expected. In the upper stratosphere there is a clear recent ozone increase, which climate models suggest can be explained by comparable contributions from declining ODS abundances and upper stratospheric cooling caused by carbon dioxide increases.
The Antarctic ozone hole continues to occur each spring, as expected for the current ODS abundances. The Arctic stratosphere in winter/spring 2011 was particularly cold, which led to large ozone depletion as expected under these conditions.
Total column ozone will recover toward the 1980 benchmark levels over most of the globe under full compliance with the Montreal Protocol. This recovery is expected to occur before midcentury in midlatitudes and the Arctic, and somewhat later for the Antarctic ozone hole. -
Re:Hide the decline
I'm willing to bet you haven't looked at a single paper in the climatology field. If you're so certain that the data is wrong, then take the raw information and show us. In fact, here's some links to get you started. https://www.ncdc.noaa.gov/ and for the archives https://www.ncdc.noaa.gov/has/... Here's your chance to get your name in lights! And with the current administration, you'll get so much airtime, you won't know what to do with yourself with all the money climatologists make.
-
Re:Heard this twenty years ago...
Hotter by 0.02 degrees.. AND THE MARGIN OF ERROR IS 0.1 degrees.
Science! Learn it!
If you were a scientist you'd not be looking at individual temperatures but at trends: http://www.economist.com/node/...
Instead you make some claim of some arbitrary temperature the GP didn't mention (god knows in what relation to, he mentioned 12 different years). By the way the number you're looking for is +2.03 degrees, not 0.02 https://www.ncdc.noaa.gov/sotc...
But the real disappointment is that someone modded you up.
-
Your one hot day
I live in the southeast part of the San Francisco Bay area. Last summer (a few months ago), it got up to 108 degrees one day. It's never been that hot since I moved here in 1989.
That's why they call them "record temperatures." Records happen in the context of "just normal weather." Consider the context:
Looking at the climate record for San Francisco for last summer, we can see that you had a couple of short-duration extreme outlying temperature events. We can also see from the records shown on the graph that these are not without precedent on other days in years past.
Record breaking days happen; you can see that particular event clearly, but you can also see that it was a significant outlier. It would be absurd to take it as indication of a trend — it's not in line with the temperatures anywhere around it.
None of this screams "climate change"; it's just weather. None of it screams "no climate change", either. Same reason. If you want to consider climate, you must go with large amounts of aggregate data.
-
Re: Why the Moon and Mars?
It's far from mythical.
It is not, however, an existential threat. It will not cause Western society to collapse (though some more vulnerable nations may not be so lucky).
It will be very expensive to deal with, and I expect that is what the GP is most concerned about (but not "terrified", as you seem to prefer to believe). Maybe look up how much the Netherlands has spent on its dyke system, and consider the cost of that for every coastal city on the planet. Have a look at what New York spent after Sandy's storm surge, and is now spending on new levees.
And that's just sea level. Have a look at all the other negative impacts described in the IPCC WG2 report, maybe read some of the many studies that attempt to count the net cost - and you too may be concerned for the sheer size of the bill any kids of yours will be stuck with.
-
Re:ex-Hurricane Debbie hit Ireland Sept, 1961And this is exactly the point Debbie was Sept 16 now we are now dealing with high water temps in the Atlantic causing major storms in Ireland a full month later. A huge difference and like comparing apples to oranges. The warm surface water is staying around much longer and is spreading much further to the north and this is a real problem.
It might not even be over quite yet for the Caribbean and even perhaps the Gulf of Mexico. Check out NOAA the water temps are still way up for this time of year. The mid 80s f is still well up in the range that intensifies storms to hurricanes. The mid Atlantic is still over 80 so we could still see some dangerous storms, here is hoping that this is the end for this year at least for the sake of the poor people of those countries. Aside from which, some of Trumps friends in the oil industry might have to delay their bone fishing and that would be an absolute catastrophe.
-
Re:Those were the days.
We do in fact have direct observations of ocean temperatures dating as far back as 1662. Thermometers did exist before the days of satellites, even if accuracy and coverage wasn't up to modern standards. Temperatures recorded then weren't even close to what we're seeing today.
In fact, we have multiple lines of evidence going back much further than that (cited thoroughly in e.g. the IPCC WG1 reports such as Chapter 5, Paleoclimate Archives) that show that the speed of current climate changes are unprecedented in anything like recent history (including ice ages). This is not surprising, considering that we can clearly see from the observational record that levels of greenhouse gases have risen from "more or less normal" to "unprecedented in the last 800,000+ years" in just the last century or so. Our knowledge of past conditions is a lot less limited than you seem to think - maybe try browsing some of the papers cited in WG1.
Since the observational evidence is entirely consistent with our physical models of past conditions, based on the known atmospheric conditions, solar output, GHG concentrations, recorded volcanism etc, speculation that "it could've been different, we just don't know" won't gain you much traction in actual scientific circles. You'd have to provide pretty solid observational evidence of anomalous ocean temperatures in the past, if you want scientists to accept that such conditions were in any way likely.
-
Re:But We Can Predict Eclipses?
I believe there's also an effect from the solar "wind." Even though it's minuscule in terms of mass, over time it has an effect on satellites in Earth orbit--apparently it's an indirect effect, caused by the interaction of the particles in the wind with the upper atmosphere: http://www.swpc.noaa.gov/impac.... And of course solar storms are (so far) unpredictable more than a few hours in advance.
-
Re:Still no global warming
This hurricane season is notable mainly because a hurricane hadn't made landfall on the U.S. since 2005 (which ironically after Katrina and Wilma, is when people were saying that due to climate change, multiple major hurricanes hitting the U.S. each year was going to be the new norm). That's pretty incredible when you consider that the historical average for the U.S. over 164 years has been 1.73 hurricanes per year making landfall. We basically missed out on being hit by 21 hurricanes in a row.
The average North Atlantic hurricane season sees 10.1 named storms, 5.9 becoming hurricanes, and 2.5 becoming major hurricanes (category 3+). These things tend to be cyclical though, with a few decades with below average storms, followed by a few decades of above average storms, repeat. The prediction for the season was 11-17 named storms, 5-9 hurricanes, and 2-4 major hurricanes. We're almost to the end of the season and currently at 14 named storms, 9 hurricanes, and 5 major hurricanes. Just slightly above predicted.
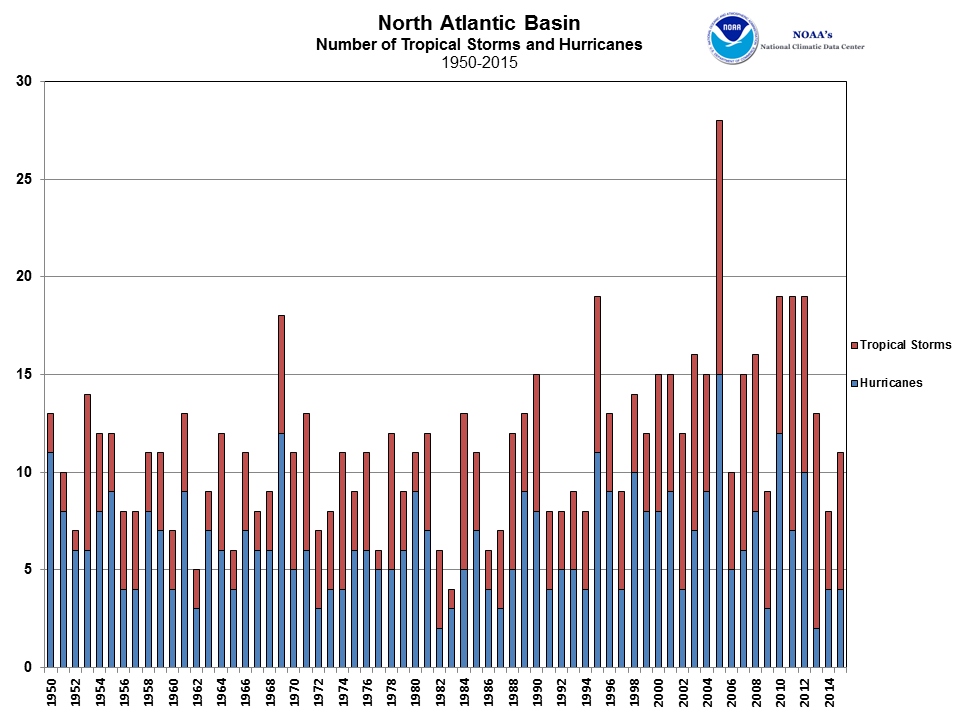
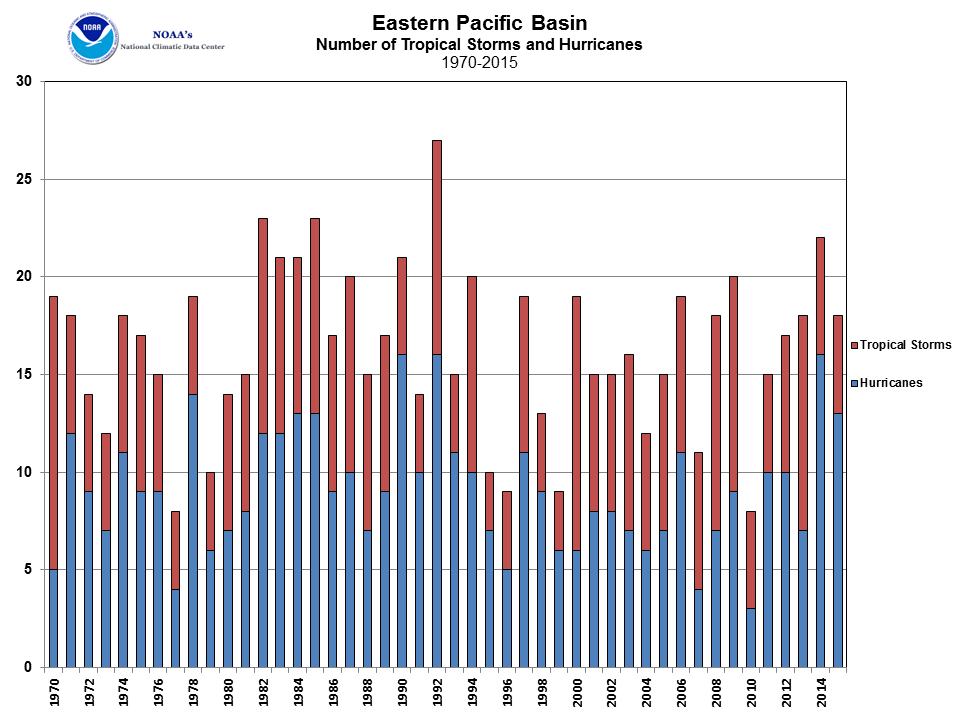
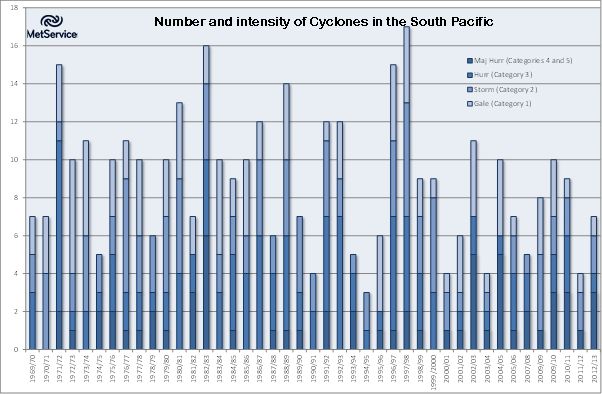
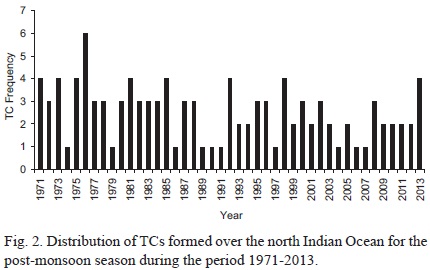
In terms of number of global cyclones (it is after all called global warming), the North Atlantic is the only basin which has seen an uptick in hurricanes the last couple decades. The East Pacific is flat. Typhoons in West Pacific are mostly flat with a slight downward trend. The South Pacific is down. As are cyclones inthe Indian Ocean.
If we can go an unprecedented 12 years without a hurricane making landfall in the U.S., can you just for a tiny moment consider the possibility that what happened this year was random before jumping to the conclusion that it was due to climate change? (FWIW, I'm of the opinion that climate change adds more energy to the system, increasing not just maximum intensity but also variability. The recent 12 years without a hurricane can mostly be attributed to a very strong El Nino which had the side-effect of reducing the probability of Atlantic hurricanes reaching the higher latitudes like the U.S. However, this being a hypothesis, the burden of proof is upon me. The null hypothesis - the theory that one assumes is true absent statistically significant evidence for an alternative - has to be that there has bee no change in number or intensity of hurricanes. You can get yourself into a lot of trouble if you go hog wild on every theory which has a tiny bit of correlative (but not statistically significant) empirical support. Of such things, conspiracy theories are made.) -
Re:Still no global warming
This hurricane season is notable mainly because a hurricane hadn't made landfall on the U.S. since 2005 (which ironically after Katrina and Wilma, is when people were saying that due to climate change, multiple major hurricanes hitting the U.S. each year was going to be the new norm). That's pretty incredible when you consider that the historical average for the U.S. over 164 years has been 1.73 hurricanes per year making landfall. We basically missed out on being hit by 21 hurricanes in a row.
The average North Atlantic hurricane season sees 10.1 named storms, 5.9 becoming hurricanes, and 2.5 becoming major hurricanes (category 3+). These things tend to be cyclical though, with a few decades with below average storms, followed by a few decades of above average storms, repeat. The prediction for the season was 11-17 named storms, 5-9 hurricanes, and 2-4 major hurricanes. We're almost to the end of the season and currently at 14 named storms, 9 hurricanes, and 5 major hurricanes. Just slightly above predicted.
In terms of number of global cyclones (it is after all called global warming), the North Atlantic is the only basin which has seen an uptick in hurricanes the last couple decades. The East Pacific is flat. Typhoons in West Pacific are mostly flat with a slight downward trend. The South Pacific is down. As are cyclones inthe Indian Ocean.
If we can go an unprecedented 12 years without a hurricane making landfall in the U.S., can you just for a tiny moment consider the possibility that what happened this year was random before jumping to the conclusion that it was due to climate change? (FWIW, I'm of the opinion that climate change adds more energy to the system, increasing not just maximum intensity but also variability. The recent 12 years without a hurricane can mostly be attributed to a very strong El Nino which had the side-effect of reducing the probability of Atlantic hurricanes reaching the higher latitudes like the U.S. However, this being a hypothesis, the burden of proof is upon me. The null hypothesis - the theory that one assumes is true absent statistically significant evidence for an alternative - has to be that there has bee no change in number or intensity of hurricanes. You can get yourself into a lot of trouble if you go hog wild on every theory which has a tiny bit of correlative (but not statistically significant) empirical support. Of such things, conspiracy theories are made.) -
Re:Still no global warming
Climate change is real, disputing that is stupid (especially without data). However, be weary of what you point to as an effect of climate change. Hurricanes have existed long before humans and will continue long after humans.
It is premature to conclude that human activities–and particularly greenhouse gas emissions that cause global warming–have already had a detectable impact on Atlantic hurricane or global tropical cyclone activity. That said, human activities may have already caused changes that are not yet detectable due to the small magnitude of the changes or observational limitations, or are not yet confidently modeled (e.g., aerosol effects on regional climate).
However, if we're going by the basis of what Fox News considers the truth then every hurricane is a direct result of global warming and somehow taxes.
-
Re:Really?
Close, but not really.
Climate models do not predict more hurricanes.
They do predict stronger hurricanes.
We also conclude that it is likely that climate warming will cause hurricanes in the coming century to be more intense globally and to have higher rainfall rates than present-day hurricanes. In our view, there are better than even odds that the numbers of very intense (category 4 and 5) hurricanes will increase by a substantial fraction in some basins, while it is likely that the annual number of tropical storms globally will either decrease or remain essentially unchanged.
-
Re: At least...
I appreciate your attempt to help but no...
http://www.noaa.gov/media-rele...
Note: I've made it a point to provide clear and unbiased (as close as possible) citations to respond to your posts.
The planet is warming, this is not in doubt. However, alarmist antics aren't helpful, and are less helpful when they're easily debunked.
-
Re:Holy shit, stop the insanity
As long as you don't admit that the models are wrong, you're opposed to science.
Oh the irony.
Sigh. Fine, we'll do this again. Yes, of course the models are not perfect - they do not (and cannot) predict every last short-term wiggle. To a "black and white" viewpoint then that means they're *always* wrong - even when they reliably nail the long-term trend for over thirty years. This of course does not mean they are not still very useful to climatologists that know how to use them (and as long as you don't admit that, you're opposed to science, yes?)
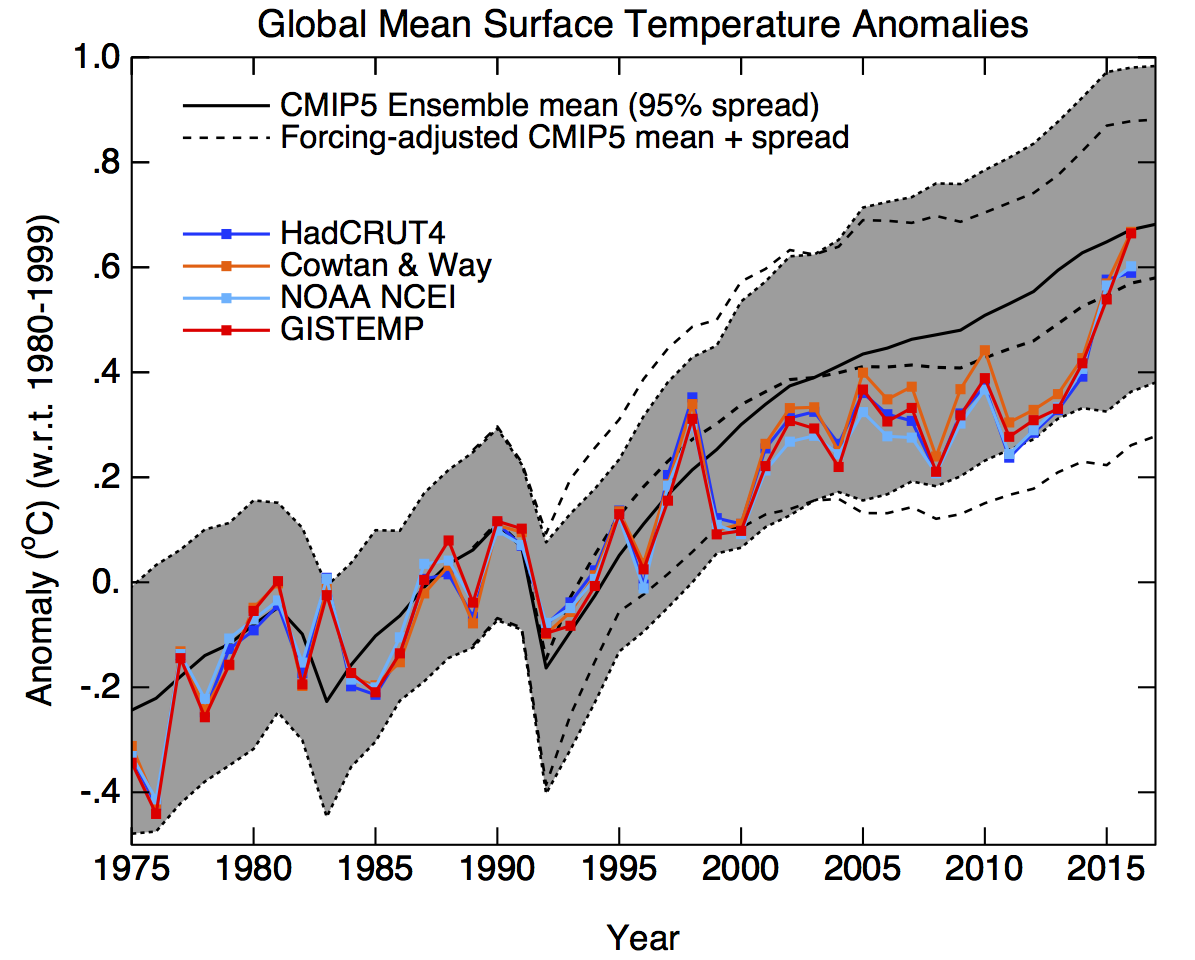
So with that out of the way, when the models don't match closely to what we observe, we want to know why, so that we can improve them. From your own first link (again):
..both internal variability and external forcing contribute to the ‘slowdown’. The externally forced contribution is due to the combined cooling effects of a succession of moderate early twenty-first century eruptions, a long and anomalously low solar minimum during the last solar cycle, increased atmospheric burdens of anthropogenic sulfate aerosols, and a decrease in stratospheric water vapour
As you point out, internal variability (ENSO etc) alone is very unlikely to account for the discrepancies, but your own citation says that internal variability and the short-term external forcings listed above are responsible for the so-called "pause" (in tropospheric warming specifically), and the models do not adequately account for these (again, no surprise to actual climatologists). Meanwhile, other (and more important) climate models are tracking nicely; for example, "ocean warming estimates over a range of times and depths agree well with results from the latest generation of climate models" (which is accelerating rapidly).
if you think the cause was volcanoes and solar activity, this paper talks to you. You'll have to find some other explanation.
So when your first link from 2017 explicitly calls out volcanoes and solar activity (among other things) as significant factors, you cite a paper from 2013 (four years out of date) to claim that it can't be those - despite that same paper explicitly not ruling out external forcings like those as being a factor. You really need to read your own citations more closely.
Seriously, do you look at this and say, "Oh yeah, that's right"? If so, what is wrong with you?
I look at that and say, "I see it's 5 years out of date, big surprise". Then I say "what is that graph even representing? There's no labels". Then I look at more up-to-date data. (NB I'm assuming from your example that you're fine with linking to images on blogs, but at least try to use something current and well-sourced?)
-
Greenhouse effect is well understood
I cannot believe how freaked out everyone is about carbon, when it is a basic and abundant element of the planet...
People are "freaked out" about carbon-- specifically, carbon dioxide in the atmosphere-- because it is known to absorb outgoing infrared radiation, so the amount of carbon dioxide in the atmosphere affects the temperature balance of the planet. This is an effect that has been known for a very long time (here's a good review from the American Institute of Physics: https://history.aip.org/climate/co2.htm), but only recently has the amount of carbon dioxide put in the atmosphere by humans been enough to make the effect visible.
You're correct that it is "basic and abundant", although I'm not sure why that's relevant
the amount in the atmosphere is minuscule to begin with,
Correct. It was the great discovery of Tyndall in 1859 that extremely small amounts of trace gasses can affect the infrared absorption. https://earthobservatory.nasa....
never mind whatever we are adding in being a tiny fraction of what it is already.
Humans have increased the carbon dioxide content of the atmosphere by about 45% since preindustrial times, most of that in the last century (graph: https://www.esrl.noaa.gov/gmd/...). Depends on whether you call that a "tiny fraction."
But, indeed, the natural greenhouse effect of about 30C (ref) is about much larger than the human contribution. That's one reason we understand the greenhouse effect; it's large enough to be easily measured.
The entire ecosystem of the Earth is built to process carbon, to consume carbon, to use carbon to sustain life.
Correct again. Over a period of few hundred thousand years, this will undoubtably be removed from the biosphere.
It would be lot faster than that, except we're cutting down trees a lot faster than we're growing trees.
It is so sad to see rational people get lost in a death cult that makes absolutely no sense to anyone with a shred of scientific understanding of the climate, or indeed basic material science...
I will assure you that I have a pretty good scientific understanding of climate, and also of basic materials science. This is how we understand the atmospheres of all the planets, not just Earth. The basic physics of the greenhouse effect is quite well understood science, and the absorption coefficients of trace gasses in the infrared are all well measured.
-
Re:Negotiation won't stop hurricanes
How much more destructive? What was the trend in storm intensity before and after climate change? How does the cause and effect relationship work exactly?
What specific, quantifiable cause and effect relationship are we acknowledging? And what clear evidence of this specific effect should we be sure not to ignore?
They actually study this stuff: https://www.gfdl.noaa.gov/glob...
-
Re:Ask the experts at NOAA
Dammit forgot link https://www.gfdl.noaa.gov/glob...
-
Re: Global warming and Atlantic hurricanes
How is my post a conspiracy theory? Do tell.
It's not clear that Atlantic tropical cyclone activity should increase as a result of global warming. That's not a conspiracy theory. It reflects the current state of climate science, based on NOAA research that has been included in recent IPCC assessment reports. In fact, here are some links to information about it:
https://www.ipcc.ch/publications_and_data/ar4/wg1/en/ch9s9-5-3-6.html
https://www.gfdl.noaa.gov/global-warming-and-21st-century-hurricanes/I didn't readily find a link to the IPCC AR5, but the AR4 is still credible science. And the NOAA link has been updated within the past year, so it reflects the current state of the science.
Climate predictions are done on a regional basis with climate models. They're integrated forward just like weather prediction models, just over much longer periods of time. While it definitely isn't possible to predict the weather on a day to day basis beyond a week or, perhaps at most, three weeks (the theoretical limit), the statistical moments of the climate models (averages and extremes) have merit. The models aren't perfect, but they do a good job, and they're the best tootool we have for making regional climate predictions decades in advance. Here's what the models predict for the tropical north Atlantic: warmer sea surface temperatures, but stronger vertical wind shear and less humidity. The warmer sea surface temperatures would be favorable for increased tropical cyclone activity. However, stronger vertical wind shear and a drier atmosphere will suppress hurricane activity. Climate science isn't able to make a definite prediction about Atlantic hurricane activity because some of the factors would favor increased activity while others would favor a decrease. This isn't a conspiracy. It's the current state of the science.
Why would you say that stronger Atlantic tropical cyclones be associated with global warming when the current understanding of climate science does not predict that global warming will increase Atlantic tropical cyclone activity? Your position is illogical.
If you said that stronger typhoons and more typhoons in the northwest Pacific were a sign of global warming, I'd have no problem with that. The models do suggest that tropical cyclone activity will increase in that region, and I believe the science. But that's not what's currently being predicted for the north Atlantic basin.
I'll go a step further and say that making claims about global warming that aren't supported by the science is irresponsible and undermines the credibility of the scientists. If you're going to make claims about global warming impacts and insult people, make sure your posts are factually correct.
By the way, there are typically six factors cited as being necessary for tropical cyclone formation, unlike your list:
1) Warm water temperatures, typically at or above 26 degrees C
2) Non-zero Coriolis (you don't get hurricanes at the equator; you need to be several degrees north or south)
3) Weak vertical wind shear
4) Weak static stability
5) High low- and mid-level humidity
6) Low-level convergence (like a tropical wave)Those are the six ingredients for tropical cyclone formation. It is predicted that some of those factors will become less favorable for tropical cyclones in the north Atlantic despite the increase in sea surface temperatures.
My post wasn't a conspiracy theory or denying climate change. It reflects the current state of the science, that it isn't certain whether global warming will increase tropical cyclone activity in the north Atlantic.
-
Re:One active season and now everything is differe
And those trying to tie hurricanes in with climate change invariably focus on the North Atlantic because that's the storm basin whose recent history fits their desired narrative. Meanwhile, storm frequency in the East Pacific is flat. The West Pacific is mostly flat with a recent slight downward trend. The South Pacific is down, as is the North Indian Ocean.
It should be noted that most climate change models currently don't predict a significant increase in the number of hurricanes in a season. This was not true in the past but we get better with modeling over time so its not surprising. Most do however predict that the storms will be larger on average. That part seems to be holding worldwide.
-
Re:One active season and now everything is differe
Per NOAA, Irma was category 3 when it made landfall (120 MPH sustained winds). So I guess we can say that 2017's dual cat 4s really didn't happen, did they?
-
Re:One active season and now everything is differe
We haven't had two Cat 4 hurricanes hit for more than a century. The increase in water temp is increasing the power of the storms, and we should expect this to continue. That doesn't mean every storm will be Cat 4/5 or that every season will be worse than the last. Just that the frequency of high-power storms will increase. Again, we haven't had landfall of two Cat 4 storms in 100 years, so Harvey and Irma are definitely unusual.
The last time two Cat 4+ storms made landfall in the North Atlantic was 2008. Gustav hit Cuba as a Cat 4. And Ike hit Great Inagua Island and Grand Turk Island as a Cat 4. (Paloma hit Cat 4 just south of Cuba, but dropped to a Cat 2 before landfall.)
If you mean landfall in the U.S., well the U.S. lies at the extreme northern edge of hurricane territory. So you're basically just counting outliers if you're only counting U.S. hurricanes. They're too infrequent and random to draw reliable stats from. With modern satellite coverage and flights into major storms to get precise measurements, there's no reason not to use the entire database of every storm that forms in the North Atlantic.
And those trying to tie hurricanes in with climate change invariably focus on the North Atlantic because that's the storm basin whose recent history fits their desired narrative. Meanwhile, storm frequency in the East Pacific is flat. The West Pacific is mostly flat with a recent slight downward trend. The South Pacific is down, as is the North Indian Ocean. -
Re:First sentence is absurd
Hurricanes don't result from differences in temperatures, SST needs to be at least 26.5C/80F for TC development to occur, among other factors. Large temperature changes kill a TC, that's one of the reasons why when it hits land it rapidly dies off. http://www.aoml.noaa.gov/hrd/t...
-
Re:Fairness
Slight correction to your post, typically speaking only tropical CYCLONES are "hurricanes". tropical storms are essentially a weaker stage in what is considered a "hurricane" with lower wind speed and less defined circulation, although they are still destructive in their own right. Tropical systems aren't classified as a "hurricane" unless the sustained wind speed is >64knots/74mph. Hurricane is just a name (in NA) used for a tropical system once it reaches a certain strength threshold. Its mostly a way to define the intensity of the storm. TC evolution:Tropical disturbance>tropical depression>tropical storm>tropical cyclone(hurricane/typhoon).
Tropical thresholds definitions: http://www.aoml.noaa.gov/hrd/t...
Tropical cyclone definition: http://www.aoml.noaa.gov/hrd/t... & https://oceanservice.noaa.gov/...Its quite common for tropical cyclones to downgrade once they reach land because warm and deep water it what drives them (primarily, there are other significant factors). The rapid change in moisture and temperature from water to land degrades or kills the average storm rapidly, although it will still leave an area of lower pressure with residual thunderstorms and the like.
Posting ac since I'm moding.
Disclaimer: The post is solely meant to be educational. Weatherman awayyyyy