 Slashdot Mirror
Domain: noaa.gov
Stories and comments across the archive that link to noaa.gov.
Comments · 2,602
-
Re:Um..no
The problem is that it's only the warmest decade if you include adjustments. If you take the USHCN v2 data or GHCN v2 data, and plot adjusted and unadjusted average temps, you can see that their adjustments themselves add warming. The linked graph is for USHCN data. I didn't see a way to add trendlines in google docs, but when i ran it in excel the adjustments had a slope 3 times larger than the raw trend. That's deeply suspicious, as is the relatively smooth graph of adjustments themselves. I added 520 to the adjustments so i could graph them together easier. The numbers are in 10ths of a degree. My personal suspicion is that the method they use to calculate adjustments will magnify any trends present in the existing data.
-
Re:At that temp the operator dies anyway
A while back I looked up the records and average temps for various cities in the Sahara, and was surprised to learn that even tho the Sahara's *average* temperature is higher, its extremes are not as hot as in the depths of the SoCal deserts.
[goes off, finds handy C=F convertor at http://www.wbuf.noaa.gov/tempfc.htm%5D I see that 50C is 122F. Is Delhi humid or dry? Here it's so dry that if you don't vaseline your eyeballs at night, you wake up with raisins.
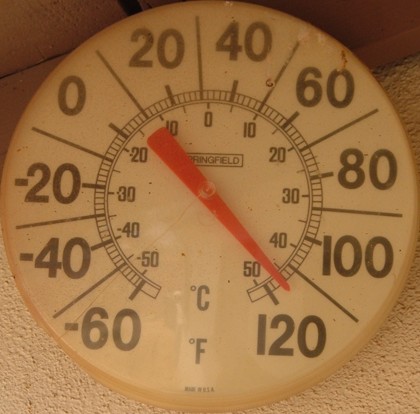
My thermometer (which always matches the local NOAA.gov station) on a typical day in high summer:
http://www.doomgold.com/misc/thermometer.jpg
Couldn't find the pic offhand of the day it hit 122F here. The local NOAA.gov station recorded 121F that day.We get the sand and fine dust issue too, tho there aren't many people here who work outdoors with a computer (far as I've seen). But I've shoveled a couple inches of fine dust out of clients' PCs that sat near open windows... one I thought about turning into a planter instead, it was that bad
-
Re:At that temp the operator dies anyway
California desert. And it gets somewhat hotter over by Ridgecrest and in Death Valley than it does here. Here's the weather station that's in the same microclimate as my place, if you feel an urge to check us out during high summer -- http://www.wrh.noaa.gov/mesowest/getobext.php?wfo=lox&sid=KWJF&num=168&raw=0&dbn=m or http://tinyurl.com/y9pda7q -- I am often outdoors during the heat of the day, tho I don't stand around in the sun any longer than I have to. But I don't have to bring a computer outdoors
I've done a lot of summers without air conditioning, with at most a fan. Last summer I never did get around to fixing the swamp cooler, and it was regularly 95 or so in my house. The computer gets an external fan in summer and it helps a lot (20+ degrees difference, just from heat exchange thru the old-fashioned steel case).
-
Re:Global warming? Or....
Do yourself a favor and look at a global temperature anomaly map. Here's January. Basically, the eastern US, northern Europe, and Siberia were cold. The other ~80% of Earth's land mass and most of the oceans were warm.
-
Re:Global warming? Or....
Do yourself a favor and look at a global temperature anomaly map. Here's January. Basically, the eastern US, northern Europe, and Siberia were cold. The other ~80% of Earth's land mass and most of the oceans were warm.
-
Re:Hey, wait a minute
Global temperatures have not been falling since 1998! They just haven't risen quite as fast as they did in the 1990s. There is a graph of the global temperature anomaly from 1880 through 2009 here.
The urban heat island effect is well understood and accounted for. A recent study [PDF] that used the surfacestations.org list of well and poorly sited stations showed that the poorly sited stations actually introduced a slight cooling trend in the data (but not enough to change the overall warming trend).
-
Two suggestions
1. Contact the NOAA library staff at http://www.lib.noaa.gov/ for suggestions.
2. Contact National Archives staff for suggestions. -
Re:well yeah,
Seems too good to be true. I wonder what the downside is.
Well, when you burn things you get CO2. It seems that Methane has much less impact as a greenhouse gas than CO2, but only because of the volumes involved. So the down side is we are screwed if we continue burning stuff for power. I wonder about cracking the methane for hydrogen.... At least that burns in a more friendly manner... water vapor we can handle.
-
Re:Hard to DoI will concur. In my experience with this sort of thing the most difficult part is dealing with coordinate systems and datum. There are a lot of really obscure local datums that have been used threw the years. Also, even for pretty recent maps the accuracy of the map depends on the survey.
From From a NOAA page about chart accuracy and precision.
"Positioning of Survey Data The methods used to acquire the underlying survey data will also affect accuracy. NOAA has specified stringent accuracy standards for collection of data by its survey vessels. Currently, surveys are being conducted to DGPS accuracy. However, for surveys performed prior to the mid 1990’s, the accuracy requirement was only 1.5mm at the scale of the survey as few surveys of years past were able to match DGPS accuracies. For example, on a 1:20,000-scale harbor approach survey, an accuracy of 1.5mm equates to 30 meters. NOAA makes every effort to produce the most accurate chart possible given the available data. The prudent mariner should pass shoals or isolated dangers with utmost caution, no matter what navigation method is used." That is not to say you cannont get good results just that you have to be careful. -
amateurs!
In contrast, Seattle averages 158 rainy days per year http://www.see-seattle.com/weather.htm and an average of 294 cloudy/partly-cloudy days per year http://lwf.ncdc.noaa.gov/oa/climate/online/ccd/cldy.html.
-
Um, no.
You're mixing up two effects. You're correct that the direct EM radiation would affect largely only the sunlit portion of the Earth. However, the "second punch" of these events is the large burst of protons that arrives the next day -- it's the solar wind, but several orders of magnitude larger than usual.
These protons are affected by the geomagnetic field, and (to simplify a lot) rain down in large regions generally centered around the magnetic poles (cf. the auroral ovals), where they induce very large currents in long conductors like power lines, leading to general power failures that could not be easily repaired.
This wouldn't be your garden-variety blackout -- it would require physical replacement of massive equipment for which there are no spares readily available -- at least not in the quantities needed. Large numbers of people -- entire provinces and states in North America, and likely entire nations in northern Europe -- would be without power for months while new equipment was manufactured and installed. This would lead to mass migrations out of these areas, which would lead to social disruption and significant loss of life as critical systems, whose backup generators and other emergency systems were not designed for such an extended outage, failed.
I was in south Florida for Hurricane Wilma, and I can report to you that the social structure of the region almost broke down during the week or two the region was without electricity -- and this was a natural disaster, albeit a severe one, that people understood and had largely prepared for. Power was restored relatively quickly then, because (a) the causes, downed power lines, were easy to find and repair, and (b) there was a massive influx of utility workers from the rest of the country to help out. In a solar flare scenario, the cause would be much harder to fix, and there would be a much larger affected area (and, consequently, a much smaller unaffected area from which to draw support).
-
This current solar cycleactually was originally forecasted to be a bad one and cause some serious problems and peak between 2010 and 2015. Now it's been forecasted to be milder and actually cause cooler seasons.
Solar Cycle 24 Prediction Updated May 2009
2012-13: NOAA predicts solar cycle 24 ”weakest since 1928” with $1 trillion damages in worst case. From second article:“A new active period of Earth-threatening solar storms will be the weakest since 1928 and its peak is still four years away, after a slow start last December, predicts an international panel of experts led by NOAA's Space Weather Prediction Center. Even so, Earth could get hit by a devastating solar storm at any time, with potential damages from the most severe level of storm exceeding $1 trillion.”
-
Re:My particular facts.
A recent study* using Anthony Watts surfacestations.org list of well and poorly sited weather stations found that the poorly sited stations actually introduced a slight cooling bias to the record. I guess they overcompensated for the UHI effect. Again, even if a thermometer is located in a poor site it can still measure temperature trends accurately. The events that lead to the UHI effect are usually rather abrupt such as putting up a building. The effect can often be seen in the record for the station and compensated for. I'd love it if you could show me actual scientific evidence that rural (presumably you mean well sited) stations have been corrected to mimic urban (presumably poorly sited) stations.
*The actual paper is On the reliability of the U.S. Surface Temperature Record (Menne 2010) [PDF]. A synopsis of the findings can be read here. Of course the study only covers the continental USA, a mere 1.5% of the Earth's surface.
-
Re:That proves it.
-
Re:Cue the teabaggers.He was most likely referring to CO2, which you pretended to address but then ignored.
Each year since global measurements of CO2 began, the amount of carbon dioxide in the atmosphere has increased. Scientific measurements of levels of CO2 contained in cylinders of ice, called ice cores, indicate that the pre-industrial carbon dioxide level was 278 ppm. That level did not vary more than 7 ppm during the 800 years between 1000 and 1800 A.D. Atmospheric CO2 levels have increased from about 315 ppm in 1958 to 378 ppm at the end of 2004, which means human activities have increased the concentration of atmospheric CO2 by 100 ppm or 36 percent.
--http://www.noaanews.noaa.gov/stories2005/s2412.htm
Anthropogenic (man-made) CO2 contributions cause only about 0.117% of Earth's greenhouse effect, (factoring in water vapor). This is insignificant!
Yeah! It's a small number so it has to be of small significance! My maths learnin' proves it!
The average swimming pool holds 20,000 gallons of water. A full human bladder only holds 500 mL of urine, or 0.132 gallons. That means me peeing in a pool will only result in a urine concentration of 0.00066%! That's so low that it must be a-oh-kay! -
Explanation Needed
Without starting a giant flame war (too late?), could someone please explain the following data from two ice-core samples:
http://www.ncdc.noaa.gov/paleo/metadata/noaa-icecore-2475.html
http://www.ncdc.noaa.gov/paleo/metadata/noaa-icecore-2453.htmlThis data is referenced in the following article, which claims global warming cannot be man-made:
http://www.foresight.org/nanodot/?p=3553I would love for someone to explain either; why the data is wrong, or how it could be misconstrued.
Please please please, no name calling. I'm uninterested in shouting matches, and am only after logical argument.
-
Re:Science or Religion?
Mmkay... If you still believe that "Scientists are VERY clear: AGW is happening," you are a true believer. Watch your prophet expound in a debate:
http://www.youtube.com/watch?v=XDI2NVTYRXUIf you go back a little longer than 10 years, you can see that CO2 was rising even during a global cooling period: http://www.esrl.noaa.gov/gmd/webdata/ccgg/trends/co2_data_mlo.png So what's the direct relationship between CO2 and temperature again...?
-
Re:Makes no difference
-
Re:Science or Religion?
http://www.esrl.noaa.gov/gmd/ccgg/trends/
as a denier : you should work the rest out and prove that nothing is happening. Scientists are VERY clear: AGW is happening. if you can prove otherwise : go ahead; you can effectively win a nobel prize + 10 billion dollars from the oil-companies. -
Re:I Don't Think This Was Well Thought Out
It would have been nice if the IPCC had simply relied on climate researchers.
Yes, a few mistakes were made. But this is how science works, you identify the bad data and move on.
Yet, as Anthony Watts
I stopped reading here. You tell us to rely on climate research then immediately reference an unpublished broadcast weatherman? Give me a break.
And here is the rebuttal, published in the Journal of Geophysical Research.
I don't know about you but I am more inclined to trust the Journal of Geophysical Research than I am inclined to trust Watts and his buddies.
-
Re:I love to be the first to say this...
That's because you need more than 15 years to get statistically significant figures.
You do realize you're just making that up? And that if the past 15 years showed marginally significant warming you'd be trumpeting it as "proof" that GW/CC was a "fact"? This is what bugs scientists about the AGW crowd: you use quite different standards for confirming and disconfirming evidence. The anti-AGW crowd do the same thing. I've been on both sides of the fence as I've learned more about the evidence, and neither is a particularly comfortable place for a scientist, as one gets continually pushed by anti-scientific individuals who introduce absolute irrelevancies, like the dangers to the ecology or the economy if their preferred belief happens to be true.
One useful way of determining you are dealing the an anti-scientist is that they mix introduce claims about the effects of GW/CC (or carbon dioxide reduction policies) as if they were arguments for or against GW/CC. As soon as someone does that, you know they aren't interested in science, but in politics and power.
With regard to Phil Jones' statement: an estimated rate of 0.13 C per decade would lead one to expect 0.2 C in 15 years. Instead, the rate is statistically equivalent to zero. That's interesting, but a more interesting question is: what is the highest rate that the observed trend is consistent with?
If it is higher than 0.13 C then the models are not in trouble. If it is not, then the models are.
But you cannot say at the same time that an observed rate that is consistent with the models over 15 years is confirmatory, and that an observed rate that is inconsistent with the models over 15 years is not disconfirmatory.
Not if you care about science, anyway.
-
Re:Green... EPIC FAILURE
What matters in science is not what someone with a fancy degree says. What matters is what evidence is provided. I have seen a few climatologists say that the Earth is not warming, but I do not accept that statement because the evidence is that the oceans are warming, and the Arctic ice and Antarctic ice are melting. I have seen some people say that human activities are not increasing the amount of carbon dioxide in the atmosphere, but the Keeling curve and the ratio of carbon isotopes show that the increase is due to burning fossil fuels.
Science is not a matter of he said, she said. It is about evidence. If you have some evidence to back up your claims, providing it would be far more convincing than an appeal to authority.
-
Re:When...
Obligatory xkcd ref.
Well, if you want to disregard what the Wegman Report says, that's up to you.
The cheaper ones tend to report *cooler* temperatures than the more expensive, standalone sensors. So the "urban" stations actually show *less* global warming if averaged in a naive approach.
This is only true if there are no adjustments made to the temperature reading AND the "cooler" temperature is greater than the heating effect. If these aren't true, then obviously it would depend on the amount of the adjustment and amount of error in the reading.
2) There's a *lot* more than 4 stations in most regions which have correlated temperature anomalies. In the US, generally dozens.
You know very well that the # wasn't significant in the argument. It's fine to eliminate grossly incorrect readings this way. It's another thing entirely to adjust a good reading because the surrounding stations have more error.
3) The heat island effect *is* cancelled algorithmically, and this is verified by, among other things, comparing calm and windy days.
You have a remarkable confidence that this algorithm is very accurate. You can read the conclusion of here and see there are reasons to believe there are deficiencies in the algorithm. Even comparing calm/windy days will be influenced by the location of the unit (walls close by) and topological influences.
For something that is supposedly "validated", we are seeing an awful lot of instances of incorrect usage.
Yes, by people like Watts.
Proof by Innuendo. There's science for you. Are you actually trying to argue that algorithms are better than calibration?
er, ok. These graphs tell me the world is warmer than it was than the Little Ice Age. If you assume all this is due to CO2 (ie there is no solar forcing), one would expect and
2) Since when do you trust Phil Jones?
I don't trust EITHER side in this debate. I note that it is more significant if a proponent of AGW says there's no warming just as if a detractor of AGW says that there is warming.
3) Phil Jones is one climate scientist among several thousand. He is not the god of climate science.
Please. Saying he's just one climate scientist is like saying Joe Biden is just another government employee. It's being disingenuous. It would be much more difficult to make the AGW case if you took his work out of the picture.
4) Wrong. Jones says that there is a +0.12C warming trend for that time, but it's not long enough to be statistically significant. And he's right.
Sorry. I stand corrected. It was for the period Jan 2002-present with the -.12C.
It's idiotic how so many people keep trying to read trends into a couple years of extremely noisy data.
I have NO idea what YOU consider a trend when I wrote the question which is why I asked. Forgive me for not being psychic. Jones uses the word "trend" to talk about Jan 2002- (see question C)
-
Re:When...
What is your point? That a meteorologist or a computer programmer cannot in any circumstances prove a climatologist wrong? They can't say the the use of statistics in the model is flawed, or there is a coding error in the model? I didn't realize that climatologists were born perfect.
Obligatory xkcd ref.
This is one of the dumber statements I've seen in this discussion. Suppose you have 4 stations in a geographic area. 2 are out in the middle of fields way away from any development (and been this way for the last 80+ years) and 2 right next to human development. Do you not see a) which two (all other things being equal) of the 4 stations are going to give you better temperature data b) what the net effect of deleting/algorithmically adjusting the data from the data from the fields is going to be?
1) Here's where naive approaches like yours fail. The stations out in the middle of fields tend to be different, more expensive kinds of sensors than the ones close to human settlement. The cheaper ones tend to report *cooler* temperatures than the more expensive, standalone sensors. So the "urban" stations actually show *less* global warming if averaged in a naive approach.
2) There's a *lot* more than 4 stations in most regions which have correlated temperature anomalies. In the US, generally dozens.
3) The heat island effect *is* cancelled algorithmically, and this is verified by, among other things, comparing calm and windy days.
For something that is supposedly "validated", we are seeing an awful lot of instances of incorrect usage.
Yes, by people like Watts.
What "trends" are you talking about? Like the trend line of 1995-2009 (-0.12C per decade - yes, that's a minus - from Phil Jones no less)? Or are you talking about the one since 1850?
2) Since when do you trust Phil Jones?
3) Phil Jones is one climate scientist among several thousand. He is not the god of climate science.
4) Wrong. Jones says that there is a +0.12C warming trend for that time, but it's not long enough to be statistically significant. And he's right. It's idiotic how so many people keep trying to read trends into a couple years of extremely noisy data. El Nino in particular adds a *lot* of short-term noise. The "-0.12 trend" is for 2002 to present, which is an even shorter time period and even less statistically significant -- as Jones points out.
Are you saying a station next to a heat pump discharge is going to give you accurate readings?
1) Which is why you *algorithmically eliminiate bad stations*. The problem is that you criticize them when you think that they're using said stations, but also criticize them when they mathematically eliminate them. It's a no-win situation that you're trying to put them in.
2) The "bad" stations tend to show *less* warming than the good stations. So "whoops" on your part.
you do not think the urban heat island effect is real?
1) The urban heat island effect is algorithmically cancelled, and the cancellation verified by, among other things, comparing windy days to calm days.
2) There exists a closely monitored "reference network" for a reason, you know.
-
Re:Premature
The U.S. National Academy of Sciences disagrees with you. The American Association for the Advancement of Science disagrees with you. The American Geophysical Union disagrees with you. The National Oceanic and Atmospheric Administration disagrees with you. There are many more, but the point is that the scientists actually studying it are generally convinced. Do you have any scientific organizations that agree with you that the greenhouse gas aspect of it is still up in the air?
At this point, I think that climate deniers are very close to creationists. In both cases, there are people and organizations that disagree with the science. They can talk a good talk, but fail in the actual doing of the science. They can ask more questions than can be answered currently, can take quotes (and emails) out of context, they can use the human failures of people involved in the science against them, and any screw ups (and they certainly exist in both cases) are taken as evidence that the entire science is incorrect. But, they are ignoring the basic science as a whole, discarding what we do understand, and blowing the uncertainties way out of proportion, in order to promote an unscientific point of view. -
Re:Sounds like a coal industry shill
Yet a recent scientific study that specifically uses the surfacestations.org data to analyze the reliability of surface temperature trends shows if anything a slight negative trend bias from the poorly sited weather stations. The paper is "On the reliability of the U.S. Surface Temperature Record" (PDF) by Menne, Williams and Palecki and published in the Journal of Geophysical Research – Atmospheres in 2010. It specifically cites surfacestations.org and Watts. Watts has done the scientific community a service by forcing them to examine the reliability of their measurements more closely and the result is it strengthens confidence in reliability.
Abstract
Recent photographic documentation of poor siting conditions at stations in the U.S.
Historical Climatology Network (USHCN) has led to questions regarding the reliability of
surface temperature trends over the conterminous U.S. (CONUS). To evaluate the potential
impact of poor siting/instrument exposure on CONUS temperatures, trends derived from poor
and well-sited USHCN stations were compared. Results indicate that there is a mean bias
associated with poor exposure sites relative to good exposure sites; however, this bias is
consistent with previously documented changes associated with the widespread conversion to
electronic sensors in the USHCN during the last 25 years. Moreover, the sign of the bias is
counterintuitive to photographic documentation of poor exposure because associated instrument
changes have led to an artificial negative (“cool”) bias in maximum temperatures and only a
slight positive (“warm”) bias in minimum temperatures. These results underscore the need to
consider all changes in observation practice when determining the impacts of siting irregularities.
Further, the influence of non-standard siting on temperature trends can only be quantified
through an analysis of the data. Adjustments applied to USHCN Version 2 data largely account
for the impact of instrument and siting changes, although a small overall residual negative
(“cool”) bias appears to remain in the adjusted maximum temperature series. Nevertheless, the
adjusted USHCN temperatures are extremely well aligned with recent measurements from
instruments whose exposure characteristics meet the highest standards for climate monitoring.
In summary, we find no evidence that the CONUS temperature trends are inflated due to poor
station siting. -
Re:Sounds like a coal industry shill
Yet a recent scientific study that specifically uses the surfacestations.org data to analyze the reliability of surface temperature trends shows if anything a slight negative trend bias from the poorly sited weather stations. The paper is "On the reliability of the U.S. Surface Temperature Record" (PDF) by Menne, Williams and Palecki and published in the Journal of Geophysical Research – Atmospheres in 2010. It specifically cites surfacestations.org and Watts.
Abstract
Recent photographic documentation of poor siting conditions at stations in the U.S.
Historical Climatology Network (USHCN) has led to questions regarding the reliability of
surface temperature trends over the conterminous U.S. (CONUS). To evaluate the potential
impact of poor siting/instrument exposure on CONUS temperatures, trends derived from poor
and well-sited USHCN stations were compared. Results indicate that there is a mean bias
associated with poor exposure sites relative to good exposure sites; however, this bias is
consistent with previously documented changes associated with the widespread conversion to
electronic sensors in the USHCN during the last 25 years. Moreover, the sign of the bias is
counterintuitive to photographic documentation of poor exposure because associated instrument
changes have led to an artificial negative (“cool”) bias in maximum temperatures and only a
slight positive (“warm”) bias in minimum temperatures. These results underscore the need to
consider all changes in observation practice when determining the impacts of siting irregularities.
Further, the influence of non-standard siting on temperature trends can only be quantified
through an analysis of the data. Adjustments applied to USHCN Version 2 data largely account
for the impact of instrument and siting changes, although a small overall residual negative
(“cool”) bias appears to remain in the adjusted maximum temperature series. Nevertheless, the
adjusted USHCN temperatures are extremely well aligned with recent measurements from
instruments whose exposure characteristics meet the highest standards for climate monitoring.
In summary, we find no evidence that the CONUS temperature trends are inflated due to poor
station siting. -
NOT environmental monitoring
NOT environmental monitoring; that's NOAA's job.
Environmental monitoring?
http://www.noaa.gov/about-noaa.html
-- Terry
-
Re:National Aeronautics and Space Administration
Why not create an agency with that job
I'll ask 'eem, but I don' think he'll be very keen... we've already got one, you see!
-
Re:Nobody is going to pay for news
Nobody is going to pay for a news site for the most part. You can easily get the same news elsewhere for free.
And to continue this point, it's not just the "free" aspect, it's also the ability to go directly to the source for the information.
Back in the day, actually not too long ago, the news outlets (papers, radio, TV) served a purpose - they provided a conduit for information transfer. Folks had information (big game scores, courtroom shenanignas, weather forecasts) and needed a way to convey that information to other folks. Similarly, the "end users" desired the information, but didn't have a way to get it directly. The news media connected the two groups, and served a valuable purpose.
Enter the Intarweb. Suddenly, the end user is directly connected to the information source. The news media middlemen are left holding their hats, scrambling for significance.
Probably the worst thing that has happened to the media outlets is transparency. When you have the web at yor fingertips, it's particularly easy to notice that the vast majority of news outlets are simply re-branding the AP or Reuters news feeds. Their collective credibility is shot to hell. They've been branded as "middle men" and not as information sources. The web allows you to go directly to the source. Why would I tolerate some reporter's re-hash of a story when I can interpret the source for myself? Case and point - I can get weather information directly from the National Weather Service rather than getting the dumbed-down version spewed by the local TV station or newspaper. They don't add value (actually they remove it) so I bypass them -
Re:A typo
The problem is that gullible idiots like you make unwarranted assumptions about the quality of the scientific evidence based on no more than faith. And every piece of evidence to the contrary is summarily ignored.
No-one is ignoring the problems with this piece of evidence. The problem with this piece of evidence is that it can't be called that; it doesn't meet the necessary standards of scientific evidence. It wasn't peer-reviewed, and it wasn't from a primary source. It shouldn't have been in there. No similar problems have been found in the peer-reviewed portions of the IPCC report, so we're not going to throw the baby out with the bathwater.
And, yes, I know you're going to mention articles that challenge the conclusions in those areas, but challenge is not the same as succeed. Unless you're going to mention an article that has been peer-reviewed, or one that has not been rebutted, or has a counter-rebuttal that has not been answered, then I'd ask you not to bother, please.
The problem isn't with the "deniers" who are pointing all of these problems out. The "deniers" don't deny climate change or even global warming.
You must talk to different opponents of AGW than myself. I meet lots of people online who even go so far as to dispute a warming trend.
They just deny the right of censorious assholes like you to claim that climate change is a) unprecedented and b) caused by man-made fossil fuels without actual engineering-quality reports showing either of these things to be true or even likely. They aren't the ones in denial - it's you.
I'm assuming don't know this person, so I feel your insults are hasty and based on scant evidence. What were you saying about evidence again?
The smell from underneath the IPCC bandages is pretty bad. The proxy reconstructions of past climate have been shown to be heavily cherry-picked and badly done statistics
Sorry, you appear to have posted a link to Climate Audit's front page. Seeing as they've made lots of claims in the past for which rebuttals exist, it's a little hard to know where to start answering this.
the measurement of surface temperatures by NOAA and NASA appears been heavily manipulated to show warming
No. Data is not being deleted by NOAA or NASA. It is not being supplied to them. The suggested reading is Peterson and Vose 1997 which explains where the data comes from. As for the interpolation claim, if coastal temperatures were being used to estimate mountain temperature anomalies, the anomalies would be larger than reported. You don't believe it? Get the data and work it out for yourself.
as has the temperature records from the Climate Research Unit relied upon for the calibration of climate models - and is the subject of several independent investigations for possible scientific fraud in the US and the UK.
There is no evidence in the emails from CRU for data fraud. If there were data fraud, this could be determined by cross-checking it against the GISS dataset. Unless you believe that everyone's "in on the conspiracy", and are collaborating to fake data. I find such a conspiracy (which, of necessity, would include not only CRU and NASA, but everyone who supplies them with data) highly unlikely.
But you'll ignore it all because it comes from "deniers" and you'll invoke preposterous conspiracy theories involving fossil fuel companies while ignoring the cosying up of nearly entire fossil fuel industry with the alarmists.
I'm hoping
-
Re:Deniers
I've posted this before, but heres a non-comprehensive list of the raw data: knock yourself out.
Data:
NOAA NCDC: http://www.ncdc.noaa.gov/oa/ncdc.html [noaa.gov]
NOAA sattelite data: http://www.class.noaa.gov/ [noaa.gov]
ARM data: http://www.archive.arm.gov/armlogin/login.jsp [arm.gov]
NASA GISS data: http://data.giss.nasa.gov/ [nasa.gov]
NCAR data: http://www.ncar.ucar.edu/tools/datasets/ [ucar.edu]Models:
NASA GISS GCMs: http://www.giss.nasa.gov/tools/ [nasa.gov]
NCAR models: http://www.ncar.ucar.edu/tools/models/ [ucar.edu]That being said - I think this whole 'give me the raw data' thing is just a big red herring. What are you going to do with it when you get it? Do you understand all the sources of the data, their biases and errors? Do you understand how they calculated some of the parametrizations in the models for bulk cloud parameters? Do you think its just a matter of plugging the data into a code and getting a Yes/No result about global warming? Come on! Theres a reason this stuff generally requires a PhD or years of experience to understand. But there it is, lots of data. Now shut up about the data or methods being unavailable.
-
Re:Climate change is a security threat
The data that the scientific consensus used is bogus, they define a day's average temperature as half the difference between the daily maximum and the daily minimum. The only reliable data comes from satellites. No one is arguing that there isn't a link between CO2 and global temperatures, yet I will not let myself believe that this so called consensus really believes that decisions about the fate of mankind is based on such a sparse dataset analyzed by computer code that is at best pathetically sloppy and at worst hard-coded to give the desired result irregardless of the input data. Of course I could be wrong and well educated people really can be that evil.
-
Re:Climate change is a security threat
I'm guessing you don't really want to see the data, and are just being disagreeable, but on the off chance you do, I'll point you to these posts of mine. I'm working on a PhD related to climate change and climate modeling. I've got a pretty good inside look at the process. It's a couple orders of magnitude more complicated than I had assumed going into it. Doom and Gloom? Only if you don't have insurance. If you have that, no worries. If you don't, you're in a fair bit of trouble in the next 50-100 years. Feel free to peruse, and ask me questions - I'll do what I can to answer.
On Climate Models
Who's screwed
Why Data is hard to work with
BATS oceanographic data
NCAR Reanalysis data
The LEDO data
There you have it - a brief explanation of climate science as I understand it, and links to some data. -
Re:This is BS
We have a shuttle launch every few months, and every time the general public's reaction is almost total apathy. Satellites are launched into space all the time, and nobody cares.
Do you judge the success of a space program based on the public's reaction?
Does the public care when a 747 (or Aerobus or whatever) takes off from an airport? Do you use the public's reaction to judge the success of the airline industry?
He doesn't exactly say it, but I think Lu's underlying point is that NASA is run like a PR agency. What mission will grab the public's attention? How can we get the public excited about space flight again? Go to the moon? Go to Mars?
Are you excited about NIST? NOAA? Do you judge their success by what the public thinks about them? Do they try to grab the public's attention to justify their budget? No, they just do their job year in and year out, and that includes R&D.
Lu's point is that maybe NASA shouldn't worry so much about their PR. Maybe they should concentrate on more frequent, but smaller steps. And build on those smaller steps, instead of always trying to grab the public's attention by making giant leaps (heh).
-
Re:I was wrong, the raw data is easily accesible.
I did in fact find out about darwin from a skeptic site. that doesn't mean it's wrong, and my preliminary checking indicated that they had a point. I have since one upped real climate though...
I got the monthly averages from GHCN Monthly v2. After importing both adjusted and raw mean temperatur data into Access, I calculated the adjustment for every month, station, and year. If the data in either file said -9999, I set the adjustment as 0. I didn't take the time to alter the data structure so i could easily remove just the faulty months, and the extra zeroes should only serve to reduce the magnitude of adjustments. I then averaged across all stations for each month/year, and posted it. There is a definite upward trend in the adjustments for the 20th century. Not sure why the adjustments suddenly drop down at the start of the century.
Would you agree that I have not cherry picked with this chart, and that the GHCN adjustments themselves contribute to an upward climb in the data regardless of whether the adjustments are valid or not? -
Re:Nice try
Well, I get notified when there's a reply to one of my post and often (but not always) respond.
You really ought to read the Wikipedia article on ozone depletion. It has a good overview of of ozone in the atmosphere. The science on it is quite robust. Ozone depletion is still a problem and will be for a long time. Please point me to the NASA scientists who couldn't find the ozone hole because I don't believe you. No creditable scientist ever said there would be no ozone up there. It forms naturally in the stratosphere when an O2 molecule dissociates after absorbing an ultraviolet photon. That single O atom then combines with another O2 to form O3 or ozone. They just said our increasing the available chlorine in the atmosphere through release of CFCs would reduce the amount of ozone and they've shown it to be true by measurements. Ozone is a very important gas in the atmosphere as it protects the surface and us from excess ultraviolet radiation.
Regarding the Russians, check this comparison of the IEAs stations to the CRUs stations. After 1950 there is practically no difference between them. That doesn't indicate any fraud to me.
What does Pat Buchanan's article have to do with the Russians? And what specifically is hard to dispute? All I see are some out of context facts and outright misunderstanding of what they mean. The increase in Antarctic sea ice is not unexpected. It is in part comes from the ozone hole causing the circumpolar winds to strengthen thus isolating Antarctica more strongly from the rest of the planet. Recent observation from the GRACE satellite show that East Antarctica has been losing total ice mass just like West Antarctica.
Steve McIntyre's post only covers the continental US, 1.6% of the Earth's surface area. 1934 may have been the hottest year in the continental US but what does that have to do with global temperatures? This year the continental US has been a bit cooler relative to the rest of the world. 2009 is still going to be in the top 10 global temperature years (likely #2 or #3).
Any data that may be missing or withheld is relatively trivial. The vast majority of climate and related data is available if you care to look for it. The raw data the CRU used and deleted is still available from the original sources. Raw temperature data from around the world is available from the Global Historical Climatology Network (GHCN). Source code is available for the GISS ModelE GCM. There are a bunch of other links to both raw and cooked data as well as directories to other sources on this page.
I've already spent too long on this post so I'll sign off for now. Ciao.
-
Re:Nonsense
The CRU has not lost any raw data. They deleted processed data that they no longer had a use for. The raw data they used is still available from the original sources.
Phil Jones stepped down temporarily as head of the CRU because of the FUD manufactured heat surrounding him. When he's exonerated he may decide to resign anyway since the heat probably won't go away completely for a while. They may find a few nits to pick but I'll be shocked if they find any real scientific impropriety (as I imagine you will be shocked when they don't
Raw data is useless without processing. If you're talking about raw surface temperature data it's collected from hundreds of weather services and thousands of individual weather stations and other sources. There are discontinuities and errors in those records that have to be accounted for. I imagine many if not most of those sources have had an instances of discontinuities in their records. For instance a weather station may change thermometers for various reasons, or an urban heat island may develop around a station, or a station may be so poorly run that its data is unreliable, or they may find a systemic error in the measurments like they did with the satellite data, or... By studying the causes of those errors you can correct for them thus normalizing the data, or if you can't correct for them you can throw that particular data out as unreliable. Unless you're willing to take the time to make all of those adjustments (massage the data) anything you try to say about the raw data is bogus because you're not correcting for known errors. If you're going to challenge the station and data selection you need to do it with scientically rigorous information, not some blather about your perception of what some emails said.
And the vast majority of the raw data is available if you care to look for it. Temperature records from around the world are available at the Global Historical Climatology Network (GHCN). Source code is available for the GISS ModelE GCM. I imagine you will have to go to the original researchers for much of the proxy data though.
Are you a Brit? You only mentioned British services and the IPCC. Do you think NOAA or GISS and any of the other services around the world doing the same science feel slighted? The point is that CRU-HADLEY-MET is but one (well 3) of many different organizations around the world studying the subject. You have to impeach them all since they're mostly (if not completely) in agreement with each other.
-
Re:You need to know some stastics.
Wadda ya mean normalization is never justified? You normalize data to account for things like the difference between old and new instruments, or a change in measurement technique, or measurements that were off in a consistent way because of a miscalibrated instrument, or to compensate for the UHI effect or... Without normalization the data is nearly useless. As long as the methods and reasons for the normalization are disclosed its a perfectly valid statistical technique. The information is available if you care to look for it. Do you want them to personally explain it to you?
The GISS (NASA) & NOAA data is 100% available. There is lots of raw data at the Global Historical Climatology Network. You can get the full code for the GISS ModelE GCM here.
Modern weather forecasting depends heavily on computer models. The satellite and radar data as well as regular weather station data are inputs to the models. Often meteorologists who are familiar with a particular region can improve the forecast with intuition but that's largely because it hasn't been included in the model yet, probably because it's on too small a scale to be included in the model.
Chaos is constrained by the physical limits of a system and can be analyzed statistically to help determine the constraints that lead to those limits. Thus the chaos of weather and natural variability can be analyzed to determine the factors that constrain climate. The better you understand the constraints the better you can understand how changes in them will constrain climate. That's what GCM's do. They incorporate our understanding of the constraints of climate into the models and project possible future climate outcomes based on various scenarios for changes in the constraints.
-
Re:Why Are We Deferring to an Economic Organizatio
Generally, that's done. They're called data repositories and journals, and they generally have that sort of information.
Of course, it's usually phrased "we treated the data as per Julian (1993) and..." so unless you've read that paper and are intimately familiar with it, it doesn't look like they described their methods at all. As a newbie in the field, I run into this all the time. There are long-standing "tried and true" methods for calibration and interpolation. However, unless you've spent a decade reading and working with such methods, it's not apparent. I still have to ask old-timers what's going on in a lot of papers. It's either that, or read dozens more to find out what's going on in this one.
As for data, there is a shitton available if you go looking. Try the BIOS datasets, the NCAR reanalysis(filtered and interpolated, so it's "nice" data) data, etc. The issue isn't in getting ahold of the data. The issue is in being able to do anything with it. Sure, you can grab the NCAR reanalysis data, and do stats on it. But without knowing about the MJO, ESNO, the NAO, the CTI/AL, Indian Monsoon, etc., you're going to find all sorts of signals. All of which bleed out anything that hasn't been well discovered and documented.
A pure statistician will find tons of stuff in that data. 99% of it will have already been accounted for. However, to understand all the stuff that you're going to find with stats, you need to be immersed in a lot of different publications, spanning the last 90 years or so. And to understand those, you'll need a lot of background knowledge on atmospheric physics, oceanography, etc. And if you're going to wade through 90 years of research, and study atmospheric physics and oceanography, you're probably not going to do so at home in your basement. In fact, there are specialized places to do just that...
For a decade I wasn't doing climate science. I dabbled in it, read papers, thought about stuff, had the same ideas about it as the bulk of -
Re:Why Are We Deferring to an Economic Organizatio
There are many datasources and many analyses, and of equal prominence to CRU's datasets are NOAA's and NASA's. No, the different datasets don't match up perfectly (for example, whether 1998 or 2005 was the hottest year -- they were close), but the datasets all yield similar results.
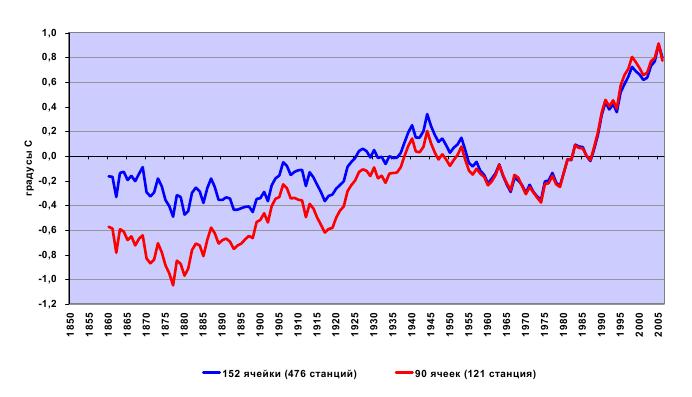
And the similar results are of course conclusive. It couldn't be that corrections to the raw data could have contributed to the 'observed' warming. The NOAA would never do something like that, only the oily Russians would try a trick like that. Well, actually they did, but at least they have documented it.
You'll notice the overall impact of hand made corrections to the data increases from 0 degrees around 1900 all the way up to a full 0.5F of warming by 2000. Seems to me that when nearly half the observed warming over the last 100 years lies entirely in 'corrections' you do not have independent verification. It looks a lot more like applying corrections to get the correct/expected result.
-
Re:Why Are We Deferring to an Economic Organizatio
Urban vs. rural trends, w/many refs: link
Windy vs. calm: link link2.
The use of jump-point analysis to detect station incongruities: link
The use of a closely monitored reference network as a control:
A general overview of calculations, detrending, etc: link.
Further studies on that: link link2Now why the hell would you think yourself qualified to be involved in this discussion if you didn't already know this?
Don't you get it? The people raising these concerns are *not scientists*, *have no background in the field*, and *don't know what the hell they're talking about*.
-
Re:Why is there even a debate?
Because of graphs like this: http://www.ijis.iarc.uaf.edu/seaice/extent/AMSRE_Sea_Ice_Extent.png that contradict your very first statement about the arctic ice. When you look at it, you see that there is more ice now than the previous 2 years
A number of problems with your argument:
1. Sea ice extent is not the same as sea ice volume. Extent measures surface area covered, but not the thickness. Survey of the thickness of the arctic sea ice (by both satellite and manually) have shown that the overall ice volume of the arctic is rapidly declining. See here for some data: http://www.arctic.noaa.gov/reportcard/seaice.html
2. Finally, given the amount of noise in the signal and the number of years it takes to make a statistical difference show up, it is impossible to make any determination of current trends using only a few years. Climate trends need to be taken over decades, not a few years. The shorter the time period, the more likely you are just measuring differences in weather and not necessarily climate.
-
Re:I'm gonna miss yellowstone..
They got eaten by scientists after a period of torture.
This made me laugh right out loud. Bravo!
-
Re:I'm gonna miss yellowstone..
They got eaten by scientists after a period of torture.
-
Re:Skeptcisim vs Propoganda
You can find links to NOAA's data here. If you want links to the historical raw data I believe you can find it here or here but you may have to apply corrections to the data yourself.