 Slashdot Mirror
Domain: nsidc.org
Stories and comments across the archive that link to nsidc.org.
Comments · 236
-
Re:I'll take this one!
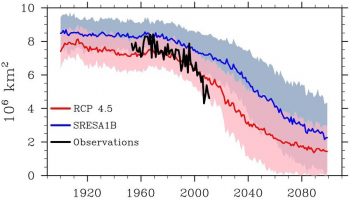
Sea ice in the Arctic tends to reach its lowest during September. Meaning if you're going to be ice free, that's probably the month when it will happen. Yet the IPCC's own models do not say it will happen, just that there is a chance it could. In fact, RCP 2.6 says it probably will not happen (at least most of the tolerance range is well above the "ice free" level of 1MM km of ice in the Arctic).
-
Re:Oh boy, so much fail in one post.
So you don't dispute sea rise has been negative for about six years?
If he doesn't I will. So will the US National Snow and Ice Data Center you supposedly cite for that claim.
https://nsidc.org/data/seaice_... - the data is still following the downward trend, even including your cherry picked one year outlier.
-
Re:Carbon footprint of this?
Here are some references. You can make up your own mind I guess.
"When an ice cube melts in a glass, the overall water level does not change from when the ice is frozen to when it joins the liquid. Doesnâ(TM)t that mean that melting icebergs shouldnâ(TM)t contribute to sea-level rise? Not quite.
Although most of the contributions to sea-level rise come from water and ice moving from land into the ocean, it turns out that the melting of floating ice causes a small amount of sea-level rise, too.
Globally, it doesnâ(TM)t sound like much â" just 0.049 millimetres per year â" but if all the sea ice currently bobbing on the oceans were to melt, it could raise sea level by 4 to 6 centimetres.
Fresh water, of which icebergs are made, is less dense than salty sea water. So while the amount of sea water displaced by the iceberg is equal to its weight, the melted fresh water will take up a slightly larger volume than the displaced salt water. This results in a small increase in the water level."
https://www.newscientist.com/a...
https://physics.stackexchange....
"When you learned about Archimedes back in elementary school, your teacher probably told you that a floating object displaces an amount of water equal to its own weight. Although an ice cube pokes up out of the water, when it melts, the level of the water should stay the same. Extrapolate this concept to an iceberg floating in the oceanâ"a bigger version of the ice cube in your water glassâ"and you would think that melting icebergs shouldn't contribute to sea level rise. Well, you'd be wrong, say geoscientists at the University of Leeds.
In their study, published this week in Geophysical Research Letters, the researchers used satellite observations and a computer model to assess the impacts of melting icebergs. The total amount of floating ice that is turned into ocean water each year is equivalent to 1.5 million Titanic-sized icebergs. Due to differences in the temperature and density of the ice and water (the seawater is warmer and saltier than the icebergs that float in it), when the icebergs melt, the resulting ocean water is 2.6 percent greater in volume than the volume of water that the iceberg had displaced."
https://www.smithsonianmag.com...
"In a paper titled "The Melting of Floating Ice will Raise the Ocean Level" submitted to Geophysical Journal International, Noerdlinger demonstrates that melt water from sea ice and floating ice shelves could add 2.6% more water to the ocean than the water displaced by the ice, or the equivalent of approximately 4 centimeters (1.57 inches) of sea-level rise.
The common misconception that floating ice wonâ(TM)t increase sea level when it melts occurs because the difference in density between fresh water and salt water is not taken into consideration."
http://nsidc.org/news/newsroom...
There are plenty more, but if that doesn't convince you then I imagine nothing will.
-
Re:First "Peak Oil" and now this?Peak Oil is happening, pretty close to as it was predicted to- that well before oil ran out completely, oil prices would go up and start spiking at semi-random moments. You can see this pattern and the rapid fluctuations in the oil prices here http://www.macrotrends.net/1369/crude-oil-price-history-chart.
Who remembers being told we are heading into a new ice age?
Sigh. In the 1970s, some people in the media claimed that there would be an ice age; scientists were in fact already talking about global warming https://skepticalscience.com/ice-age-predictions-in-1970s-intermediate.htm.
Why do we pay attention to this crap. It's just like a new fad diet.
Because this "crap" happens to be pretty accurate and pretty concerning. See e.g. https://xkcd.com/1732/, and look at changing sea ice levels http://nsidc.org/sites/nsidc.org/files/images/cryosphere/sotc/arctic-antarctic-anomaly-trend-1978-2017.png http://nsidc.org/cryosphere/sotc/sea_ice.html.
-
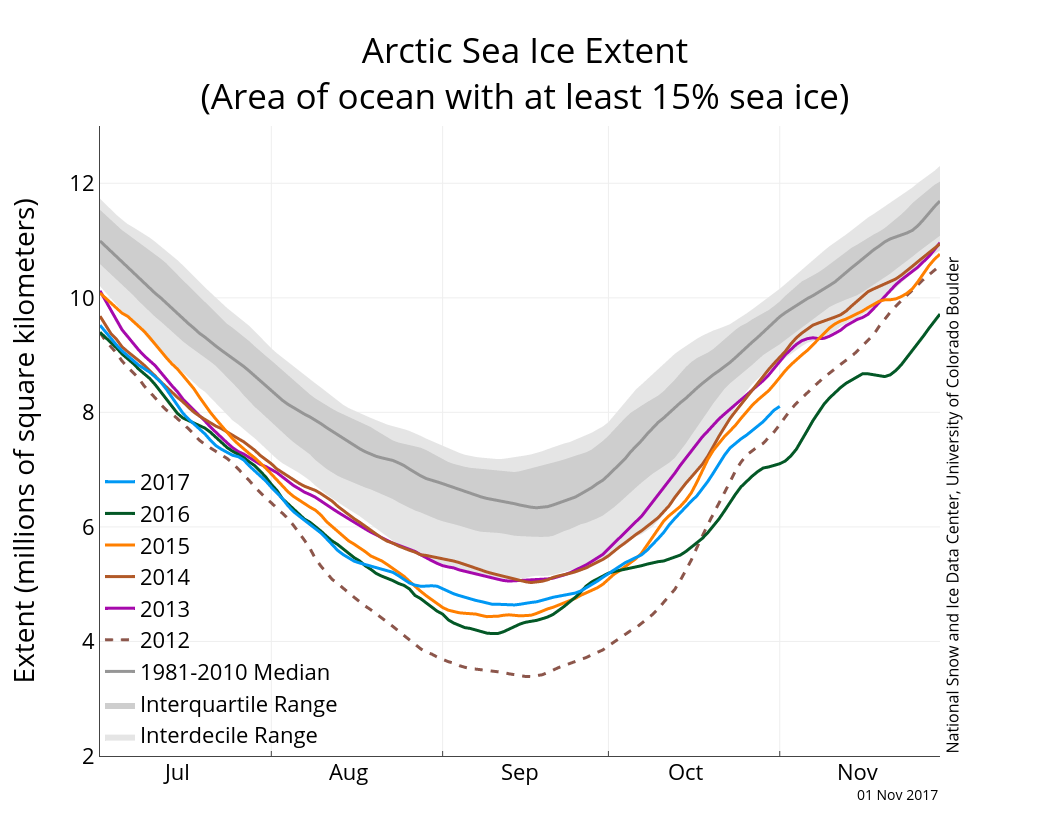
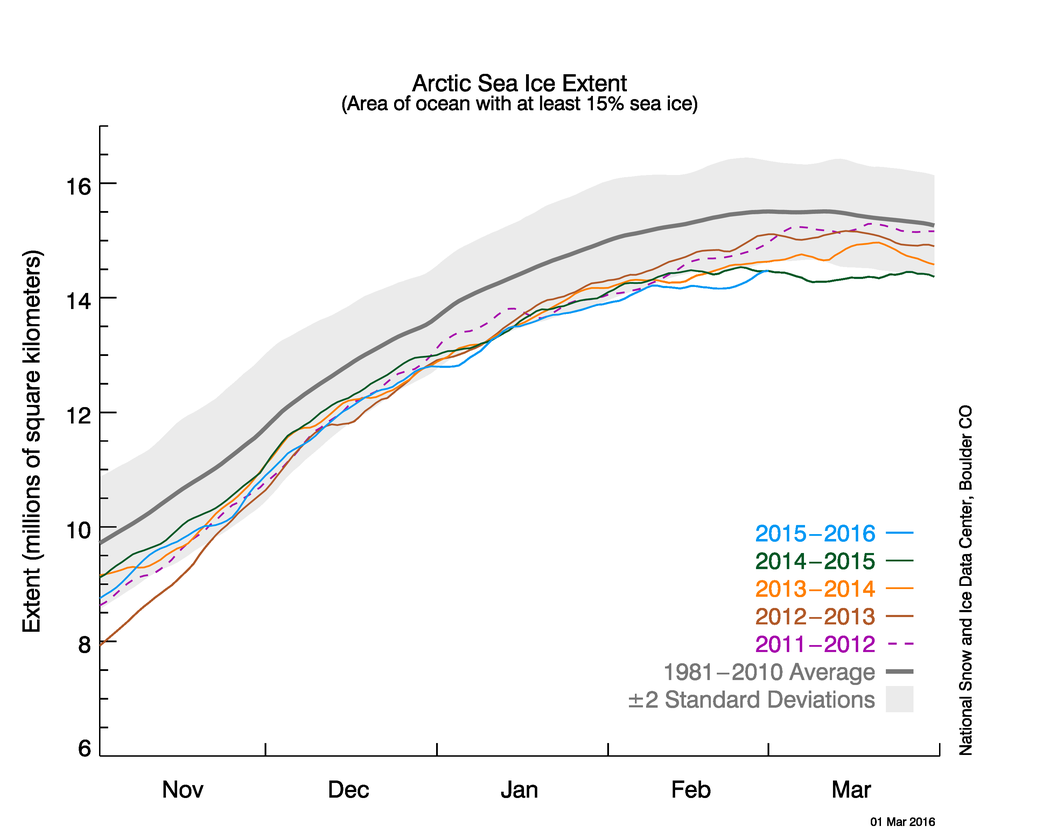
Re:Ice free conditions?Tony Heller aka Steven Goddard is not an expert. And even you should see the scam of showing not-even-all of January data, and comparing two isolated data points on ice thickness. Actual scientists are actually monitoring this, and ice thickness, extend, and volume are all massively down. See e.g. here for a much more detailed view. Note the grey line at the top? That is the long-term average...
For extend, play with this interactive viewer. The decrease is, of course, not monotonous year over year, but the long term trend is depressingly obvious...
-
Re:Sadly
-
How to do statistics right
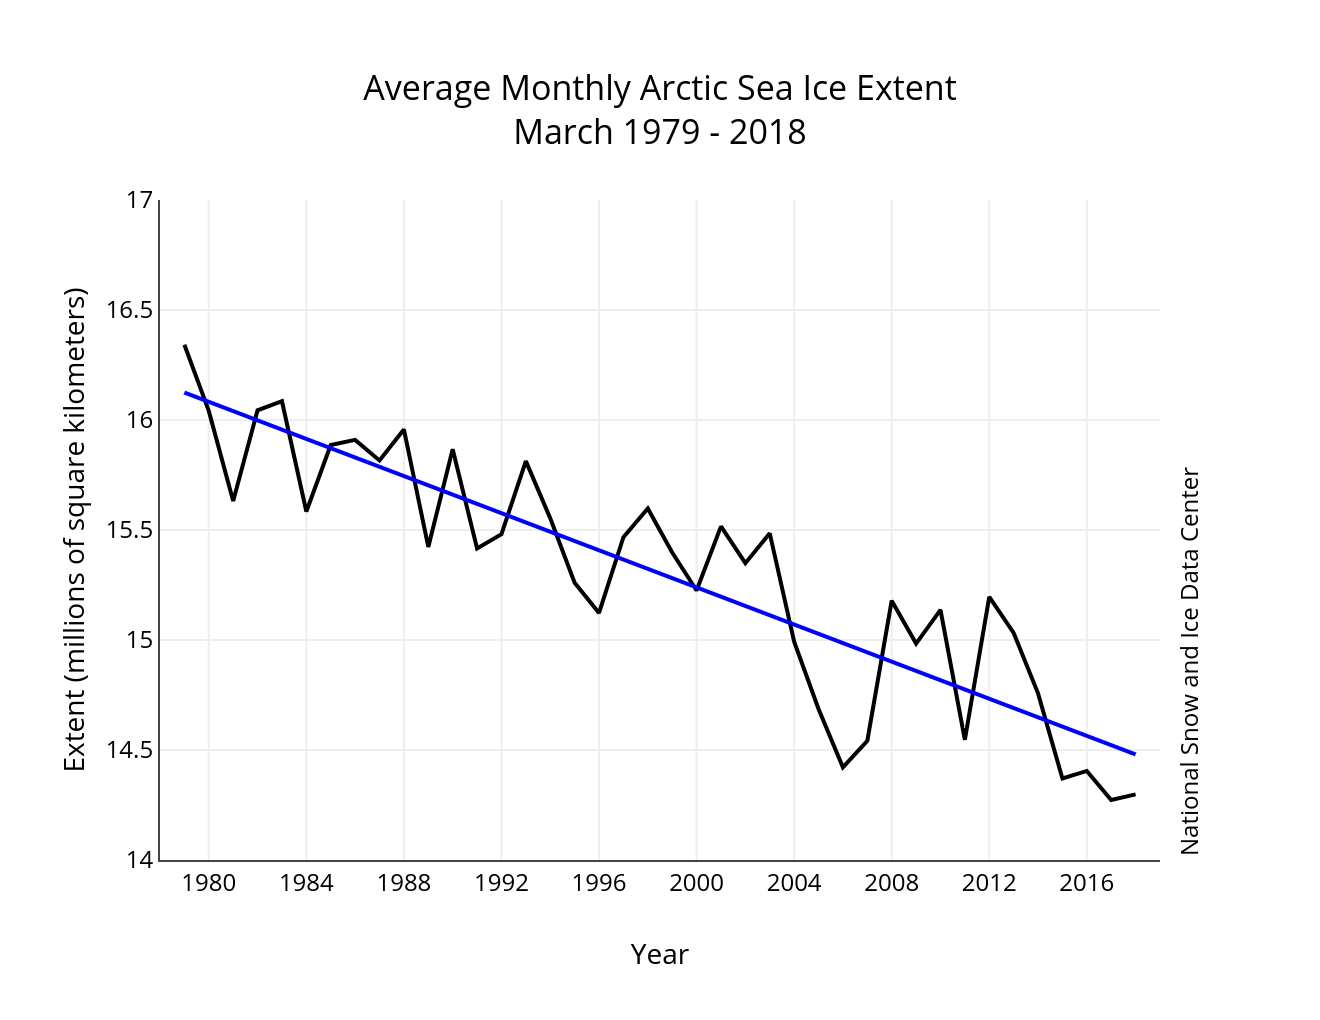
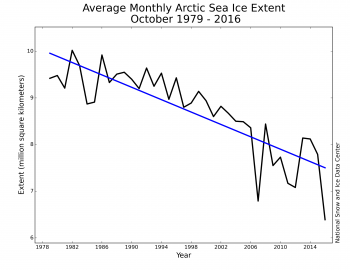
No, the chart gave the average from 1981 to 2010, and also the the two standard deviation error bar. This is an example of how to do statistics right: compare to averages, show standard deviations, and link to the data.
And 1981 is not "a peak"-- in fact, if you look at the data (I assume you didn't), it is pretty much identical to 1979, 1980, 1982, or 1983.
The interactive version is here, allowing you to look at individual years: https://nsidc.org/arcticseaice...
-
Extend of sea ice
If you wish to prove a point, claiming "I already did!'" is not evidence. Global warming is happening, but you must be consistent and not lie to convince others. 2017 arctic ice is within historical norms unless very, very careful selection of beginning and ending years to start at peaks (1972, 1981, 1996, 2008) and end in valleys (1985, 1995, 2007, 2013, 2016).
I agree with your points that it's important to be careful with data, but no, at the moment it looks like Arctic ice is significantly lower than historical norms. Here's the graph as of last month: http://nsidc.org/arcticseaicen...
Interactive chart is here: https://nsidc.org/arcticseaice...
If you want total volume, and not coverage, the best data is from the NASA GRACE mission (measuring gravity). That mission is now over. But here's data: http://polarportal.dk/en/groen... , and here's a visualization through 2014: https://gracefo.jpl.nasa.gov/r...
-
Re:Goes back to sleep...
Sounds more like a failing of English comprehension of the phrase "as early as".
It's kind of like saying "We could run out of gas and our car could roll to a stop as soon as 50km from now", and when the car runs out after 55km, the passenger turns to the driver and says "See? Your prediction was wrong." Whether the prediction is correct in detail or not does not change the fact that you will run out of gas if you don't fill up the tank again, and the amount of gas in the tank is declining, so you're foolish if you ignore the obvious trend.
It's the same situation for seasonal ice in the Arctic Ocean. There is no sign of a persistent reversal of Arctic ice loss. It continues. Some years there's a little less, some years a little more, but the trend over the years is very obvious, and the last few years is way off the norm. If we "run out" of Arctic sea ice in the 2030s rather than (obviously didn't happen) 2014, big deal. The prediction was already expressed with uncertainty, all the more detailed studies of the question provide a range of possibilities, and while Gore can be faulted for quoting the worst-case scenario, he and the scientific studies aren't going to be fundamentally wrong if it's a couple decades later. It's still going to be something that hasn't occurred on the Earth in many thousands of years.
-
Re:How thick is the ice?
The Arctic Sea's ice thickness is likely just a few meters, even though the inland ice sheet can be thousands of meters thick.
-
Re:Global warming makes ice!
I took statistics in college and one thing they teach is that not everything has to line up to show a trend. There will be outliers. The global warming alarmists need to admit that there will be outliers once in a while or they start to sound like fanatics instead of scientists.
If you took a statistics class you should be able to recognize the trend.
http://nsidc.org/arcticseaicen...Of course, there are still outliers on top of the trend.
-
Re:Fake news, see the MASIE data for yourself
Mark Serreze is a well-known person in the climate debate community. But the link above is to HIS OWN data which directly contradicts his statements in the NYT article. I'm not attacking him personally, but I have substantive conflict with the way he conveyed the veracity and conclusions about his own data.
His own data, which he points out should not be used "when comparing trends in sea ice over time or when consistency is important". https://nsidc.org/data/masie/masie_faq
Because a tool do a certain thing is usually a terrible tool do do something else. Unless you try to prove a point that is only in your head. And MASIE is a tool to tell were the edges of sea ice are more precisely than other such surveys, and the area calculated is just a side product. https://nsidc.org/data/masie/about_masie
-
Good News!The good news, for those who want to bury their heads in the sand, is that there is a good chance that the satellite record will be interrupted. Due to the premature failure of the most recently launched sensor in the SSMIS/DMSP (Special Sensor Microwave Imager and Sounder/Defense Meteorological Satellite Program) we are down to two sensors both of which are well past their nominal lifetimes.
Meanwhile the next satellite in the series has been canceled.
The scientists will try to use other kinds sensors to maintain the continuity of the data if they have to; but that will just give the deniers another excuse for ignoring reality.
This link http://nsidc.org/arcticseaicenews/2017/03/another-warm-month-in-the-arctic/ will take you to the right page; unfortunately they don't have the needed anchor links on the page to direct you to the right paragraph. -- Search for: "Continuity of the sea ice record" without the quotes.
It's wonderful. First the head of the EPA says there isn't enough evidence of AGW to support doing anything, then his boss (proposes) killing the efforts to get more evidence.
-
Re:20,000 years ago
A quick Google search disagrees.
If the Greenland ice sheet melted, sea level would rise 6-7meters. https://nsidc.org/cryosphere/quickfacts/icesheets.htmlMuch as I hate "citation needed" tags, I would like to know where you got 15m-17m from.
-
Re:Fake news, see the MASIE data for yourself
Yes, because when dealing with a complex topic, rather than listening to professionals and peer-reviewed research, I like to play amateur scientist and get all my info from blogs.
FYI, you can make your own comparison graphs here. On the about page it has links to all of the datasets, which you can download: Sea Ice Index, Near-Real-time DMSP SSM/I-SSMIS Daily Polar Gridded Sea Ice Concentrations, and the NASA-produced Sea Ice Concentrations from Nimbus-7 SMMR and DMSP SSM/I Passive Microwave Data.
2. When should I use MASIE and when should I use the Sea Ice Index?
Use the Sea Ice Index when comparing trends in sea ice over time or when consistency is important. Even then, the monthly, not the daily, Sea Ice Index views should be used to look at trends in sea ice. The Sea Ice Index documentation explains how linear regression is used to say something about trends in ice extent, and what the limitations of that method are. Use MASIE when you want the most accurate view possible of Arctic-wide ice on a given day or through the week.
-
It means we're winningOne of the website I check every morning is the daily Arctic sea ice extent.
http://nsidc.org/arcticseaicen...
And I have a really good feeling that this will be the year that humanity finally gains the upper hand in our millennial struggle against the Arctic ice cap. Once the ice cap melts completely, even temporally, it will shift the equilibrium of seasonal oscillations. Every winter it will freeze a little less; every summer it will thaw a little sooner. Until our final victory is inevitable. Congratulations everyone. And keep up the good work.
-
Re:I smell a rat...or alternative facts
Considering that Antarctic ice has been at record levels the last few years, this seems to correlate pretty well with that...
Except since October of 2016 Antarctic sea ice has be mostly at record low levels.
You'll have to click on the "Antarctic" button and use the legend on the right to highlight different years. I suggest you highlight 2016 then start clicking other years on and off to make the comparison.
-
Re:Sea ice vs projections
Here's a more up-to-date graphic: http://ocean.dmi.dk/arctic/plo... Not sure why yours shows less than 4 million square km in 2012, and the up-to-date one shows over 14 million square km currently. Maybe it's multi-year ice? I know the summer extent of ice in the arctic dips down to about 4Mkm^2 during summer...
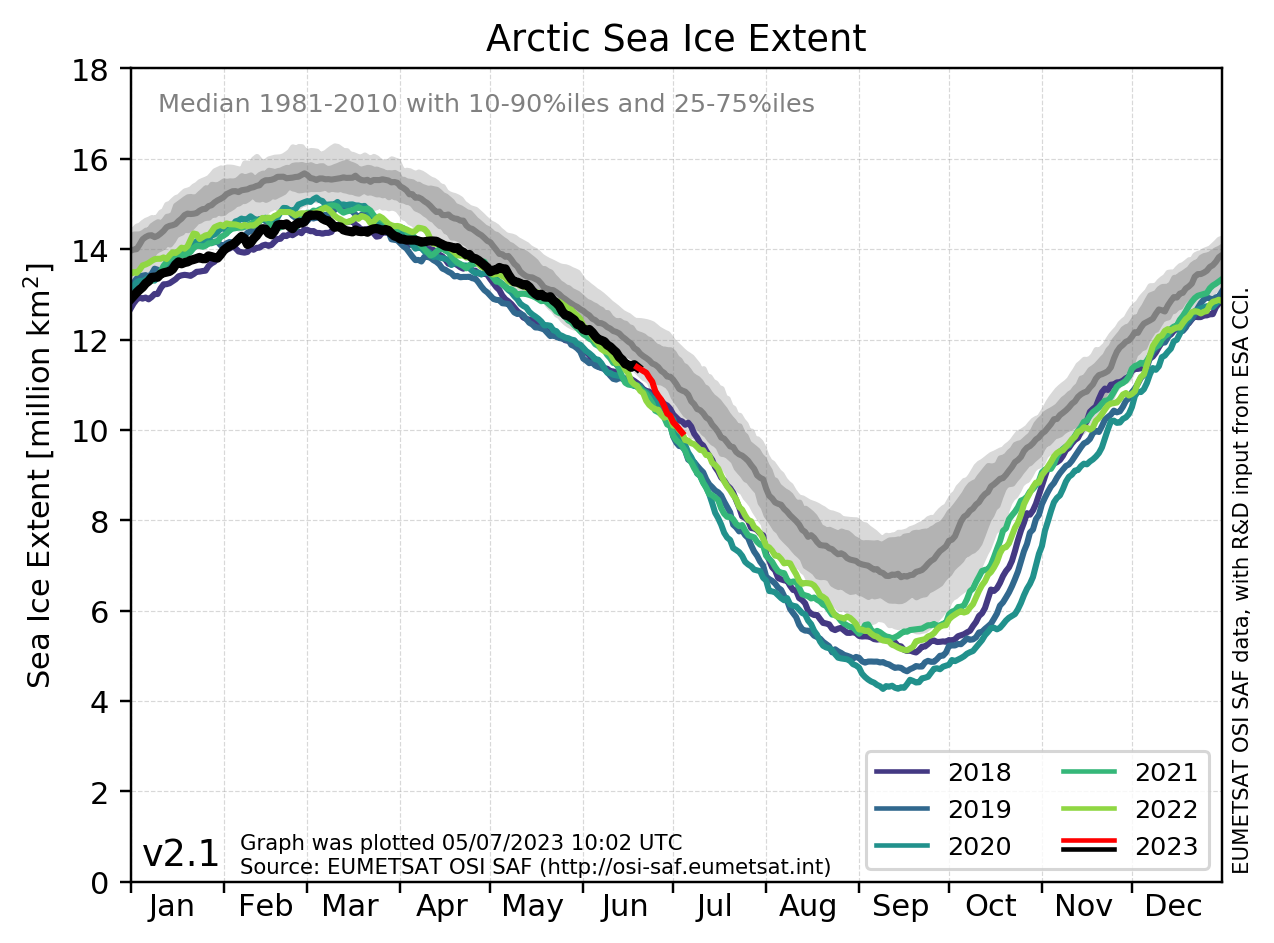
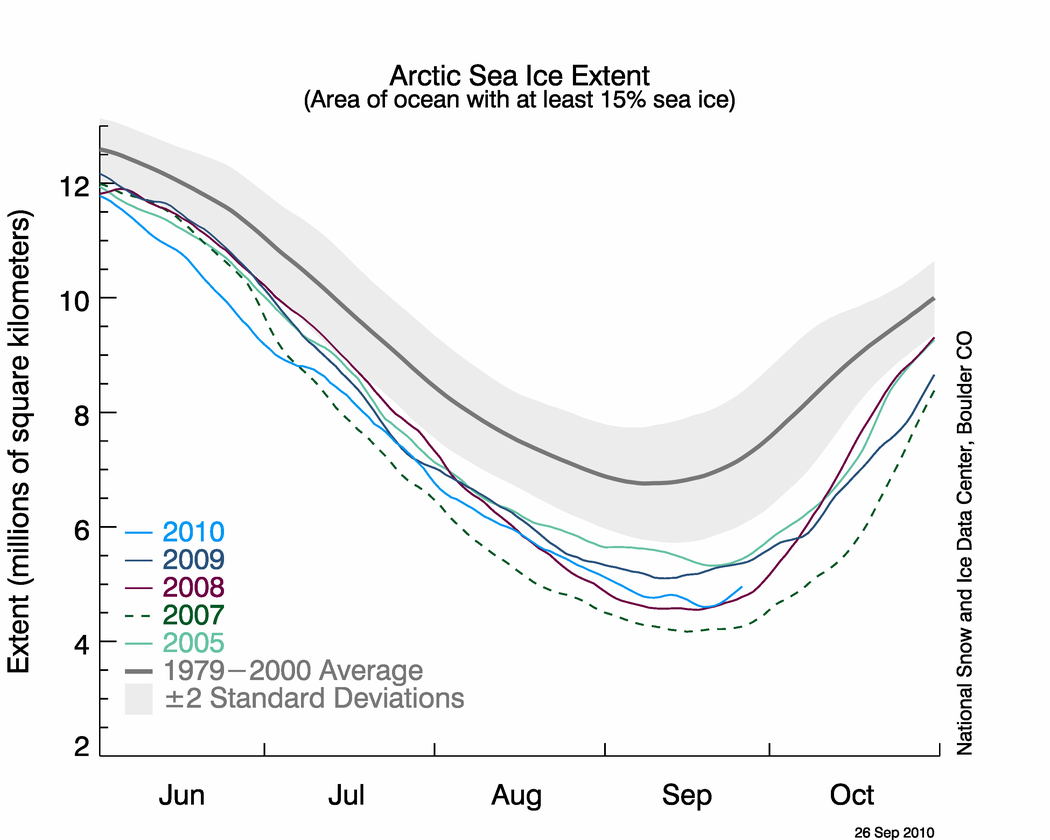
Arctic sea ice always retreats in summer and regrows in winter. The original graph showed development of the yearly minimum extend (which typically happens in September). September 2012 was the record low for arctic sea ice extend so far, going down to 3.3 million square kilometres (although all the last years have been below two standard deviations). At the moment, we are shortly before yearly arctic sea ice maximum - that's why we have 14 million square km. This is a record low for this time of the year. Indeed, day over day, sea ice extend has been at record low for the last few month, compared to the same day in other years. There is an excellent interactive map at the NSIDC.
-
Re:Al Gore predicted...
Cool story, bro. Here's what he actually said:
Last September 21 (2007), as the Northern Hemisphere tilted away from the sun, scientists reported with unprecedented distress that the North Polar ice cap is "falling off a cliff." One study estimated that it could be completely gone during summer in less than 22 years. Another new study, to be presented by U.S. Navy researchers later this week, warns it could happen in as little as 7 years.
So Al Gore didn't predict anything, he cited an actual researcher.
The Navy researcher that leads this "new study" team that the former vice president alludes to is Wieslaw Maslowski at the Naval Post Graduate School in Monterey, California. The team's research was funded by the Department of Energy (DOE), the Office of Naval Research (ONR), the National Science Foundation (NSF), the National Aeronautics and Space Administration (NASA) and the National Oceanic and Atmospheric Administration (NOAA).
Maslowski also did not say "by 2013" in his original research in 2007 or when it was republished in 2009. This grandstanding about sea ice and Gore, for whatever reason, is a huge and egregious deception. The actual prediction from Maslowski's 2009 publication is, "Autumn could become near ice free between 2011 and 2016."
And not even the researcher who did make a prediction said exactly what you claim they said.
However, now that we have actual measurements for 2011-2016, we can see that the lowest autumn sea ice extent for the period in question was 3.389 million km^2 (Sep 16 2012). That's the lowest on record and less than half as much as the same day in 1979, but arguably still too high to call it "near ice free". So Maslowski's worst-case prediction didn't come true, and now you can be less wrong on the internet.
-
Re:Sea ice vs projections
Here's once more with a clickable link: http://nsidc.org/arcticseaicen...
-
Re:Failure of Big Science
I'm asking for citations where the predictions were way off.
These are a dime-a-dozen. The Internet is full of such lists assembled. But they don't necessarily disprove anything — it is normal for a scientific discipline to fail sometimes. This article even analyzes different ways of detecting and dealing with such failures.
Trouble is, successful ones are so hard to find...
Scientists predicted in 2000 that kids would grow up without snow. Dr. David Viner, a scientist with the climatic research unit at the University of East Anglia, told the UK Independent in 2000. Fail. “End of skiing” in Scotland. Predicted in 2004:With the pace of global warming increasing, some climate change experts predict that the Scottish ski industry will cease to exist within 20 years.
It is now 2017, but snow is still plentiful in Scotland. Indeed, the 2014 was the snowiest since 1945. Do you think, the 2004 prediction will come true by 2024?
The Arctic would be “ice-free” The 2007 prediction, echoed by Al Gore, promised "ice-fre Arctic":“you can argue that may be our projection of [an ice-free Arctic by 2013] is already too conservative.”
Whether or not Arctic sea ice is at "record low" or not, the Arctic Ocean is decidedly not "ice-free" today.
Yet you've provided zero. Odd.
I made no claims requiring citations. I merely pointed out, that folks claiming "science is settled" typically disappear, when asked for successful prediction of their favorite science.
Nope. If you actually believe in science, I have to provide you with successful ones that survived peer review and replication
That may be too onerous a requirement in the case of Climate Science — the experiments take many years, so any replication is difficult.
-
Re:Paging Dr. Faustus
I always find this funny that so many studies say "The Arctic is warming and there should be no more ice cap by 2050". I remember some US scientists said there would be no ice in the Arctic by 2013, and look at this graph. The arctic ice cap is currently a little over 13 million square km.
Yes, it may be shrinking a little, but the sampling period is extremely short, compared to our planet's age. This can or cannot be caused by humans. But hey, anyway humans won't survive Earth, which is scheduled to disappear anyway in the next 5 billion years... Unless we disseminate elsewhere in our universe, we're doomed.
How can you link to a text that says "could be ice-free in summers" and claim it says "there would be no ice (full stop). The ice cap is not "shrinking a little", it's shrinking massively. "Currently" it's the middle of winter, when the sea ice is always expanding to nearly the same level (basically, it covers the arctic until it runs out of ocean). In the arctic ocean, the summer minimum is the most important measurement. That said, the arctic ice has been at or near record low for the entire winter, and for good measure in this year antarctic sea ice also is unusually low. The newly formed first-year ice is so thin that it melts very quickly in the summer, probably giving us another record low, and leading to more heating, as the sunlight is absorbed by the water, not reflected by the ice.
You have a point about the 5 billion years, but most of us have a somewhat shorter perspective - and even those with the long perspective may want to give us enough time to escape this doomed planet before things get really ugly.
-
Re:Paging Dr. Faustus
I always find this funny that so many studies say "The Arctic is warming and there should be no more ice cap by 2050". I remember some US scientists said there would be no ice in the Arctic by 2013, and look at this graph. The arctic ice cap is currently a little over 13 million square km. Yes, it may be shrinking a little, but the sampling period is extremely short, compared to our planet's age. This can or cannot be caused by humans. But hey, anyway humans won't survive Earth, which is scheduled to disappear anyway in the next 5 billion years... Unless we disseminate elsewhere in our universe, we're doomed.
You are not taking into account any changes between then and now, but even worse, you have no data on the depth of the ice, only on the area. The square kilometers says nothing about the volume, this however, does: https://nsidc.org/cryosphere/q...
Just because one model (and your BBC article was about ONE model which contradicted other model) didn't accurately predict when all the ice will be gone, doesn't mean that you should throw all models in the bin. Right now, most models say that the ice will be mostly gone somewhere between 2040 - 2100. -
Re:Paging Dr. Faustus
I always find this funny that so many studies say "The Arctic is warming and there should be no more ice cap by 2050". I remember some US scientists said there would be no ice in the Arctic by 2013, and look at this graph. The arctic ice cap is currently a little over 13 million square km.
Yes, it may be shrinking a little, but the sampling period is extremely short, compared to our planet's age. This can or cannot be caused by humans. But hey, anyway humans won't survive Earth, which is scheduled to disappear anyway in the next 5 billion years... Unless we disseminate elsewhere in our universe, we're doomed.
-
Re:A theory I'd love to see tested.
The Arctic ice is melting, the Antarctic ice is growing.
Antarctic ice is not growing, at least not this year. Of course when talking about ice in the polar regions you need to distinguish between sea ice and ice that is on land. It's true that for the past few years Antarctic sea ice has set new records but this year the Antarctic sea ice extent is 10% below normal. See here and click on the "Antarctic" tab.
We know from the GRACE satellites that the Antarctic land ice continues to melt.
So no, Antarctic ice in both forms is not growing this year.
-
Re:Paper states 6 degrees
No, as far as I understand the science the methane got there thanks to the glacial stage, i.e, it was already there when our interglacial began. Thus it's strange it would be released now and not during the Holocene Climatic Optimum.
-
The arctic has been losing ice for four days now.
As can be seen here: http://nsidc.org/arcticseaicenews/charctic-interactive-sea-ice-graph/ the arctic has been losing ice for four days ( Nov 17-20 ) now. For the month of November this is an unprecedented event over the entire period of satellite observations collected from 1979 to the present.
By the way, a neat experiment which you can perform with this chart is to "turn off" all of the years, then turn on the first five years and note where they fall relative to the median and the 2nd standard deviation; then switch from the first five to the last five and make the same observation.
-
Re:Doomsday Cult
This is what is happening to the arctic sea ice:
http://nsidc.org/arcticseaicen...
the line is noisy so predicting the next year is always a crapshoot, but the one thing that isn't going to happen is that the trend will change.
-
Re:Just to be clear...
you cant honestly be that stupid.
seriously.
you just cant. -
Greenland and Arctic data
If we use the Scientific Method (rather than anecdotes) we look at data. Here is the Danish Meteorological Institute's measurements (Greenland is administered by Denmark)
http://www.dmi.dk/en/groenland...
Of particular interest is this graph:
http://www.dmi.dk/uploads/tx_d... Here is the Arctic Ice Extent:
http://ocean.dmi.dk/arctic/ice...Here is the late-summer Arctic ice extent. Temperatures drop below freezing in a week from now and the Arctic ice will start accumulating again (this is from an American source):
http://nsidc.org/data/seaice_i...The coasts of Greenland are losing some ice, which may be why this base is being expose, but a much larger interior are in the interior is putting on a lot of ice/snow. The pattern of where ice is gained and lost seems to vary annually, depending on sea conditions and also changes in wind/storms.
Given that the Antarctic is putting on ice and the total ice cover of the globe is actually increasing (if you look at the measurements) then there isn't much of a reason to panic - especially as those that study solar activity have a prediction of Maunder-Minimum conditions by about 2030, where the global temperature will decrease drastically. So relax, enjoy the good weather (El Nino this year, which was wonderful) while it lasts, amigas y amigos.
Don't forget to always check the observed data, as computer climate models are not data according to the Scientific Method, they are considered "hypothesis" and observational data can falsify those hypothesis.
-
Re:Polar ice caps melting faster than expected
They were wrong about the ice caps melting,
The arctic ice cap is melting much faster than predicted: http://nsidc.org/arcticseaicen...
-
Re:Gullibility is the true global catastrophe75%......Your math is off by quite a bit.
-
Re:Things that weren't predicted didn't happen
http://nsidc.org/arcticseaicen...
Because of course, we expect 4.4 million Km^2 less ice this summer versus last summer. Hey, it could happen...
-
Re:Shifting masses
Here's some perspective on the difference between Greenland ice and Antarctic ice.
"The Antarctic Ice Sheet extends almost 14 million square kilometers (5.4 million square miles), roughly the area of the contiguous United States and Mexico combined....The Greenland Ice Sheet extends about 1.7 million square kilometers (656,000 square miles), covering most of the island of Greenland, three times the size of Texas.""If the Greenland Ice Sheet melted, scientists estimate that sea level would rise about 6 meters (20 feet). If the Antarctic Ice Sheet melted, sea level would rise by about 60 meters (200 feet)."
That's why even just the Antarctic sea ice matters as much as, if not more than, Greenland's ice.
-
Considerations...
Arctic vs Antarctic ice
https://nsidc.org/cryosphere/s...http://www.nasa.gov/content/go...
http://www.climatechangenews.c...
***
The truth is, there have been times when the Earth did not even have polar ice caps. But I have a hypothesis regarding this scenario.
The orbital plane of earth is slightly lower. Think about it. The Earth's orbit around the sun is not perfect - no celestial body is. Look at the moon sometimes it's higher in altitude and sometimes lower.
So what if the Earth is slightly lower in altitude of it's planar orbit around the sun? The northern hemisphere would be warmer, ice would melt. The southern hemisphere would experience the opposite, with the antarctic increasing in the accumulation of ice.
Yet I have seen very little research into this possibility that could pose a valid explanation for Earth's present climate changes.
***
None of this means we shouldn't clean up our act, stop pollution, and move to clean renewable energy. Far beyond CO2, look at the damage coal mining has done to the neighboring environments. Streams poisoned until no life is in them. I think we can ALL agree we need to clean up our act.
-
Re: Questioning isn't "denying"; it's science!
I think you're better off arguing about Arctic ice extent, how e.g. Fairbanks, AK has had a 50% increase in frost-free days over the last century, the rapid loss of glacial ice all over the globe (but again, especially in the Arctic). Villages thousands of years old are having to relocate, and the observed warming is double the global rate.
The glaciers melting is particularly visible, since the loss has been greatest in the tidewater and lower alpine glaciers, i.e. the most accessible ones. There was a guy going around to places where pictures had been taken in the early/mid 20th century and taking the exact same photo of the landscape. It's like an entirely different place. Winter temperature averages have risen 6 degrees F, and this winter was 10 degrees warmer.
tl;dr If you want visible evidence of climate change, look to the North.
-
Re:Only if you ignore the data that contradicts th
So show us some of that stalactite data too.
Wow, I don't have a clue how you could claim that AGW proponents and Michael Mann have said there is no natural warming for the last x amount of years. I've never read anything like that from him/them.
Yes, in the long run the quantity of most interest in the Arctic is the summer sea ice minimum but generally the Arctic sea ice hits its maximum extent in February/March. 2016 is threatening to set a new record for the lowest maximum extent on record. Here's the report.
-
Re:Does anyone have a list of the hottest years?
Oh... your feelings are hurt being called a climate science denier. All you're trying to do is co-opt the word denier so it only applies to Holocaust deniers. Actually in the long run I think climate science deniers may be found more wanting morally than Holocaust deniers because they're actively trying to thwart taking action against anthropogenic global warming rather than simply denying a historic fact.
The latest IPCC report gives an ECS range of 1.5 to 4 K. Lewis and Curry give a range of 1.04 to 4.05 K. Looks pretty similar to me. I've never seen anything from the IPCC that said 4 K is extremely likely. Perhaps you could cite the section of the report that says that.
As far as ice goes, Arctic sea ice minimum extent was the 4th lowest after 2012, 2007 and 2011. The 9 lowest years of Arctic sea ice extent minimums have all been since 2007. Link. Greenland continues to lose ice by all measurements including the GRACE satellites which measure changes in gravity. Antarctic sea ice did not set a new record this year although it was still higher than before the recent spate of record high years. The GRACE satellites continue to show net loss of ice from the Antarctic ice sheet although a recent paper shows gains in some areas.
To say that total ice cover is at record levels is absurd.
-
Re:And what if we were just colder 160 years ago
This is the critical point, because arctic ice is an order of magnitude greater than antarctic ice.
Did you get that backwards? Or were you maybe meaning that the effect of Arctic ice is greater (as it is floating ice)?
When talking about ice on the Earth it's always good to be specific about what kind of ice you're talking about.
The land based ice in the great ice sheets of Greenland and Antarctica is one thing. The GRACE satellites show both of those are losing ice mass although it's faster on Greenland.
Sea ice is a separate thing from the land based ice and there is a substantial difference between the Arctic sea ice and the Antarctic sea ice. In the Arctic the sea ice extent is constrained by the fact that the surrounding land prevents the sea ice from expanding as much as it could and only in some limited areas like the Bering Sea and the Fram Strait does it have enough room to freely expand southward. A good example of this is you get sea ice in the Baltic sea but of course all of the Scandinavian land between it and the Arctic Ocean is not covered by sea ice.
The Antarctic on the other hand is a continent surrounded by sea so there is virtually no constraint on the sea ice extent expanding as much as it can limited only by temperatures as it expands northward and then during the southern summer nearly all of the Antarctic sea ice melts out so it has to start all over again the next year.
So the usefulness of comparing maximum extents or minimum extents between the opposite polar regions is limited. What gets people all excited is the annual Arctic sea ice minimum in September and the annual Antarctic sea ice maximum (also usually in September). But the trend since 1979 is -500,000 km^2 in the Arctic and +100,000 km^2 in the Antarctic. Link
-
Re:ARCTIC vs ANTARCTIC
Those who believe Wikipedia is anything other than a steaming pile of shit where anyone can post anything thrive on the confusion caused by misinformation.
You could go directly to the source. but unfortunately for you, the source says "This year’s maximum was the sixteenth highest in the 35-year record."
So...
1. Antarctica gaining ice mass.
2. Antarctica ice extent has reached a new maximum
3. Arctic sea ice extent at a 35 year high. -
Re: Coral dies all the time
That's quite a rant there - assumptions, ad hominems, sweeping declarations, invective, ironic projection, the lot. In fact, pretty much everything except data.
Oh you want peer reviewed rebuttals? Done:
Science & Education, really? Remember what I said earlier about crap publications that would publish anything? Yeah. It's not exactly Nature, is it? Where is its peer-review policy anyway?
Shame the article is paywalled so we can't examine it, but these guys did. And if it's the article I think it is, applying Monckton's own peculiar standards for handwaving-away any papers that aren't explicit enough for him, only makes the numbers for rejection of AGW look even tinier, at a mere 9 out of 11,944 papers reviewed. And nowhere is there anything to back your claim that the consensus figures "included papers that argued against climate change".
And of course, Cook's paper isn't the only one that arrived at ~97% consensus - from Oreskes to Powell, they all give similar results. Plus, of course, the long list of scientific institutions that have confirmed the findings of AGW, and none dissenting.
[vague accusations & unsourced claims of bias & corruption omitted]
ice age predictions from the 1970s [...] New York was supposed to be under water by 2015
Ah, specifics. Cite the papers that predicted these, please. Or are you getting misled by bad reporting again?
Every year you get weaker and look more foolish
Every year, the surface temperatures rise, ocean temperatures keep going up, sea levels rise some more, global ice mass keeps decreasing - the ongoing trend is obvious everywhere to anyone who opens their eyes, and comes from climate scientists around the globe who couldn't care less about all that Republicans vs Democrats nonsense. The argument about what to do about global warming is certainly political - but the data aren't, and wild, unsourced claims of massive political bias in the field only make the accusers look like the foolish ones.
-
Re:the world was supposed to end years ago
No, they didn't. Here's a reputable source:
-
Re:Fight!
OP:
I recall NASA predicting complete loss of arctic sea ice by 2013, and the navy predicting the same in 2016.
You:
after reviewing his own new data, NASA climate scientist Jay Zwally said: "At this rate, the Arctic Ocean could be nearly ice-free at the end of summer by 2012, much faster than previous predictions."
US Department of Energy-backed research project led by a US Navy scientist predicts that the Arctic could lose its summer sea ice cover as early as 2016 - 84 years ahead of conventional model projections.
Are you unable to see the difference?
One NASA climate scientist said "the Arctic Ocean could be nearly ice-free at the end of summer by 2012", not "NASA predicted complete loss of arctic sea ice by 2013".
As it happened we hit the lowest sea ice extent since 1979 in September 2012.
A US Navy scientist predicted that "the Arctic could lose its summer sea ice cover as early as 2016", not "the Navy predicted complete loss of arctic sea ice by 2016".
As it happens we're currently only just inside 2 std deviations of the average, looking much like 2014 and 2013.
Anyway, to see what's happening go here http://nsidc.org/arcticseaicenews/charctic-interactive-sea-ice-graph/.
-
NSIDC Has More Data to Show
http://nsidc.org/data/seaice_index/index.html shows an overall growing Antarctic ice cap. (Make sure you click on the Antarctic tab.) Looking at illustrated and graphed data, one can identify some western areas where the ice cap has receded, albeit only ~15% of the western coast by a rough eyeball guess; however, the eastern side has not remained largely stagnant as the article of this post states. It has grown slightly, as it has also done in the south. Areas of the north have grown yet more significantly. Also, the running mean between 1980 and 2015 reveals a steady increase in overall extent.