 Slashdot Mirror
Domain: agu.org
Stories and comments across the archive that link to agu.org.
Comments · 331
-
Re:The Doomsday Scenario
... too many people keep saying that tidal and wave power will "run out" if we try to harness it.
Technically true, but not because extracting tidal energy will cause the Moon to move closer to the Earth. In fact, the Moon would recede from the Earth even faster, resulting in an imperceptibly small decrease in tide heights, because lunar tide heights are proportional to the inverse cube of the distance between the Moon and the Earth.
Thanks for reminding me that i had things wrong - but at the same time mind doing the math for the correct answer?
Extracting tidal energy would cause the Moon to move away faster, so one could ask "how much potential energy would the Moon gain by moving away from the Earth by 1 km?" Well, G = 6.67x10^(-11) m^3 kg^(-1) s^(-2) and m1 = mass of Earth = 6x10^24 kg and m2 = mass of Moon = 7.3x10^22 kg.
The (current) average distance from the Earth to the Moon is r = 384,399 km. So the potential energy of the Moon in its current spot is -7.60007x10^28 J. (Gravitational potential energy is negative.) Moving the Moon 1 km away from the Earth raises its potential energy to -7.60005x10^28 J, an increase of 2x10^23 J.
But, as I pointed out, the Moon's gravitational potential energy isn't the source of tidal energy. The rotational kinetic energy of the Earth is. The Moon's ascent from Earth would be a byproduct of extracting tidal energy, not the source of that energy.
The lunar ocean tide M2 currently dissipates ~2.4 TW of power. The Moon is receding at a rate of ~3.8 cm per year which is slowing the Earth's rotation by ~2 ms per century.
Knowing that the rotational kinetic energy of the Earth is the source of tidal energy, we can approximate the Earth as a solid uniform sphere which has a moment of inertia of I = 2/5 m1 a^2, where a = mean radius of Earth = 6371 km. So the Earth's moment of inertia is 9.74x10^37 kg m^2. Since KE = 1/2 I omega^2, and omega = 2*pi/sidereal_period (currently 23 hours, 56 minutes, 4.091 seconds), the Earth's rotational kinetic energy is currently 2.59001833x10^29 J. In 100 years, the Earth's sidereal period will be ~2 ms longer, at which point the Earth's rotational kinetic energy will be 2.59001821x10^29 J, a decrease of 1.2x10^22 J.
The lost rotational kinetic energy is converted into frictional heat on the ocean floor and continental boundaries, and some of it goes into raising the Moon's orbit. Thus we can perform a sanity check by verifying that the energy gained by the Moon is smaller than the lost kinetic energy of the Earth. If 1 km of lunar recession is worth 2x10^23 J, then using a linear approximation 3.8 cm of recession each year is worth 7.6x10^18 J of additional potential energy each year, or 0.24 TW. Each year, the Earth's rotational kinetic energy drops by 1/100 the amount it does each century, which means 1.2x10^20 J are lost each year, or 3.8 TW. (Note that this is close to the 3.7 TW reported by Munk and Wunsch.)
So the Earth's rotational kinetic energy is the source of tidal energy. It's decreasing faster than lunar potential energy is increasing, which is physically plausible. Roughly 6% of the lost rotational kinetic energy goes into raising the Moon's orbit. The rest is converted to heat by friction and turbulence.
-
Re:JESUS FUCKING CHRIST
"Earth's climate swings hotter-colder-hotter-colder."
Yes. Yes it does. It does so seasonally. It does so on El Nino / La Nina decadal scale. It does so on ~100k glacial/interglacial scale. It does so on ~250Ma "Icehouse/Greenhouse" scale. The question is, what cyclic process accounts for the average temperature increase of the last century or two? That's not clear at all. Furthermore, we can see secular, long-term changes that are pretty unique over geological time, such as the dramatic changes in the isotopic composition of the CO2 in the atmosphere that are caused by introducing so much "old" carbon into the atmosphere by burning fossil fuels.
And, no, humans do not put out less CO2 than one volcano. There are various estimates of human CO2 output, but it is more than 30 000 Mt/year and increasing. Total output from volcanoes is tougher to estimate, but is about 300 Mt/year on land [PDF]. Estimates for total output inclusive of underwater volcanism vary widely because of the uncertainties, but those totals are all less than 500 Mt/year [PDF], and some are less than 200Mt/year. Any way you slice it, this is far less than human input, let alone the comparatively minuscule amount from a *single* typical volcanic eruption. Even if you take some of the biggest eruptions in deep geological history, far in excess of eruptions that have occurred in historical times, humans still rank highly or on par with them. These sorts of "supereruptions" are rare things -- once in 100000 to million-year events. Think "Yellowstone Caldera" scale, which erupted about 2 million years ago. In effect, it's as if we're pumping CO2 into the atmosphere on the scale of some of these "biggest eruptions in Earth history" every single year, but without the mitigating effect of as much airborne ash or sulphate particles. An insightful calculation in the second article above is to use the well-studied, second-largest eruption of the last century as a measure -- the eruption of Mount Pinatubo in 1991 in the Philippines. It produced ~50 Mt of CO2 output. The equivalent of human CO2 output would be more than 600 Pinatubos a year (conservatively -- the article uses more realistic numbers and gets 700 Pinatubos/year).
You're promoting a "volcanoes produce more CO2 than humans" myth that has been shown to be wrong many times. It's not even in the ballpark. It's several orders of magnitude wrong. This does not inspire confidence.
I did manage to find one situation where your statement might be considered correct -- for a period of a few hours in a major volcanic eruption the output may be on par or greater than human CO2 output. It's explained in more detail in the second article above. But that's only briefly during the peak eruption. It's not sustained day-in, day-out, every hour over years like human outputs are. It would be pretty misleading to refer to that momentary comparison as if it was relevant in any general sense. Averaged over a year, those momentary volcanic spikes in CO2 output are pretty irrelevant.
-
Re:Of course Discover magazine would say this
The last paper I read on the subject couldn't disprove it. This was done in the lab because doing real experiments in the real atmosphere with real cosmic rays is very hard. The best they can do is measure cloud formation in relation to solar wind levels. It will take a full normal solar cycle to do this.
-
Re:Oh good...
And they're going to be sorely disappointed when the warming continues despite reduced solar output.
Even if the Sun went into a new Maunder Minimum Global Warming will continue because the forcing from increased GHG's (primarily CO2) overwhelms the change in insolation. There is a peer reviewed paper on the subject here: On the Effect of a New Grand Minimum of Solar Activity on the Future Climate on Earth (Feulner & Rahmstorf 2010).
So what will the "naysayers" response be to continued warming despite reduced insolation?
Except for the fact we've been cooling for the last 13 years, even as carbon emissions continued to grow. Perhaps the models are wrong? Maybe there's something else controlling the majority of our climate change? Because they certainly don't seem to predict or model what's happening now - temperatures falling while carbon emissions increasing.
-
Re:Oh good...
And they're going to be sorely disappointed when the warming continues despite reduced solar output.
Even if the Sun went into a new Maunder Minimum Global Warming will continue because the forcing from increased GHG's (primarily CO2) overwhelms the change in insolation. There is a peer reviewed paper on the subject here: On the Effect of a New Grand Minimum of Solar Activity on the Future Climate on Earth (Feulner & Rahmstorf 2010).
So what will the "naysayers" response be to continued warming despite reduced insolation?
-
Re:He's wrong about one thing
Carbon dioxide does not cause catastrophic runaway global warming. It may cause approx. a degree or so of warming. Any more would require positive feedback and there is no evidence that is happening. We've measured the radiation in at all wavelengths and we've measured the radiation out at all wavelengths. The evidence for positive feedback is just not there.
This is false.
http://www.science20.com/news_account/greenhouse_gases_and_water_vapor_when_positive_feedback_is_a_bad_thing
http://www.agu.org/pubs/crossref/2010/2010JD014192.shtml
http://www.springerlink.com/content/m2054qq6126802g8/
http://www.agu.org/pubs/crossref/2008/2008GL035333.shtml
http://ams.allenpress.com/perlserv/?request=get-abstract&doi=10.1175%2F2007JCLI2142.1
http://www.agu.org/pubs/crossref/2006/2005GL025505.shtml
http://www.agu.org/pubs/crossref/2005.../2005GL023624.shtml
http://www.springerlink.com/content/v164l177374p1445/Let's just look at one abstract.
http://www.sciencemag.org/cgi/content/abstract/310/5749/841
Climate models predict that the concentration of water vapor in the upper troposphere could double by the end of the century as a result of increases in greenhouse gases. Such moistening plays a key role in amplifying the rate at which the climate warms in response to anthropogenic activities, but has been difficult to detect because of deficiencies in conventional observing systems. We use satellite measurements to highlight a distinct radiative signature of upper tropospheric moistening over the period 1982 to 2004. The observed moistening is accurately captured by climate model simulations and lends further credence to model projections of future global warming.
-
Re:Climate Change Deniers
I'll suggest this experiment
What are you trying to prove? That water has a higher specific heat than air? Of course it does. That's the reason it takes the oceans 30+ years to warm up enough so the air temperature matches the forcing and feedbacks it is experiencing. Don't forget the second law of thermodynamics. Heat always transfers from the warmer body to the colder one. The average air temperature in the room won't reach 120F until the water in the pool does too (which takes a lot longer than 1 hour) because the water will be absorbing heat from the air. I suppose you could jamb the 120F air in fast enough that the average temperature is 119.999...F but until the two equalize it won't be 120F. The air temperature will depend on how fast you feed that 120F air in and how fast the water can absorb the heat. There's a dynamic balance between the two. That the buffering that keeps the air temperature below the input air temperature until the buffer is depleted.
It's not only rich people that are incented by money
A scientist is more incented by doing good science because once it is shown that they are not doing so their sources of funding will dry up. I guess you think there is some huge conspiracy by all of the different organizations making those funding decisions to push global warming. I have my conspiracy theories too but not about this.
HARRY_README.TXT
I have read it. I've also done a fair amount of coding in my life and used comments like that myself. I've used known data and extreme data to test my code. Unless you can prove that the code and data in question was used to produce the reported results you have nothing.
If I say the temperature may increase 1C over the next hundred years, +/- 10C, certainly my conclusion will not be falsified by any stretch of the imagination, but is it a *useful* conclusion?
Why don't you use real numbers? The uncertainty on model output for the 95% range of confidence is on the order of +/- 0.5C for temperature changes of 1-4C by 2100. If you're going to talk about uncertainty you need to use real numbers, not some imagined value.
... 30,000 volcanoes erupting in the past 50 years is going to have an impact on the heat content of the ocean.
Why do you presume that there are orders of magnitude more volcanic activity in the ocean than on the land? The total number of eruptions on land during that time period is probably in the hundreds, not thousands, depending on how you define eruptions. Volcanoes simply can not put out enough heat to significantly affect surface temperatures globally. I've never heard a serious skeptic even try to use that argument before.
Predicts both cycle 24 and 25.
Thanks for the link. I wasn't aware of that research. But the forcing of CO2 and other GHG's is high enough that even if the Sun went into another Maunder Minimum the climate would continue to warm. On the Effect of a New Grand Minimum of Solar Activity on the Future Climate on Earth (Feulner & Rahmstorf 2010).
I'd agree that in a laboratory, CO2 may be easier to study, but in real world effect, it is incredibly difficult to tease out its effect among all the other variables.
Difficult is not the same thing as impossible. It's something that has been studied for over 100 years and especially since the 1950's. I think we know a thing or two about it. We can measure the radiative energy coming off the Earth's surface across a range of frequencies. We can measure how that changes as you get higher in the atmosphere. We can measure the composition of the atmosphere so we know what absorption characteristics we should expect. Sure it's c
-
Re:NASA Gets Busted All The Time
Do you have any reputable citations showing professional climatologists engaging in groupthink or responding badly to reasoned criticism? I ask because, once again, your description of the climatology community sounds like a description of a cult... [Dumb Scientist]
You mean like how they circled the wagons around Phil Jones, even when actual bad behavior on his part was discovered? For example: [ShakaUVM]
“This has some similarity to the CRU email theft, where precious little was discovered from among thousands of emails, but a few sentences were plucked out of context, deliberately misinterpreted (like “hide the decline”) and then hyped into “Climategate”.” [RealClimate]
Presumably you meant to say that scientists in general are circling wagons and responding badly to reasoned criticism.
Or you can just read the editor’s comments left in the response sections of RC.org. Just skimming through that above article, here’s an interplay between Pielke and Stefan. [ShakaUVM]
Coincidentally, Pielke Jr. had similar things to say about that interplay. That's the interplay where he asked a bunch of 'questions' like "Was it appropriate for the IPCC to make stuff up about my views?". Then Stefan replied:
Clearly there are different views on this, which is why we called this graph "debatable". But let's keep things in perspective: we're discussing Supplementary Material and a response to one of those 90,000 review comments now, not even the report itself. You've been working hard to scandalize your personal quibbles with IPCC here - how consistent is this with your self-proclaimed role as "honest broker"? Stefan
That link leads to an in-depth comment, and neither seem to constitute "responding badly to reasoned criticism." In fact, it's not clear that Pielke's rant counts as "reasoned criticism" in the first place. As far as I can tell, he's got
-
Re:The meaning of exponential
Actually, if you read the paper, you'll see that they are taking the proper approach. Another decade may indicate what the timescale is based on current melting. But they also examine past behavior finding cases of meter/decade sea level rise in the past.
Others have been looking into the details physics of a rapid ice sheet response. http://www.agu.org/pubs/crossref/2010/2010GL044397.shtml -
Re:NASA Gets Busted All The Time
Second, you mentioned the “0.3C per decade” prediction from emission Scenario A, but you’ve repeatedly ignored Scenario B which Hansen himself called “more plausible” in 1988. [Dumb Scientist]
That’s great, but I’m not talking about Hansen88, but AR1, which focuses on Scenario A. It’s possible this was done to scare politicians into action, but when one reads it, the +0.3C increase appears to be the best guess. [ShakaUVM]
No, what you and Michaels are doing isn't "great" in any sense of the word. Again, by "summarizing" the IPCC AR1 WG1 report as though it only gave one scenario, you pulled a "Pat Michaels".
As I've explained ad nauseum, the dynamical nature of climate models means that evaluating a GCM ensemble requires comparing projected forcings to the actual forcings. In other words, each scenario is an "if-then" statement: "If greenhouse gas concentrations rise at rate X, then temperatures will rise at rate Y." You and Michaels not only chopped off the first part of that sentence, you both presented it as the only scenario... which "coincidentally" makes it seem like scientists are discrediting themselves by making bad predictions.
The correct approach is to open the AR1 to the Annex on page 333, and examine the rates of CO2 rise given in the top-left of figure A.3. Scenario "A" (BaU in that plot) only applies if CO2 levels exceed 400ppm by 2010, which hasn't happened. The top right graph also shows that methane rises to over 2000ppm in that scenario by 2010, and once again that hasn't happened either.
Just like in Hansen88, AR1's scenario B is the closest match to the actual forcings. That's not really surprising, considering that Hansen was a contributing author for sections 6 and 8, table 2.2 on p52 repeatedly references Hansen88's radiative forcings and corrects a typo on p9360 of Hansen88, and chapter 3 repeatedly references Hansen88. Unsurprisingly, the emissions scenarios used in both studies seem very similar.
I thought you'd be able to learn something from the eerie parallels between your mistake and Michaels's, but apparently I was wrong. Again.
Unlike many other scientists, I don't think Michaels is lying because his "rebuttal" seems to indicate that he's trying to draw conclusions based entirely on each scenario's legend, and that he doesn't understand the difference between dynamical and empirical models. If he thinks that climate models are empirical, it makes sense that he wouldn't understand the reason for making three different projections. In that case
-
Re:Solar activity-volcanism association?
There's some research on correlation between solar minima and increased volcanic and tectonic activity.
Here's one paper: http://www.agu.org/journals/ABS/1989/JB094iB12p17371.shtml
-
Re:Relax
Again, the NASA study you link to makes no comment on the UHI effect in relation to temperature trends. It doesn't say anything about the effect being larger than anyone who had thought before. It just examines the variables that go into the effect and how different factors affect it.
The Menne paper compares well sited stations (presumably not affected by UHI effects) to poorly sited stations and finds a slightly higher warming signal in the well sited stations than in the poorly sited stations. So tell me again how UHI effects are distorting global temperatures upward?
I did look at the Tisdale link. It shows correlation but is pretty weak on causation. When he publishes it in a peer reviewed journal I'll take it more seriously. McLean (2009) who did get a similar argument published in the AGU journal has been pretty thoroughly debunked.
Predictions vs. projections may be a semantic argument. The fact is that climate models produce results that are far better than random guessing so they have value.
Realclimate is run by a number of the most prominent people in in the field. If you want to know what they are saying about the science it's the place to go. If you don't care what they say you can just dismiss it as an agenda driven site. What is your evidence that they are agenda driven? Is it that you don't like the science they publish? They censor unscientific BS.
What does weighting have to do with anything? The big climate models, the General Circulation Models (aka Global Climate Model or GCM) are based on the physical world. They are not an exercise in curve fitting. They use the actual physical relationships discerned by observation and analysis to model the climate. When changes are made to the models there is a basis in physical reality and new understanding for the changes.
-
Re:Relax
The urban heat island effect is well compensated for. A recent study that used Anthony Watts surfacestations.org list of well and poorly sited weather stations found that poorly sited stations actually show slightly less warming compared to the well sited stations. (Menne 2010)
Other studies showing the urban heat island effect is not a significant factor affecting temperature trends:
Peterson 2003
Parker 2006
Jones et al 2008The NASA page you cited discussed the causes and effects of the UHI effect but says nothing about its effect on global temperature trends.
I'm trying to figure out what you mean by a "warm oceanic cycle". While changes in currents and atmospheric effects can change the distribution of heat in the oceans which will effect adjacent land temperatures it doesn't change the total heat energy stored in the oceans. Over 99% of the heat energy in the Earth system, including the oceans comes from greenhouse warming. Without the buffering effect of the oceans absorbing over 90% of the enhanced greenhouse warming we would already have surface temperatures much higher than they are now.
I probably shouldn't be making any 20 year bets since I'm old enough that it's at best 50-50 whether I'll still be among the living in 2030.
Regarding climate models, they don't make any predictions. In order to make a realistic prediction they would have to know the inputs of things subject to natural variability ahead of time. Inputs such as insolation, CO2 levels and the timing of events like ENSO among other things. Instead they make projections based on various input scenarios. They are tested and validated by hindcasting using the actual observations of those inputs.
In 1988 James Hansen made projections based on three scenarios (A, B & C). Scenario B came out closest to reality and the projections based on it are reasonably close to the reality we observe today. Here is a discussion of that.
As far as falsification of greenhouse gas (mostly CO2) driven climate change one of the most straightforward predictions made by the theory is that the stratosphere will cool some because of it. This has been observed. If it hadn't it would call into question the theory. If the warming were being driven by increased insolation the stratosphere would be expected to warm.
-
Re:Passionate scepticism
Still not seeing any citations, but perhaps you should be reviewing your own examples. The hockey stick has been confirmed by multiple independent lines of evidence:
McIntyre 2004 claimed that the Mann 1999's hockey-stick graph shape was a result of the analysis method used (principal components analysis), and was not statistically significant. However, the National Center for Atmospheric Research reconstructed (Wahl 2007) the graph using a variety of techniques (with and without principal components analysis), and with some slightly different temperatures in the 15th century, confirmed the hockey stick. Furthermore, independent measurements from boreholes (Huang 2000"), stalagmites (Smith 2006) and glaciers (Oerlemans 2005) all confirm the same dramatic recent temperature rises. Mann 2008 combines these with ice cores, coral and lake sediments to confirm the same hockey stick shape over the last 1300 years, without requiring the disputed tree-ring data.
If you're referring to Steig 2009, perhaps you can point us to evidence that discredits this? You'll have to forgive us for not taking your claims that it is "unmitigated bollocks" at face value. Rather, measurements from the GRACE satellite (Velicogna 2009) show very clearly that the Antarctic land ice sheet has lost around 900 gigatonnes in the last 7 years, and this loss rate is accelerating, even in the previously-thought-stable East Antarctica (Chen 2009). The Antarctic sea ice sheet is actually increasing, however, for numerous possible reasons, but at a lower rate than the land ice loss.
-
Re:The reporting bugs me
it still remains that no mechanism for the claimed climate changes has been described. It's just, "These guys ran their computer model and this is what they got." That's extremely unhelpful.
If you have access to AGU journals, you should read the original article. It's quite detailed about the mechanisms involved.
Even without the original article, the mechanism here really isn't rocket science. Black stuff in the atmosphere makes the planet absorb more sunlight and therefore heat up. Really simple. To go beyond mechanism to get a numerical estimate of climate change, you unavoidably need a model. And take it from me, the one they're using is a good one.
You're using a lot of breath to cast doubt on the results here, with far less justification for your conclusions than the Nature and Wired authors you're attacking.
-
Found the actual article...
Careful now: FUD as we typically use it on Slashdot is doubt raised by pure rhetoric, in the absence of facts. These guys have actual *data*. You can question their assumptions, but they're not just using scary words.
The obvious question that comes to my mind is why do think that any significant amount of soot from the 1000 rockets launched this year would still be in the atmosphere in 40 years? Do they have any reason to suspect that it stays around that long?
I've found the original Geophysical Research Letter article (it's behind a paywall unless you're at an institution that subscribes to GRL, which I am).
They do *not* assume that the soot sticks around for 40 years: they include a settling time for the soot particles of a couple of years (details more complicated). But they run the model for 40 years to give the ocean and cryosphere time to adjust.
They use a detailed model of the interaction of sunlight with soot particles: this model was developed for studying nuclear holocaust scenarios. They make some assumptions here about the size and properties of rocket soot particles, but I don't see any red flags.
Finally, again comparing to volcano's, the best data I can find for a volcanic eruption that changed the climate (1991 Pinatubo) suggests that it dumped 17 million tons of CO2. I know this is talking about rubber particulates and not CO2, but there's a big difference in magnitude between 17 million tons in a few days and 1.3 million tons over 40 years.
Soot particles have a *very* different climate effect than CO2, it's apples and oranges.
Based on what I read in their article and on my personal experience as a climate modeling scientist, I can tell you that they're using the right computer model for the job, and their assumptions about soot input seem reasonable, and they're including all the relevant physics.
It should also be mentioned that the climate change effects they're predicting (1 polar temperature rise, 5-15% northern polar sea ice loss) are observable, but *much* smaller than the predicted changes from anthropogenic greenhouse gas emissions (up to 8C polar temperature rise, possible total loss of summer sea ice). But still, no joke.
-
Re:Who is questioning it exactly?
"It is also true that 500 mil years ago, Earth was a ball of ice despite the fact that atmospheric CO2 was ~4200ppm (about 12 times higher than today). Oh yeah, you guys always forget to include that 'law of physics.'"
I am certainly not an expert in the subject, but my basic understanding of snowball earth is that first the continents got into a position that led to a runaway glaciation. More ice on the ground/water equals more light reflected equals more ice forming. Once the entire earth was covered in ice there was no photosynthesis going on, so carbon dioxide started to build up, mostly from volcanic activity. In fact according to the citations on wikipedia it didn't build just up to 12 times higher than today, but might have been more than 300 times higher before there was enough greenhouse heating to overcome the cooling effects of reflection from all the ice.
You seem to be implying that high levels of CO2 at the same time the earth was frozen over somehow contradicts global warming when in fact it supports the idea. Were you not aware of that? Or were you just hoping that we weren't? (And in any case, how is a fact or set of conditions a "law of physics"?) -
Re:How consistently has he "sounded alarms"?
What happens if you remove El Nino 1998 from that graph?
This.
According to Phil Jones, there's been no statistically significant warming since 1995. That's 15 years. Around 1/2 of your usual "significant" timescale. It's not looking good for the hypothesis, is it?
You, like many, are confused about what "statistically significant" means.
Over a 10-15 year time scale, it's common for no climatological trend to achieve statistical significance. That doesn't mean there is no trend. It's because it usually takes about 20-30 years of data to detect a trend with 95% confidence in a noisy, autocorrelated data set.
That's why it took about 30 years for scientists to become sure there was a modern warming trend in the first place, and why 30 years is the commonly accepted standard for calculating "climatological trends".
See here for an expository article intended to address this misconception. It takes the perspective of showing how short term "trends" commonly contradict the actual long term trend, which is another way of saying that short term trends often don't achieve statistical significance.
-
More alarmist bollocks.
There is no evidence the phenomenon – which brings a constant flow of warm water and mild weather to northern Europe – has slowed down over the past 20 years, climate scientists say.
‘The changes we’re seeing in overturning strength are probably part of a natural cycle,’ said researcher Josh Willis, from Nasa. -
Re:Subjective perspective exaggerated
... the study takes into account a rebounding of the Earth's crust called glacial isostatic adjustment, a continuing rise of the crust after being smashed under the weight of the Ice Age. [Slashdot summary]
Here the summary implies that previously published GRACE ice mass balance estimates didn't take GIA into account. At first I assumed this ridiculous implication must have been a mistake on Slashdot's part. Then I read the article:
... according to the new study, published in the September issue of the journal Nature Geoscience, the ice estimates fail to correct for a phenomenon known as glacial isostatic adjustment.
No, previous research didn't ignore (see section 2.2.4) GIA/PGR. These news stories are reporting on a paper by Xiaoping Wu et al. (free PDF). In table 2, Dr. Wu shows that his estimates are half as big as those in papers published separately by Velicogna, Chen et al. and Luthcke et al.
Luthcke et al. corrects for GIA using the ICE-5G model which combines many proxies and other empirical evidence regarding ice history since the Last Glacial Maximum, mantle viscosity and the Earth's various Love numbers. Chen et al. used the similar IJ05 model. Velicogna used multiple independent models to estimate uncertainty in the GIA signal. After reading Dr. Wu's paper, it's clear he never claimed that previous research had ignored or failed to correct for GIA.
That would have been a real surprise, because he wouldn't make a claim that can be disproven simply by skimming the papers he referenced. Nor is he rude enough (or at all, for that matter) to imply that the rest of the GRACE community ignored this important issue. Coincidentally, Dr. Wu worked for my advisor as a postdoc in the 1990s, in the same office that I'm currently using. I met him several months ago at the WP-AGU conference in Taiwan, and as far as I can tell he's overwhelmed by the bizarre attention his paper has gotten from the general public:
RUSH: There's a global warming story out. Guess what? Greenland and some of the ice floes, they're only going to melt half as much as originally forecast. So the polar bears are still going to have a place to live. I don't think they're going to melt, period. All of this is a sham.
"Estimates of the rate of ice loss from Greenland and West Antarctica, one of the most worrying questions in the global warming [hoax], should be halved, according to Dutch and US scie
-
Land biomass is a lousy carbon sink
A simple comparison of the size of the biological carbon reservoir on land (2000 gigatons C) and the rate at which it exchanges carbon with the atmosphere (120 gigatons/year) suggests that growing trees is a terrible way to store carbon in the long term: extra stored carbon will return to the atmosphere in a couple of decades.
This is confirmed by a variety of real-world experiments in forest artificially enriched with CO2 and in naturally growing forests.
You may call a dead tree "sequestered carbon", but there's a whole ecosystem full of organisms that call it "lunch". If you want to get rid of carbon, you need to either store it in a place where organisms can't get to it (for example, in the deep seafloor) or in a form that's not tasty (for example, as CO2 or carbonate rock.).
-
Re:how is this measured?
"You don't have to be really patient... plates move at 2-10 cm/year so you'd start getting GPS data within 2-5 years"
It's faster than that. A few days/weeks of monitoring with the right equipment is sufficient at a given station (these are *not* handheld GPS units!), allowing the motion of entire regions to be studied from many points in a year or two of fieldwork moving the stations around. And many regions now have permanently mounted GPS networks to monitor continuously. A couple of years of continuous data is sufficient to get great detail and precision. That allows geologists to study not only the motion of entire plates, but the details of deformation of mountain ranges at the plate boundaries and the effects of individual earthquakes -- essentially real-time monitoring of the motion of the Earth's surface at millimetre precision. Here are a few papers [PDF].
If you want to know how fast you are moving at your own location with respect to a given reference frame try this, which is derived from current whole-Earth models of plate motion. Please note that it probably won't be accurate in areas with complex deformation near plate boundaries (it models the plates as rigid), but if you're within the plate somewhere it will be a reasonable approximation.
One of the coolest analogies of scale ever: the plates move at about the same rate that your fingernails grow.
-
Re:This is why I hate most science reportingThe paper is actually a lot clearer than the press surrounding it. http://www.agu.org/pubs/crossref/2010/2010GL044143.shtml FTFAbstract:
Plasma flowing poleward at the solar surface and returning equatorward near the base of the convection zone, called the meridional circulation, constitutes the Sun's conveyor-belt. Just as the Earth's great oceanic conveyor-belt carries thermal signatures that determine El Nino events, the Sun's conveyor-belt determines timing, amplitude and shape of a solar cycle in flux-transport type dynamos. In cycle 23, the Sun's surface poleward meridional flow extended all the way to the pole, while in cycle 22 it switched to equatorward near 60. Simulations from a flux-transport dynamo model including these observed differences in meridional circulation show that the transport of dynamo-generated magnetic flux via the longer conveyor-belt, with slower return-flow in cycle 23 compared to that in cycle 22, may have caused the longer duration of cycle 23.
-
Re:Clearly a sign of AGW
-
Re:Clearly a sign of AGW
-
Re:Man-made global warming
As shown by this guy [wordpress.com], weather stations are positioned next to asphalt parking lots and air conditioner units which produce an unnaturally high reading. So until these monitors are placed elsewhere we will be getting reading that can be several degrees higher than the actual temperature [wattsupwiththat.com], which will skew the results upwards.
Except
1) a detector next to a parking lot won't give you temperature increase over time unless the parking lot is getting hotter.
2) correcting for this effect doesn't make the warming go away.
3) satellite, weather balloon, and ocean measurements also show warming, despite the absence of parking lots.
4) restricting analysis to well-sited measuring stations doesn't make the warming go away -
Re:Sadly...
2. Arctic and antarctic to warm faster than rest of the planet - predicted by all models. Observed.
I haven't been keeping up with the latest news in climatology, but the last I heard Antartica was getting colder, and the sea ice was expanding. This is directly contrary to the prediction that it should be warming at a faster rate than the rest of the world. But AGW is a hydra, so the loss of that head did nothing to it. I assume there's some rationalization for why the prediction is wrong (or even better, that prediction went down the memory hole; AGW has always predicted Antarctica would cool initially).
I was originally a supporter of AGW, became a "skeptic" when I saw data that didn't fit that theory, and became apathetic when I realized that AGW will not be falsified (hence why I'm not going to bother verifying the other claims). There's probably something to it, but it's not a scientific theory so far as I'm concerned, which makes me not really care about it. Runaway CO2 production can't be maintained indefinitely without having effects, so if it gets cut, great. If the economy tanks in the process my student loans will likely become easier to pay back when I start to care about them in a few years. -
Re:Did this affect climate
Ok, pass the popcorn, let's watch the climate zealots (of either side) have a field day with this...
Do you think climate is OT? Plate tectonics are far more important for creating ice ages than atmospheric CO2 concentrations.
Q. What do all ice ages have in common? A large polar land mass and a continent that stretches almost entirely from the north to south poles. In our current ice age, that is antarctica and the americas. It is no coincidence that the present ice age started around 3 million years ago; Right around the same time the isthmus of Panama rose up out of the ocean.
Around 500 million years ago, there was an ice age in the late Ordovician period where atmospheric CO2 levels were around 4200ppm. Again, the two conditions mentioned above were met. Climate 'scientists' with an agenda typically omit this datapoint from their presentations purposely, because it doesn't fit with their theory that CO2 is the most important factor when dealing with Earth's climate.
In short: Want to cause global warming? Open the flood gates to the Panama canal and let nature do the rest. Otherwise, we have to wait for nature to bust open that isthmus for us. Either way, expect the climate cultists to give you a smug "I told you so!" if it ever happens in our lifetime. They won't ever admit it wasn't the CO2, but then, when did facts ever bother them anyway.
-
Re:I love the double standards
Like throwing out data that doesn't fit the models? Like deleting data that could be used to refute your outrageous claims (hockey stick)? Like shunning those publications that would publish critical peer review articles? Like including wild claims from biased sources without verifying the sources?
Every investigation into the CRU scientists' actions has given them a verdict of innocent of any actual scientific fraud. They were careless in their communication and were probably overly defensive about their work, and possibly even broke the law in fighting FOI requests, which I do not condone. But to claim that affects their data is absurd and the definition of an ad-hominem argument. In any case, even if you disregard CRU data, there are other sources. I'll admit there aren't enough large independent data sets but that's not a point either way.
Like when the CRU "scientists" tried to block peer review articles from being published? Like when "skeptics" are accused of working for "big oil"? Like when alarmists refute skeptics' claims by saying "their science is nonexistent and their major tactics are ad hominem attacks and fearmongering."?
Some skeptics accuse global warming scientists of being in it for the gravy train, some global warming activists accuse skeptics of being paid by big oil. More ad hominem attacks, some people say stupid things. News at 11.
I thought you cared about data? As for me "refuting your claims", I don't see a single "claim" in your post besides that SCIENTISTS ARE BAD PEOPLE. (Disclaimer: I have connections to big oil)
Like when alarmists claim that NY and Florida will be underwater? Like the claims that the Himalayan mountains will be ice free? Like the claims of an ice free N. Pole? Like the claims of more and deadlier hurricanes?
While the IPCC AR4 mistake is bad, it's not as if the glaciers melting was the major headline of the entire, multiple-thousand-page report. It was a minor point, completely wrong, but it wasn't used as a data point anywhere and to claim it invalidates every other piece of data in the IPCC report is plainly ridiculous, and again, the definition of ad hominem.
The reason the IPCC attempted to predict the things you mention is because they were asked to. They can't be held responsible for the media just picking up on the first sentence of each paragraph and ignoring the detailed statistical analysis that follows. That's just journalism these days.
So yes, I am entirely justified in saying science is nonexistent and their major tactics are ad-hominem attacks and fearmongering, and your reply was just an example of that, without a single reference to any data.
For what it's worth I support actual science, not science as it is portrayed in the mainstream media, and global warming "activists" are just as despised by me as "deniers". I have no hope of getting through to the parent, but to any interested readers, Richard B. Alley gave a very cogent talk at the American Geophysical Union, about the strength of the evidence that CO2 has a significant effect on the climate based solely on geological record data. It's long, but based on solid data and presents a very convincing and honest argument about what is known and what isn't. http://www.agu.org/meetings/fm09/lectures/lecture_videos/A23A.shtml
-
Re:Premature
But the temperature trends, which should reasonably have been connected to that ozone recovery, were not predicted at all, and not found until last year. Why?
If you're implying that scientists detected the possible increase in stratospheric ozone without realizing it would have a warming effect on the stratosphere, that's not true. The problem is that ozone and CO2 and volcanoes aren't the only forcings strongly affecting stratospheric temperatures, so the connection isn't that clear.
Again, the stratosphere has an extremely low heat capacity compared to the lower atmosphere (let alone the ocean). Because of this, small amounts of energy can send its temperature through the roof. Plus, it's more exposed to the solar wind than the lower atmosphere. So it's buffeted by many different forcings. Yet again, I'm saying that stratospheric trends aren't as well understood as surface trends, and their temperature trends aren't useful indicators of an energy imbalance (unlike surface temperature trends).
-
Re:Premature
Found the talk; it was given by Lenny Smith and even worse/funnier than I recalled:
"Is it conceivable that models run on 2007 computer hardware could provide robust and credible probabilistic information for decision support and user guidance at the ZIP code level for sub-daily meteorological events in 2060? In 2090? Retrospectively, how informative would output from today's models have proven in 2003? or the 1930's? Consultancies in the United Kingdom, including the Met Office, are offering services to 'future-proof' their customers from climate change. How is a US or European based user or policy maker to determine the extent to which exciting new Bayesian methods are relevant here? or when a commercial supplier is vastly overselling the insights of today's climate science?
Oh, and I'm going to once again reproduce my own comments on Dumb Scientist. Notice that this is just like when I notified you in advance long before I posted any of our conversation, and even before most of our very first conversation. (You even replied and didn't object.) Then you complained, saying something to the effect that since I didn't copy all of your posts as well, I shouldn't even be allowed to copy my own comments because they internally quote yours.
But I really want to share that anecdote and other info. So I'll post my comments on Dumb Scientist (as I've always done) right after the end of our last conversation, but this time I'll cite the internal blockquotes as coming from "Someone". Of course, the links will lead here (but no one follows those, right?) so no one will know it's you. Then I'll replace your exact words in the blockquotes in my comments with paraphrased versions that-- no matter how I write them-- will likely provoke you into a blind rage. But either way, I won't label these comments with your pseudonym, and all of your words will be replaced with the shortest, most neutral paraphrasings I can think of. Unless you claim the right to my words, or to the abstract concepts we've discussed, I don't see how you would have reasonable grounds to object to this.
I guess I'll have to come up with some kind of tortuous way around using the words "completely unknown" and "significant" and "destroyed" in my comments, though.
Oh, I also need to reword some of my phrases that imply continuity between "Someone" and "Jane Q. Public".
Hmmm...
This will take quite a bit of time, but I don't want to be accused of being unethical, or have people question my goodwill, integrity, or ability to deal in polite society. It seems a little odd that I'm not allowed to copy the comments I type into Slashdot's comment box straight into the comment box on my own website, but you probably have a truer moral compass than I do, so I'll defer to your wisdom and divert this time and effort away from my dissertation.
-
Re:Premature
Oh, I forgot an anecdote in that list of mine. I was nursing a beer at a talk on the reliability of GCM predictions at the 2009 AGU Fall Meeting... I don't remember the title or speaker, but I think it was the middle of the week and I vividly remember the sweet, sweet taste of free lager, so it must have been right after "beer o'clock" which at the AGU is mid-afternoonish. Anyway, the guy was showing a website claiming to provide regional climate predictions for annual averages (not ~20 year averages!) of temperature, humidity, precipitation... out to 2030... for specific zip codes. By the end, the room was howling with laughter. The notion that current science is anywhere near this accurate is on par with the idea that the CIA is advanced enough to remotely control our brainwaves unless we're all foiled up.
-
Every slashdot reader should watch this video:
-
If you haven't already, watch this video.
Professor Richard Alley recently gave a presentation called "The Biggest Control Knob: Carbon Dioxide in Earth’s Climate History," in which he makes the case that climate models simply don't work right unless you incorporate CO2.
The key point he makes is that there is a record dating back over 400 million years that provides proof that climate is sensitive to CO2. Doubling CO2 adds 3 degrees C to global temperature.
There are multiple lines of evidence to support climate sensitivity, and additional research is filling in what gaps might have been missing, and further strengthening the argument.
-
Re:Premature
The U.S. National Academy of Sciences disagrees with you. The American Association for the Advancement of Science disagrees with you. The American Geophysical Union disagrees with you. The National Oceanic and Atmospheric Administration disagrees with you. There are many more, but the point is that the scientists actually studying it are generally convinced. Do you have any scientific organizations that agree with you that the greenhouse gas aspect of it is still up in the air?
At this point, I think that climate deniers are very close to creationists. In both cases, there are people and organizations that disagree with the science. They can talk a good talk, but fail in the actual doing of the science. They can ask more questions than can be answered currently, can take quotes (and emails) out of context, they can use the human failures of people involved in the science against them, and any screw ups (and they certainly exist in both cases) are taken as evidence that the entire science is incorrect. But, they are ignoring the basic science as a whole, discarding what we do understand, and blowing the uncertainties way out of proportion, in order to promote an unscientific point of view. -
Re:It's shitty science, Rei.
No, it's not. I'm not sure how much more clearly I can explain it. But a fast Google search on "ocean heating", which I cited as an example of incomplete understanding of the effects of the sun's radiative effects, yields:
http://www.agu.org/pubs/crossref/2009/2008JC004825.shtml
And for recent Nature article references:
http://news.softpedia.com/news/Ocean-Heating-Causes-More-Severe-Storms-100912.shtml
And the list of articles citing new ideas and understanding of such a limited aspect of solar radiation as ocean heating go on an don. You just have to actually look at the literature to realize that the models are not _complete_. That was my point. It's a _big_ system, with a lot of complex details. ranging from incompletely understood solar flare and sunspot effects to incomplete models of oceanic weather and polar ice cap effects.
-
Re:For our sake
Not only is your link to an article about the "debate" NOT about the recent debate, which was still occurring mere months ago...
You didn't cite any papers, so I had to guess what you were talking about. If you could show me some papers regarding this other debate that happened mere months ago, maybe this would be a more productive conversation.
the article actually supports the assertion I was making, and is nowhere near a "solution" to the problem to which I was referring.
Upon re-reading the press release, I didn't see a factor of 2.6 anywhere. They do mention a 26 year data span, but here's the most relevant quote I can find: "As a general rule, the climate models predict that the tropical troposphere should be warming 1.3 times faster than whatever the surface is doing. And it is only in the tropics that the surface and the troposphere don't seem to follow what the models forecast."
I only linked that press release in an attempt to see if this debate is what you were talking about. Since it's apparently not, I should really just wait for you to link the journal papers that are central to this other debate.
But just in case you're interested, this particular debate began with a 2004 paper by Douglass, Pearson and Singer. As usual, the first step in evaluating any scientific debate is to follow the citations in (for example) google scholar. Notice that a more recent paper (PDF) says: "Our results contradict a recent claim that all simulated temperature trends in the tropical troposphere and in tropical lapse rates are inconsistent with observations. This claim was based on use of older radiosonde and satellite datasets, and on two methodological errors: the neglect of observational trend uncertainties introduced by interannual climate variability, and application of an inappropriate statistical consistency test. "
There are useful lessons to be drawn from this debate. For instance, they suggest (along with other lines of evidence) that GCMs can't yet fully account for ENSO and other inter-annual oscillations, need improved moist convection and cloud parameterizations, etc. I caution people not to make regional climate predictions for precisely this reason: the GCMs aren't yet sophisticated enough. Global averages, however, are considerably more reliable and robust for the same reason that opinion polls with larger sample sizes have smaller error bars.
I understand your statement that "they settled on more robust model evaluation techniques", but if so then they did so remarkably quickly, since this debate was still going on mere months ago, until troposphere warming data was updated to show observations that it was in fact warming as it should have been according to the models.
If you really did under
-
Re:Shhhh!
Indeed I do agree that the IPCC report is the best overview of the science of global warming available, and people will get a much better understanding of things from there than from a place like realclimate.org or climateskeptic.com
At the same time though it is important to remember that some of the people who wrote it may have an agenda, and if you are going to read it (as with anything you read), then you should read it critically and not accept their conclusions merely because they have concluded them. Question their conclusions, ask "how do they know this?" And remember that some of their data may be off (as it has been in the past, though in that case not due to such a horrid breakdown of procedures). -
Re:Four YEARS?
Yeah the 1970's global cooling connection is out of line, but seriously, the climateaudit.org site is weird. It's like some guy has a reasonable hypothesis that the tree-ring data can be mapped to the experimental record differently. This is Steve McIntyre right? He's got no Ph.D, he's founded and worked for mineral exploration companies, and CGX Energy, doing exploration for oil and gas.
He's a mathemetician and economist by training. His paper about hockeysticks seems to be a paper about slightly different hockeysticks. From the paper (you can find the whole thing on Google http://www.agu.org/pubs/crossref/2005/2004GL021750.shtml:
...Their method, when tested on persistent red noise, nearly always produces a hockey stick shaped first principal component (PC1) and overstates the first eigenvalue. In the controversial 15th century period, the MBH98 method effectively selects only one species (bristlecone pine) into the critical North American PC1, making it implausible to describe it as the "dominant pattern of variance". Through Monte Carlo analysis, we show that MBH98 benchmarks for significance of the Reduction of Error (RE) statistic are substantially under-stated and, using a range of cross-validation statistics, we show that the MBH98 15th century reconstruction lacks statistical significance.
That's all fine. That's all good science. Thing is that in the paper, he's talking about monte carlo simulations and the production of hockey-sticks in overweighing the significance of tree ring data. The only hockey-stick in that data is when it dives in the modern period.
The stupid part is that his site overstates the hockey stick continually. Recent popularity seems to try to lead you to believe that the hockey stick paper is about the same hockey stick which everyone got into an uproar about in the Al Gore video. They're not the same. The Al Gore hockey stick, the one with the rising platform thing? that's CO2 levels. He DOES talk about temperature change though... but the hockey stick there is about INSTRUMENTAL temperature changes. It should be around minute 23:50 on the Inconvenient Truth.
Gore: http://user.cloudfront.goodinc.com/community/zach/inconvenient_truth.jpg
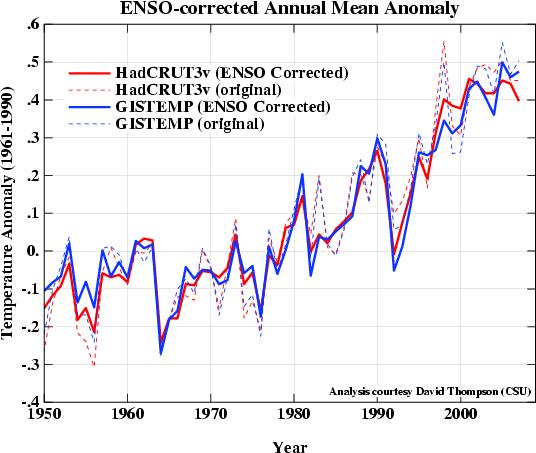
Steve McIntyre: http://climateaudit.org/2009/12/10/calibrating-dr-thompsons-z-mometer/
Sure if you talk about TEMPERATURE alone, then McIntyre can make a reasonable statement that the combined temperature graph is dodgy, but the hockey stick people remember is the one with Gore on the platform, with current and projected CO2 levels.
The argument that Steve McIntyre seems to be trying to make is *really* that the tree ring data is good, the stats are bad, and that if you use good stats (which he's qualifed to talk about as a mathetician and economist), then the 15h century does a bit of a woomp downwards before you get into the instrumental data which explodes... he just ignores the recent explosion in instrumental temperatures (aside from his climategate escapades, which are totally political).... and the CO2 data.
Seems there are all kinds of hockey sticks... the dendro one, the instrumental one and the CO2 one. McIntyre has a point about the dendro one, he's got a lot of politics over the CRU thing and the instrumental one, but no science (understandably), does he talk about CO2?
Let me know if I got something wrong, please.
-
There's a problem with melting polar cap hysteria
How is solid evidence of shrinking polar caps not highly damaging?
It's rather cyclical and more likely caused by the sun than by humans.
-
Re:Climate change is a security threat
Once again, you're quoting amateurs who don't know what they're talking about. In this case, West Virginia Office of Miner's Safety chief engineer, Monte Hieb. Here's his webpage. Now, you might be asking yourself why you're getting your science data from a mine safety engineer. If not, you probably should!
Here's the huge blunders he makes in his numbers:
1) He only credits a small portion of the CO2 to anthropogenic emissions. Why? He doesn't say it, but one can only assume that it's because natural emissions are higher than anthropogenic emissions. The problem with this argument is that natural emissions of CO2 are nearly perfectly balanced with natural sinks of CO2; that's why CO2 levels have historically fluctuated by such small amounts on the order of thousands of years. We haven't had CO2 levels this high in at least the past 15 million years. Picture a half-full bathtub draining water at a constant rate, with water being added to it at the same rate. The level of the tub remains the same. Now start adding extra water -- even a small amount. The bathtub will steadily fill up. Our emissions are not matched by corresponding sinks.
CO2 levels in the atmosphere are very easily measured. Past levels are very readily measured from air bubbles trapped in ice cores. Here's what you see. That's the addition to the atmosphere that is not balanced out by a corresponding CO2 sink. The atmosphere's C13/C12 ratio changed 1/5th as much in the entire last glacial as it changed in the past 150 years (the C13/C12 ratio shows how much of our atmosphere is made of old, deep carbon rather than fresh surface carbon).
You should also know that Hieb faked this graph. Go compare his graph to the DOE's that he "cites". He adds a "natural" and "manmade" column that exists nowhere on his reference, thus making it sound like the DOE believes what he's trying to imply.
2) He does no calculations to determine his water vapor forcing. None of his references are primary sources, and in fact, one of them states that the elimination of CO2 entirely from our atmosphere would lower heat-trapping efficiency by 12% and elimination of water vapor would lower it by 36%. That said, all of his references for the "95%" number trace back, ultimately, to "Solar Radiation Absorption by Carbon Dioxide, Overlap with Water, and a Parameterization for General Circulation Models" (Ramaswamy, 1993). Please pay attention to the title. Solar radiation absorption. That is, incoming radiation, not outgoing. Here's the abstract. You probably don't have access to the full paper, but I do. The very first line is, "A proper representation of the absorption of solar radiation in the atmosphere is important to determine accurately the radiative fluxes and heating rates in weather forecasting and climate models." Got that? Solar, not re-radiated infrared from Earth's surface. The greenhouse effect is based on absorbing as *little* solar radiation as possible and as *much* re-radiated infrared as possible.
Want real references and numbers for the *total* greenhouse contribution? Here you go. For a more layman's version, here. These numbers all come from first principles.
I hate to dump on Hieb so hard for this, but this is what you get when you go to a coal mine safety engineer for science.
3) As has been mentioned to you before, and is something Hieb completely ignores, water vapor is not forcing. It's feedb
-
Re:Climate change is a security threat
[...] there is no really good scientific evidence of a threat from CO2 (and I seriously doubt you can show me any good evidence of a link).
It's hard to receive "really good scientific evidence" if you have your head in the sand.
-
Here's a terrific global-warming video....
...that *everyone* should watch: http://www.agu.org/meetings/fm09/lectures/lecture_videos/A23A.shtml
The video is of a lecture given at the American Geophysical Union 2009 Fall Meeting. The lecture was given by a professional scientist, for an audience of scientists -- so you get the straight scientific scoop (not the dumbed-down Al Gore version).
The lecturer (Dr. Richard Alley) is an AGU Fellow and a member of the National Academy of Sciences.
Highlights:
Shortly after the beginning of the lecture (a little over 3 and 1/2 minutes into the video), Dr. Alley shows an email cc'd to him by a Penn State alum who is demanding that he be dealt with severely for "crimes against the
There's a nice debunking of the silly "CO2 lags warming, therefore CO2 cannot cause warming" talking-point, starting at about 35:30.
The "cosmic ray" hypothesis is very nicely taken apart starting about 42 minutes into the video.
Starting at about 45:40 is the "money-quote" recap -- a quick two-minute-ish summary of why CO2 *must* be the primary driver of the Earth's temperature.
During the Q&A session, Prof Alley was asked where we might end up if we burned up all the economically recoverable fossil fuels. His reply included the word "Cretaceous". "Cretaceous" means sea-levels 250+ feet higher than today's, no polar ice-caps, and 100F sea-surface temperatures. We are talking about the potential of 65+ million years of climate-change compressed into a few centuries here. And all this was delivered straight from the lips of a leading scientist (not a Gore/Greenpeas type). That's a sobering thought, folks.