 Slashdot Mirror
Domain: dot.gov
Stories and comments across the archive that link to dot.gov.
Comments · 866
-
Delta had little choice.
Delta had very little choice but to swallow the losses (or face fines). The Department Of Transport has strict rules that ban price changes after a fare has been ticketed (money has changed hands, a contract for carriage is agreed).
TLDR:
From: http://airconsumer.dot.gov/rules/EAPP_2_FAQ_01-11-2012final.pdf
--
8.
Does the prohibition on post-purchase price increases in section 399.88(a) apply in the situation where a carrier mistakenly offers an airfare due to a computer problem or human error and a consumer purchases the ticket at that fare before the carrier is able to fix the mistake?Section 399.88(a) states that it is an unfair and deceptive practice for any seller of scheduled air transportation within, to, or from the United States, or of a tour or tour component that includes scheduled air transportation within, to, or from the United States, to increase the price of that air transportation to a consumer after the air transportation has been purchased by the consumer, except in the case of a government-imposed tax or fee and only if the passenger is advised of a possible increase before purchasing a ticket. A purchase occurs when the full amount agreed upon has been paid by the consumer. Therefore, if a consumer purchases a fare and that consumer receives confirmation (such as a confirmation email and/or the purchase appears on their credit card statement or online account summary) of their purchase, then the seller of air transportation cannot increase the price of that air transportation to that consumer, even when the fare is a “mistake.” A contract of carriage provision that reserves the right to cancel such ticketed purchases or reserves the right to raise the fare cannot legalize the practice described above. The Enforcement Office would consider any contract of carriage provision that attempts to relieve a carrier of the prohibition against post-purchase price increase to be an unfair and deceptive practice in violation of 49 U.S.C. 41712.
-- -
Re:Why bother?
One of every four Bridges in the US is broken: http://www.forbes.com/sites/williampentland/2011/08/07/one-of-every-four-u-s-bridges-is-broken/
The US government has a website specifically addressing problems with closed roads: http://www.fhwa.dot.gov/trafficinfo/
Millions in the US drink dirty water http://www.nytimes.com/2009/12/08/business/energy-environment/08water.html?pagewanted=all&_r=0
Energy poverty. Budget cuts in the US are causing people to freeze to death http://www.politicususa.com/2013/12/20/republican-budget-cuts-literally-causing-people-freeze-death-streets.html -
Re:Thanks, California taxpayers!
The national average for gas this year was about $3.60, and your average 20-54 year old drives 15,000 a year.
http://www.fhwa.dot.gov/ohim/onh00/bar8.htmThe average new car gets 33mpg, and the average new truck gets 25. That's $136/mo in gas, or $180/mo in gas.
The average car on the road in 2010 - the one you'd be replacing with a Tesla got 23mpg, or $195/mo. Considering it's been creeping up by a mile or so a year, let's call the average savings over replacing the average car on the road, driving the average number of miles for an employed active driver $180/mo.
http://www.rita.dot.gov/bts/sites/rita.dot.gov.bts/files/publications/national_transportation_statistics/html/table_04_23.htmlThat $180/mo in gas likely costs about $25 in electricity, depending on your grid prices.
You save on average about $155/mo in fuel by switching to electric vehicles.
You can get a Leaf for about 22k after tax breaks, which means you don't break even on fuel costs for well after the life of the car (12 years), but you you do break even over a Nissan Versa Note (same car body) in 4.3 years.
And, you know, you get to be smug about it in the process...
-
Re:What's the answer?
Red light cameras, for example have been shown to lead to an increase in accidents at the intersections where they get installed.
This is true. The Federal Highway Administration found that red-light cameras increase rear-end collisions but reduce more severe right-angle collisions, saving $50,000 in collisions per intersection per year in medical and repair costs.
Here's how to fix the increase in fender benders. Yellow lights timings are set to give you one second to react, plus enough time to slow to a stop or proceed through the intersection on the yellow. When you're speeding, you have less time to react and must brake harder or blow the red. If intersections with red light cameras also had speed cameras, people would no longer speed through those intersections and therefore wouldn't need to brake so hard when the light changes. As a result, there would be fewer rear-end collisions.
Of course the best solution of all is to eliminate traffic signals and their associated red-light cameras, and switch to roundabouts which not only can handle greater volumes of traffic more efficiently than signals but also result in a 37 percent reduction in overall collisions, a 75 percent reduction in injury collisions, a 90 percent reduction in fatality collisions, and a 40 percent reduction in pedestrian collisions.
-
Re:Something has to give, buddy
Never dropped this on anyone before, but:
[citation needed]
Average fuel economy of US passenger car fleet: 24.9 (a new record!)
Estimated average motorcycle fuel economy: 35 - 40 mpg. Many models get almost double that.
Show your data where "most motorcycles use more fuel than cars", or shut the fuck up.
Interestingly enough, a Prius gets 51/48 est. mpg, which is significantly better than the average for motorcycles, meaning that the Prius uses less gas than most motorcycles. (Simple statistics) For all passenger cars, the average is over 35mpg. It appears that motorcycles on average aren't much better than cars. Sadly.
-
Re:Not fixed yet (but Tesla is still efficient)
Let's convert how much energy is wasted in tesla's sleep mode compared to a fossil fuel car: According to yahoo answers, 1 gallon of gasoline = 34.7 kWh.
Energy consumed by a model s in a month = 30 x 1.1 = 33 kWh Converting 33 kWh to equivalent gallons of gasoline = 33 / 34.7 = 0.95 gallons
The tesla wastes the equivalent of 1 gallon gasoline/month while parked!
I hope Tesla keeps working on reducing the amount of energy wasted. But lets use those same numbers for cars that actually get driven and see how the Tesla compares:
Given the average US driver drives 13476 miles per year, which is 1123 miles per month. And the average new car gets 24.9 miles per gallon. Therefore the kWh equivalent for the average ICE car is: 1123/24.9*34.7 = 1564 kWh / month
Whereas the Tesla consumes 38 kWh/100 miles. So for the Tesla we have: 38/100 * 1123 = 427 kWh driving per month, plus 33 kWh wasted per month gives a grand total of 460 kWh / month.
In other words, for people that actually drive their cars, the Tesla uses less than 1/3 of the energy of an ICE. Which seems relevant to the conversation.
Now, to be fair. I bet that people drive their Teslas more aggressively and get less than the EPA 38 kWh/100 miles. And there is the drain of accessories, etc. But that is a lot of headroom, I doubt any of the similar sized ICEs ever come close to the Tesla in energy efficiency.
-
best application: the elderly
at age 65, fatal accidents go waaay up. i blame the old people sunglasses and old people.
-
Re:When you have a bad driver ...
Come now – "a tricycle can become deadly"?
Many, many more people run over their children in the driveway compared to the number of kids killed by their toys.
Cars are the number one cause of death for children after infancy. When we complain about people worrying about stupid things, this is what they should worry about. More than half of all kids are killed by automobiles, far more than any other cause.
http://www-nrd.nhtsa.dot.gov/Pubs/810803.PDF
http://webappa.cdc.gov/cgi-bin/broker.exe (Center for Disease Control, fun interactive graphs about death and dying).If a specific kind of car adds even more danger to this carnage, (hmm, a pun) I see no reason why they shouldn't be removed from the road. I'm happy to blame drivers, but I'd like to take dangerous tools out of their hands too.
Now, whether the issue of regulating the minuscule number of these exotic cars matters in the overall issue of traffic danger, is another matter. We should not focus on a few cars without looking at what measures would actually increase safety in general. But if these cars (and the people who chose to drive them) are costing other people's lives, I'm happy to take their keys away. Let them drive a tricycle, no?
-
Re:Really?
Yes.
-
Re:Trust the industry, what could go wrong?
Here is a 2008 report with statistics from NHTSA about accident causes. The number of ways they break down accident causes is kind of overwhelming, but there are a few interesting things you can extract. One of them is that "other vehicle encroachment from adjacent lane" is the "critical pre-crash event" in only 0.5% of accidents, while "travelling over the lane line" accounts for 10.8%."Turning or crossing intersection" accounted for 36.9%, and "travelling off the edge of the road" accounted for 22.2%.
-
Re:Sooo....
A couple of facts that you state:
1) You are a liberal, and you have friends that are liberal and share your views stated in the post
2) Walking the streets of even "big bad cities" is not dangerous
3) People who concealed-carry are scared of their own shadows and paranoid of the "man on the street"
4) Autos are much more dangerous than gunsBased on these three facts that you have clearly stated, why does the liberal party in the US:
1) Call for disarmament of the populace (they are less dangerous than riding or driving a car)
2) Do not call for disautoization of the populace (ok, that word was made up but it fits)
3) Promote "gun free zones" and not "auto free zones"Dude, you are kind of making a fool of yourself with your post. And not helping your cause any, by showing that the libs are attacking the wrong target: guns instead of cars, and enforcing the idea that the "inner city, urban" population is not in a needy, crime-stricken state. Wow.
However, you are correct in stating that cars are more deadly to the populace than legal guns. Or, illegal guns for that matter. Or both put together. Not by much, mind you: in 2010, 31,672 deaths were attributed to firearms (of any type, used in any way), and 32,367 to auto deaths. (Citations: http://www-fars.nhtsa.dot.gov/People/PeopleAllVictims.aspx and www.cdc.gov/nchs/pressroom/FIREARM_DEATHS_AND_DEATH_RATES.pdf). More people die from the flu and pneumonia than by firearms (http://www.cdc.gov/nchs/fastats/deaths.htm), and firearm deaths are absolutely dwarfed by death from cancer and heart disease!
Being the champions of the Federal Government being their "super-mom", the left has taken this media-bloated (revenue-generating: they have to sell ads!) "cause" to a higher level of importance than it should ever have been. And the rest of the world, who only hear the hyped-up news from this country and not the day-to-day, non-ad-selling news, back your silly little idea of "saving the children!" by banning guns!
The truth is, that since there's no hard-and-fast evidence, and there is no law *requiring* it, not all postive gun uses are reported and that makes it very difficult to show the inverse of your arguement. However, the vast majority of gun uses in the US are either benign or positive (www.cato.org/pubs/wtpapers/WP-Tough-Targets.pdf), and have led to LESS crime than ever before, even in the "big bad cities".
-
Re:LOL Tesla
According to a fairly old NHTSA study in the 90's, roughly 3% of gas cars catch fire in an accident, with a lower incidence in non injury events. Now, next question, how many tesla's have been in an accident? http://www-nrd.nhtsa.dot.gov/Pubs/807675.pdf
-
Re:Can someone please explain ...
Sure, weight x distance is generally fairer than just direct gas usage. But if we're going to go there, why not do it properly? Damage to infrastructure is proportional to the 4th power of weight; thus, we should probably tax something like ([miles travelled]/1000miles)*([vehicle weight]/1500lbs)^4 for vehicle registration. That would take into account the proper damage. The average american drives 13476 miles and the average fleet curb weight (in 2004, latest i could quickly find) was 3239 lbs; this would give a result of $293 for registration. If you drove the same amount in a vehicle half that, you'd pay like $17, and if you drove a vehicle twice that weight you'd pay $4466. That would take into account proper damage incurred on infrastructure.
From the article: "Our research found that the fourth power is often inaccurate, " continuing: "More importantly, pavement serviceability is often not the most relevant measure used by highway agencies to trigger maintenance activities."
-
Probably none.
Every safety expert will tell you that the NUMBER ONE cause of whole classes of accidents is poor illumination.
No they won't. According to the US's NHTSA, the top cause of accidents is inattention. Nearly 41% of accidents involved distraction within 3 seconds of the accident. 71% of accidents occur during the day. Night driving in dark, unlit conditions accounts for only 12% of accidents.
So, unless "whole classes of accidents" means "just the ones with poor illumination," your statement is unlikely to be meaningfully true.
LEDs are worse, vastly worse. They are NOT bright. They get VERY hot if they are high powered. And the light they put out is of the very WORST kind, when the needs of the Human eye are taken into account. The Human eye HATES light composed from extremely narrow bandwidths.
Citation needed.
And when Team Soros/Blair/.Obama tell you...
Yeah, yeah. And tell us what the lizard jews running Zurich want the Illuminati to do next.
-
Re:It would be safer if cyclists followed traffic
We're reading the study quite differently. I think it's quite clear that the researchers were interested in neither legal culpability nor determining which party made the "worse" error in judgement. They quite clearly state that listing an accident as caused by one party or another is for classification purposes only.
I agree that we are reading it differently, and I admit your interpretation of the researchers' interests is a possible one - but it is far from clear. It certainly isn't clearly stated that the labels are for "classification purposes only" anywhere. Do you mean this quote?:
The categories are defined by the driver- or cyclist-actions that describe each event most succinctly. Categories named "Ride Out..." refer to the actions of a cyclist, while "Drive Out..." refers to the actions of a motorist. Although they may refer to the actions of only one party, these labels are not intended to assign fault.
Again the "assign fault" in the above quote means legal culpability. Possibly it means physical "cause" as well, but this is doubtful, as they are quite clear about making a specific distinction between "cause" and legal "fault" later on (when discussing cyclists riding on the sidewalk):
As you can see here, they are saying that while a cyclist riding on a sidewalk who gets struck by a car at an intersection might be found legally culpable they attribute the actual cause of the accident to the motorist's behaviour
Nowhere do they say the bins are arbitrary classifications. The bit about "...that describe each event most succinctly" indicates that the bins ARE related to the behaviours which precipitated the collision. Furthermore, their bin types are derived from (and meant to be comparable to) those of the Federal Highway Administration's (which you can find here: http://www.fhwa.dot.gov/publications/research/safety/pedbike/96104/). The FHA's crash types are specifically defined as:
These crashes can be classified or "typed" by their precipitating actions, predisposing factors, and characteristic populations and/or location that can be targeted for intervention.
So, the type classifications they're using are very much meant to indicate which behaviour precipitated the collision (and who's behaviour needs to be corrected)
In the quotes I included above the researchers disclaim both fault and absolute cause.
I believe I have already adequately addressed your first quote, but your second quote: "Thus it cannot be said, for instance, that more cyclists than motorists caused collisions by disobeying traffic control." is taken entirely out of context. It's from a section dealing with other secondary contributing factors that may have played a role in addition to the main cause. The sentence you quoted is referring to their inability to make an accurate comparison of cyclist caused collisions due to disobeying traffic control vs motorist caused collisions due to disobeying traffic control - because secondary contributing factors were not recorded in all cases. Here's the same quote with the relevant preceding context:
It's quite clear from that section that
-
Re:How safe?
Google is your friend, it can show you every last killed and injured biker.
http://www.nhtsa.gov/Bicycles
http://www-nrd.nhtsa.dot.gov/Pubs/811743.pdfOTOH there are 89 car related deaths each and every day in the US, those too do not make the front page.
http://en.wikipedia.org/wiki/List_of_motor_vehicle_deaths_in_U.S._by_year
From the links, bicycle fatalities accounts for about 2% of traffic fatalities each year. I highly doubt that as much as 2% of travelers are using bicycles.
-
How safe?
Google is your friend, it can show you every last killed and injured biker.
http://www.nhtsa.gov/Bicycles
http://www-nrd.nhtsa.dot.gov/Pubs/811743.pdfOTOH there are 89 car related deaths each and every day in the US, those too do not make the front page.
http://en.wikipedia.org/wiki/List_of_motor_vehicle_deaths_in_U.S._by_year
-
Re:Can someone please explain ...
Sure, weight x distance is generally fairer than just direct gas usage. But if we're going to go there, why not do it properly?
Damage to infrastructure is proportional to the 4th power of weight; thus, we should probably tax something like
([miles travelled]/1000miles)*([vehicle weight]/1500lbs)^4
for vehicle registration. That would take into account the proper damage.
The average american drives 13476 miles and the average fleet curb weight (in 2004, latest i could quickly find) was 3239 lbs; this would give a result of $293 for registration. If you drove the same amount in a vehicle half that, you'd pay like $17, and if you drove a vehicle twice that weight you'd pay $4466.
That would take into account proper damage incurred on infrastructure.
________
13476/1000 = 13.476
3239/1500 = 2.1593
13.476*2.1593 = 29.552868
29.552868 * 29.552868 * 29.552868 * 29.552868 = 762778.66That's a lot of tax!
-
Re:Can someone please explain ...
Sure, weight x distance is generally fairer than just direct gas usage. But if we're going to go there, why not do it properly?
Damage to infrastructure is proportional to the 4th power of weight; thus, we should probably tax something like
([miles travelled]/1000miles)*([vehicle weight]/1500lbs)^4
for vehicle registration. That would take into account the proper damage.
The average american drives 13476 miles and the average fleet curb weight (in 2004, latest i could quickly find) was 3239 lbs; this would give a result of $293 for registration. If you drove the same amount in a vehicle half that, you'd pay like $17, and if you drove a vehicle twice that weight you'd pay $4466.
That would take into account proper damage incurred on infrastructure. -
Re:They didn't think this through
It's not that simple mate. Gas-powered cars are just a small part of the problem, they impact mainly large cities.
No, the CO2 in the atmosphere is more or less homogenised. It doesn't matter where it's emitted.
There's also planes and container ships (look at the drop in pollution during the flight ban post 9/11), they impact the higher atmosphere and the seas respectively. These two areas each are bigger than the earth's landmass, plus they move around the planet and spread pollution much more quickly, yet they are largely unseen by the average city-dweller.
As to whether planes are worse than cars:
For the US, about 28% of total CO2 emission comes from transport, 33% from electricity generation and 20% from industry.
http://climate.dot.gov/about/transportations-role/overview.htmlOf the CO2 from transport about 61% is from "cars and light trucks", 18% from big trucks and busses, 10% from aircraft, 4% from ships and 2% from rail.
http://www.ucsusa.org/clean_vehicles/why-clean-cars/global-warming/So you are simply wrong. Cars are a part of the problem, much worse than planes or ships.
-
Re:jerk
Traffic related fatalities are on par with the amount of gun deaths in the U.S. http://www.usatoday.com/story/news/nation/2013/01/09/guns-traffic-deaths-rates/1784595/. Plus traffic related fatalities is the leading cause of death among children 2 to 14 years old http://www-nrd.nhtsa.dot.gov/Pubs/810803.PDF.
One can make the argument that it's not clear the current method of enforcing traffic laws is actually helping those statistics, but that's another point (although the following article says speeding is the leading cause of traffic deaths in NYC: http://www.streetsblog.org/2013/03/18/dot-speeding-the-leading-cause-of-nyc-traffic-deaths-in-2012/). I personally think it's barbaric how many of our deaths and injuries come from vehicles. If you ask me more autonomous ways of driving couldn't come soon enough, in whatever form that takes.
-
Re:now i will never fly BA
No, I don't. Both by my own experience and observation, at least here in Europe, luggage does get lost, but not on a routine basis.
But why guess when you have facts?
The most recent available report is from last year:
http://airconsumer.ost.dot.gov/reports/2012/September/2012SeptATCR.PDFThe average is 3.52 reports per 1,000 passengers, or 0.352%
-
Re:Five Star
His calculation is even using the very low mileage of 15k miles. Use a more mid range value of 30k miles and you are in the 5 year break even point. Nice.
30,000 miles/year is the "mid range"? I used 15K since that's what AAA uses for an average driver. I can't find any good statistics for the USA in general, but in Florida,the average is 13K miles/year
I can't believe that 30,000 miles/year is the national average - that's 80 miles/day (or 120 miles for each business day) which seems absudly high in a nation with an average commute distance of 12 miles.
-
Redelmeier and Tibshirani had better methods
The original study that they are trying to debunk with this new bunk used better methods: direct measure of the number of accidents and direct measurements of whether the drivers were using their cell phones when they had the accidents.
And by the way, they concluded that hands-free devices are just as dangerous as the regular cell phones.
http://www-nrd.nhtsa.dot.gov/departments/Human%20Factors/driver-distraction/PDF/5.PDF
-
Re:Obviously fake
Those legal standards can be read here:
http://mutcd.fhwa.dot.gov/SHSe/Alphabets.pdf
Indeed, there is no "Arial." The font choices are all custom.
-
RE: Asiana flight 214
Do Pilots Rely Too Much on Technology?
Requirements for private level pilot's license (most common non-commercial license):
- Be at least 17 years old (16 years old for glider or balloon rating)
- Be able to read, speak, write and understand the English language
- Obtain at least a third class medical certificate from an Aviation Medical Examiner (except for glider or balloon)
- Pass a computerized aeronautical knowledge test
- Accumulate and log a specified amount of training and experience, including the following:
- If training under Part 61, Title 14 of the Code of Federal Regulations (CFR) section 61.109, requires at least 40 hours of flight time, including 20 hours of flight with -an instructor and 10 hours of solo flight (i.e., by yourself), and other requirements including cross-country flight, which include
-Solo requirements:
- 5 hours of solo cross-country time
- One solo cross-country flight of at least 150 nmi (280 km) total distance, with full-stop landings at a minimum of three points and with one segment of the flight consisting of a straight-line distance of at least 50 nmi (93 km) between the takeoff and landing locations
- Three solo takeoffs and landings to a full stop at an airport with an operating control tower.Night requirements:
- 3 hours of night flight training
- One cross-country flight of over 100 nautical miles (190 km) total distance
- 10 takeoffs and 10 landings to a full stop (with each landing involving a flight in the traffic pattern) at an airport
- 3 hours of flight training on the control and maneuvering solely by reference to instruments
- 3 hours of flight training for cross country flights
- 3 hours of flight training with an authorized instructor in preparation for the practical test, which must have been performed within the preceding 2 calendar months from the month of the test
- If training under Part 141, at least 35 hours of piloting time including 20 hours with an instructor and 5 hours of solo flight, and other requirements including cross-country and night flights
- Pass an oral test and flight test administered by an FAA inspector, FAA-designated examiner, or authorized check instructorRequirements for a standard Class F Driver's License (General, varies from state to state):
- 16-21 years of age
- pass a simple written exam
- circle the block and parallel parkWith more than 250,000,000 vehicles operating on public streets, it sounds like a recipe for disaster to me.
-
Re:So long truckers
Average mileage for my age bracket (males & females) is 15098/year. http://www.fhwa.dot.gov/ohim/onh00/bar8.htm.
At 40 mpg, this uses 377.45 gallons of gas.
At $3.50/gallon, this is $1321.08/year.
With 12 months/year, this is $110.09/month.I am driving below the average for people in my bracket, and far below the average for males in my bracket.
You appear to have either 50% cheaper gas ($1.75/gallon), 50% less driving (the category for women between 55-64?), or some combination of these items.
Also please note that I included statistics for how far I was driving: approximately 14500 miles/year.
-
I won't be hard for robots to do better than us
I could not easily find complete data for 2012, (odd in itself) but in 2011 just over 32,000 people died in car crashes. I think there will be an evolution towards driverless cars. The distracted generation will want their cars to drive for them. And I for one really want their cars to drive for them. Think of it. Each year ten times the number of people who died on 9/11 die in cars (or under them). Maybe we should declare war on Detroit. Oh, wait. It self destructed. Okay, Tokyo then. But you get my point. Higher levels of automated auto safety will save lives. Let's really put auto in the automobile. Of course you can have my Chevy pickup when you pry it from my cold dead hands. However that time may come sooner than later.
-
yeah, that'll work
But, based on the evidence from NHTSA itself, though, hard to argue for this on the evidence of any kind of dose-response curve:
% of fatalities involving0% alcohol: 62%
.01 -
.08% or more alcohol: 32% (including
http://www-nrd.nhtsa.dot.gov/Pubs/810985.pdf Table 4
Holds for national figures and for what looks like every state.
"In 2007, 84 percent (12,068) of the 14,447 drivers with a BAC ofNote that this already skewed result is not corrected for number or drivers or miles driven. Given the relatively small percentage of drivers who are out there with
However, certainly nothing there suggests that dropping the limit to
Exclude the group with
These two groups represent a total of 68% of fatalities. How does the ratio of fatalities between the two groups compare with a hypothetical ratio of miles driven or drivers between them?
If we guess that 62/68, or 91% of drivers or miles with less thanThis isn't surprising, though. Previous studies didn't find that some minute amount of alcohol suddenly makes crashes and fatalities shoot up. It's not even vaguely proportional to alcohol level. What they found is that the bulk of crashes and fatalities are associated with a tiny fraction of drivers with very high blood alcohol. And, when they look at other parameters, these folks tend to have a whole parcel of antisocial and risky behavior; hyperaggression, depression, criminal convictions, history of violence, no driver's license, no insurance, no registration, dangerously unmaintained vehicles etc. Maybe the pathology causes the alcohol consumption; maybe the alcohol consumption causes the pathology; maybe both. Most people have heard the folk wisdom that some folks get aggressive when they're drunk, other folks get suicidal, etc. But the whole package is quite literally an accident looking for a place to happen.
And these other factors, co
-
Re:Citations? They need to be sued heavily
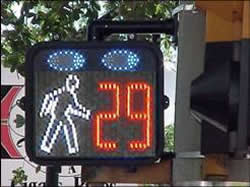
In my town, the walk/don't walk signs have a display that counts down the seconds left for the "walk" time. Then the red "don't walk" symbol pops up, and shortly after that the light turns yellow.
It's extremely helpful -- if I'm half a block away and the sign says 12 seconds left, I know I'm going to get through the light on green. If I see 2 seconds left, I know it'll be red and there's no point in doing anything other than coasting.
The signs we have look sort of like this (but without the glasses looking symbol on top): http://safety.fhwa.dot.gov/ped_bike/tools_solve/ped_scdproj/webinar052809/las_vegas/images/image081.jpg
-
Re:Why not just 0?
No, you dont.
Did you even check, or did you assume? What sort of Americans are you dealing with when they're 'shocked' by 100 km to the next gas station? That's only 60 miles. I've seen signs that say 125 miles to the next, or 200 km. Must be East-coasters who think the mid-west is 'flyover country'.
Let's check your work: You guys average 15530 km per year
Americans average 12k-15k miles per year, this site says 13,476 miles. Which works out to 21,696 km/year. Or 40% more than Aussies, which I'd qualify as 'heck of a lot more'.Let's verify a bit: Population of Australia: 22.7M. KM driven: 232,453M km. KM per man, woman, and child: 10,240 km.
Population of the USA: 313M. Distance driven: 3M million miles., or 3,000 Billion miles. 9,413 miles per year, or 15,154 km per person. 48% more than Australians.but if you blow 0.06 an Aussie cop would just tell you to sit down for half an hour and test you again if your BAC reduces he lets you go as long as you pass the personality test).
Personality test? Oh, institutional corruption, got it.
Once again, Australia has already solved this problem. If you cant pay your fines in Australia, a sheriff starts repossessing your property (starting with your car). As for people who drive on a suspended license, they risk years in jail here in Australia.
You mean the totaled car that was wrapped around a tree? Or do you kick people out of their homes in Australia?
Oh, and we do it in the USA as well. Problem being that, especially for multiple DUI offenders they generally drive such crappy cars that it costs more to have the sheriff confiscate it then they get at auction. Oops...You'd be surprised how many offenders are white collar.
You really think this? The problem is twofold:
1. The poor people can't pay the fines. It costs somewhere around $22k/year to keep them in jail/prison.
2. The rich people can pay the fines, then carry on more or less like nothing happened.
3. Both parties will often obtain a $500-1000 car to drive that they register under somebody else's name so no breathalyzer equipment is installed.A first time DUI in the USA can run you over $15k. It's not cheap.
You're going to have to face it: There isn't some 'magic bullet' policy difference between the USA and Australia. It's a lot of little ones, and the difference between
This is why blood tests will reduce the number of people going to court.
With the really sleazy lawyers they'll still go to court, especially the rich types, because all they have to do is convince the jury something is in doubt, that he doesn't deserve the conviction, get some piece of evidence like the blood test tossed out on some technicality, etc... Heck, get some sympathetic drink-drivers on the jury. Lots of options.
Stop locking up pot heads and concentrate on removing actual dangers from society.
Agreed.
-
Re:dealerships suck.
I think the point is that the manufacturer would be less willing to come forward with the information to initiate a recall over a 3rd party.
They don't have to; the NHTSA maintains a publicly-accessible database
-
Re:Yay!
Mostly to the quick medical response and hardware safety features.
Non-fatal injury rates are also down significantly. From the chart there looks like about 130 injuries per 100M vehicle miles in 2000 to 75 injuries per 100M vehicle miles in 2010.
Even one traffic accident fatality or trauma is too many. It is absolutely avoidable.
Yeah, and Mussolini made the trains run on time too. No thanks.
-
Re:Organic compounds
Those numbers by themselves are useless in predicting the number of cases of exposure per year. Unfortunately, accurate numbers for the hours an average person drives are hard to come by, but by miles it's around 13,476 per year. Let's high-ball it for the sake of discussion and say the average speed of a motor vehicle is going to be 60 MPH. That means the average driver then spends 224.6 hours in their vehicle.
So the risk to the driver per year would be, er, about 1 in 13.3 million. "Coincidentally" that's about the same rate of you sustaining life-threatening injuries in a car accident, per year.
Or put another way... the statistics look safe, but the reality is... you've made it highly probable that after being trapped in your car, shit burning everywhere, you now have another hazard to face: Your air conditioner is now leaking a highly toxic gas which, if inhaled, could kill you and anyone who tries to rescue you. This particular failure mode will be common in a serious car accident.
Now, while you're sitting your car, chest impacted with the steering wheel, blood gushing from your nose, smoke and flames everywhere, I want you to think about this: Do I, a potential rescuer, want to risk walking into a fume of toxic gasses that the CDC says is very deadly and could be a very effective chemical weapon for terrorists... to save your ass?
Hangon... I'm still thinking about it.
Thinking.
Can you please stop screaming? Trying to think here, HELLLO.
-
Re:Bullshit!
If you claim it's OK to do those things, then please tell me what exact period of time am I allowed to turn away from the highway and look at my mirror or odometer? And if so, why can't I use that same amount of time to look at a GPS?
Less than 1.6 seconds does not increase your crash risk significantly. More than 2 seconds is right out.
http://www-nrd.nhtsa.dot.gov/pdf/esv/esv20/07-0082-O.pdf -
Re:Wait what?
I can't speak to the rest of your post, but the rules for what items can be carried onto a plane change fairly frequently. Your data may have been superseded. I fly every week for business, and can attest to this. However don't take my word for it - a lighter can be lawfully carried onto a plane. With regard to video game consoles, there are rules for those, too. Even the rules for small knives and some sporting goods are changing. This is not to say that I think that I'm a fan of the TSA. I'm just providing more up-to-date information than what you have experienced that may help you to rephrase your premise. Also, from my experience, although the rules are published and are fairly consistent; how they are enforced is not. A good example of this is how rules are enforced in small regional airports. Generally, the TSA officers in the tiny regional airports have a lot of time on their hands to do things like re-run carry-ons through an x-ray machine, excluding my eyeglass cleaning fluid (etc).
-
Re:Good.
Let me start by saying that I believe in reasonable limits and a exercising reasonable responsibility. Companies and industries that knowingly endanger people, don't provide reasonable warning (or hide the dangers), and don't take reasonable precautions in order to reasonably mitigate these dangers should be severely punished. I don't really object to some guy shining a laser at planes being charged with reckless endangerment, or even with manslaughter if it resulted in deaths.
However, that doesn't change the fact that we've turned into culture that is obsessed with laying blame on someone and making excessive limitations for questionable or extremely limited benefit.
I'm not heartless, but we have to face the fact that sometimes shit happens, and isn't always someone's fault. I don't have kids, but yet I'm still aware of their uncanny knack for getting into some weird stuff and do a lot of things that can get themselves hurt. It's their nature, and you try to do the best you can do but sometimes it's going to turn out bad. It's tragic, but inevitable. It isn't necessarily the fault of Bucky Balls, Clorox, the parents, or Planter's. Sometimes these things happen. It's no reason to go crazy with litigation and regulation.
Also, for perspective...
1 death and 33 emergency room surgeries due to swallowing magnets for children
40 U.S. Deaths a year, and 360 injuries from being struck by lightning
An average of about 87 babies and toddlers a year drowned in bathtubs between 2006 and 20010
160 Americans die from Peanuts (I didn't find a stat on children specifically)
2,136 Children were killed in Automobile accidents in the year 2003
2,811 Children were killed by gun violence in 2009There are dangers out there, I'm not denying it. However, I'm not sure we prioritize them properly, and we're certainly too unwilling to admit that just being alive carries a certain amount of risk.
Either that, or we should ban magnets, peanuts, transportation, bathtubs and lightning, and of course lasers...
-
Re:Young most vulnerable and underskilled drivers
Older people don't drive as much as young ones do and have safer cars.
Wrong. "Older" drivers drive as much or more than young drivers do, on average. The young drivers also are driving cars that had to pass safety inspections to be on the road legally, so I'm also fairly skeptical that there's a massive disparity in average car safety betwen older and younger drivers.
-
Yellow light timing
4.5 second yellow - FHWA recommendation.
Per their formula, 4.5 second yellow would be for a level red light at ~35 mph. Assuming 40 mph, level slope, that the intersection is 40 feet wide(2 vehicle lengths of 20 feet), and using the 'usual' figure everywhere else, you get a recommended yellow of 5.2 seconds. Assuming a 10% slope(pretty steep), it increases to 6.8 seconds. I'll note that even 25 mph gives you a yellow recommendation of about 4 seconds, depending on the width of the intersection.
The formula gives people 1 second to decide whether to stop or continue through, and enough time to either stop at a comfortable speed or clear the intersection. Even if you go with the more aggressive ASHTO handbook 11.2 ft/s stopping speed vs the ITE 10 ft/s only drops the recommended change time to 5.5 seconds. Though if you use the more aggressive stopping speed AND ignore slope you do get 4.5 seconds for the change. Going by how common semis are quoted as being, I tried adding another 10 feet to vehicle length, but that was only
Playing with the formula, given what's been stated they need to add a second to the change interval.
Just as a note - it's a recommendation for 'change interval', not 'yellow period'. If they implement a 'all red' period, it counts in the formula towards the duration. So they could have a 4.5 second yellow, 1 second all red, totaling 5.5 seconds for a safe intersection. Though it might be unkind to give somebody a red light running ticket if the ass end of their car was still in the intersection when it went all red.
Crosswalks - Don't you have button types in your area? What cross walks there are in my area are all sensor based - they remain red unless somebody hit the button, in which case it'll give a longer green to give the person extra time to cross. So normally no help there.
-
Re:Let me get this straight
You can carry 4 matchbooks of safety (not strike anywhere) matches.
http://safetravel.dot.gov/which_fly.html
I remember getting on an airplane where one flight attendant freaked out because someone held a lit lighter over a birthday cake and sang happy birthday inside the airplane just after boarding. She confiscated it and after several minutes, returned the lighter after checking with the TSA. I looked around and saw all the other flight attendants move away during the commotion to avoid the scene. She was obviously high strung.
Before the TSA, the only airport to ever freak out on me over the pocket knife and tools I carried with me was Chicago's Midway airport. I even told them I traveled all over and they were the first to ever freak out about it. They made me check my carry on bag. I had taken them as carry on from various other airports when I was sent out to install servers all across the country. That was the first time I had to wait for baggage claim on my return business trip.
-
Re:Drove in circles to draw the battery down!!!
Federal Law requires the speedometer to be within 5mph of actual speed. The disparity was between the review and the logs was much greater than that. Source http://www.fmcsa.dot.gov/rules-regulations/administration/fmcsr/fmcsrruletext.aspx?reg=393.82
-
Re:30,000 killed by firearms, 31,000 by poisoning
Don't forget: 32,885 vehicle-related deaths (2010).
-
Re:Never really understood the point.
But ABS brakes have drastically reduced the number of high speed collisions
I was curious so I looked this up. You are correct. But readers should also be aware that ABS really only helps on non-fatal crashes.
The abstract from the paper:
ABS has close to a zero net effect on fatal crash involvements. Fatal run-off-road crashes of passenger cars increased by a statistically significant 9 percent (90% confidence bounds: 3% to 15% increase), offset by a significant 13-percent reduction in fatal collisions with pedestrians (confidence bounds: 5% to 20%) and a significant 12-percent reduction in collisions with other vehicles on wet roads (confidence bounds: 3% to 20%). ABS is quite effective in nonfatal crashes, reducing the overall crashinvolvement rate by 6 percent in passenger cars (confidence bounds: 4% to 8%) and by 8 percent in LTVs (confidence bounds: 3% to 11%). The combination of electronic stability control (ESC) and ABS will prevent a large proportion of fatal and nonfatal crashes.
-
Re:Why not tax tires instead?
The average driver (20-55) drives 15,000 miles per year. At 30 mpg, that's 500 gallons *.30/gallon tax = $150/year. Tires get 50-60,000 miles, so they really only need to be replaced every 3-4 years. Adding $600 of taxes to $300 of tires isn't going to go over well.
-
Re:Or they could just increase gas tax
It's a shame that fuel costs are making it expensive for big trucks. Fortunately the free market can sort that out - trucking heavy things long distances will become more expensive, and maybe more efficient transport will become more competitive.
The amount of damage caused to the road by a vehicle goes up as the FOURTH power of the vehicle's weight. http://www.fhwa.dot.gov/policy/091116/03.htm
So I have no issue with the cost of trucking going up - right now, it's the big rigs that don't pay their share of the road costs, not the drivers of light, efficient cars.
-
Re:Nah...
If you'll look at the original BTS report, specifically the per passenger mile breakout you'll find that passenger rail is subsidized at a rate higher than that for buses, per passenger mile. And with the experience of the latest light-rail construction in the US (the Seattle Link Light Rail) costing over $176 million per mile to build (approximately 17 times the cost to build a 6 lane highway). Rail can be a good option, but to think it is lower cost than highways - either in deployment or ongoing costs - isn't backed up by reality.
-
Re:PEAK OIL!
The Feds pay for any federal highway - interstates, forest/government access roads. And they kick in large amounts of cash to municipalities in the form of transit grants - which comes from the same pot of cash. Go investigate http://www.dot.gov/ and you'll find billions sent out for things like bus rapid transit, State highway improvements, light rail.
-
Re:Nah...
It's not cars that cause the deficit, it's subsidies for buses and trains that are depleting the Highway Trust Fund. Congress authorized spending from that pot of money for mass transit - and it's a massive drain on the system. Conversely, cars actually generate net revenue for the system.
What does "highway" mean? All roads, or just some roads?
(Maybe it's obvious, but I'm not American.)