 Slashdot Mirror
Domain: eia.gov
Stories and comments across the archive that link to eia.gov.
Comments · 833
-
Re:THE MARKET HAS SPOKEN, YOU LOSE BITCH.
I'm calling BS on this..
IF you look at the total life cycle cost of various industrial sources of electrical energy, Natural Gas is the cheapest. The only way renewables compete is though tax breaks, carbon surcharges, subsidies and accounting slight of hand (where they conveniently *forget* to include the total life cycle costs). https://www.eia.gov/outlooks/a... does a better job.
Renewables do NOT win on numbers. Never have and it's unlikely they ever will in my lifetime if you do a full cost accounting.
-
Mod parent up. 2 kinds of dishonesty in the story.
The stories about plastic in the oceans usually fail to mention that it got there because some countries allow plastic in their rivers! For example: Five Asian Countries Dump More Plastic Into Oceans Than Anyone Else Combined: How You Can Help (Apr 21, 2018)
Banning plastic bags is supported by paper bag manufacturers. Stores in and near Portland, Oregon stopped supplying plastic bags. The underlying reason appeared to be that International Paper (world map) has a plant near Portland. Grocery stores there don't fill the paper bags because the paper bags are fragile, especially when they get wet in the rain.
Paper is FAR more damaging to the environment. First, a huge truck must go to a place where there are trees. The trees are cut and trucked to a processing plant. The plant uses poisonous chemicals to make the paper.
There are MANY examples of paper plant pollution. Here is a Slashdot story: Chile Becomes First Country In Americas To Ban Plastic Bags.
"CMPC is a Chilean pulp and paper company, being one of the biggest in Latin America.
Another plant: CELCO Valdivia Pulp Mill pollution: "The company had been dumping more dioxins and heavy metals than had been approved by the regulating agencies into the river from a waste tube that had been approved by the authorities. It had also been producing far above levels approved in its Environmental Impact Assessment, and was cited for multiple violations of environmental and health laws."
"In July 2007 CELCO agreed to pay CLP$614 millions to Valdivian tourism companies to avoid legal actions for supposed losses of the tourism sector of Valdivia due to contamination of Carlos Anwandter Nature Sanctuary."
"The Secretary of State for the Environment said that, despite having large financial and technical resources, CELCO had an extremely poor environmental record."
We re-use plastic bags to line wastebaskets, and to throw away wet materials. We always throw paper bags away.
Paper buried in trash areas can eventually degrade, but that usually doesn't happen because there is usually not enough oxygen to support the breakdown process. How much oil is used to make plastic?: "Although crude oil is a source of raw material (feedstock) for making plastics, it is not the major source of feedstock for plastics production in the United States."
The natural gas used to make plastic bags is less polluting. Still a problem, but not as much of a problem as using oil. -
Re:Very good, but expected, almost inevitable ...
...that solar isn't going to be replacing coal, but natural gas,,
Coal is disappearing all on its own. In 1997, coal accounted for 52.8% of the electricity generated in the US. In 2017, it accounted for 27.4%. The reason for the decline is that coal plants have been replaced by...natural gas plants.
And now, natural gas plants are being replaced by solar plants. You could correctly say that solar is generating electricity where coal once did. So, solar is replacing coal, but there is an intermediate step.
-
Re:Coal is dead
The reports of coal's death are greatly exaggerated. Of course you didn't RTFA, but at least read the summary: "Coal use contributed to a third of the total increase, mostly from new coal-fired power plants in China and India. This is worrisome because new coal plants have a lifespan of roughly 50 years."
Even in the US coal energy production is projected by the EIA to stay steady through 2050 (see page 7 of this pdf). While the less economic plants do and will continue to get shut down, other things equal the remaining ones will be getting enough money to stay open either via capacity revenue in unregulated markets or cost recovery in regulated markets. If cost reductions for renewables and batteries continue for long enough, it may drive those hold out coal plants out of business before 2050, even in regulated states (see the recent NIPSCO news in Indiana). Add to that potential state environmental regulations and especially a potential carbon price and the case becomes even more dire for coal units. But don't assume they are dead yet.
-
Re:FUD stats...
Demand for electricity in the US has stagnated since the 2008 financial crisis, see this EIA graph. There has been a decoupling of economic growth and electricity demand growth in the US.
-
Re:More pollution? How's that possible?
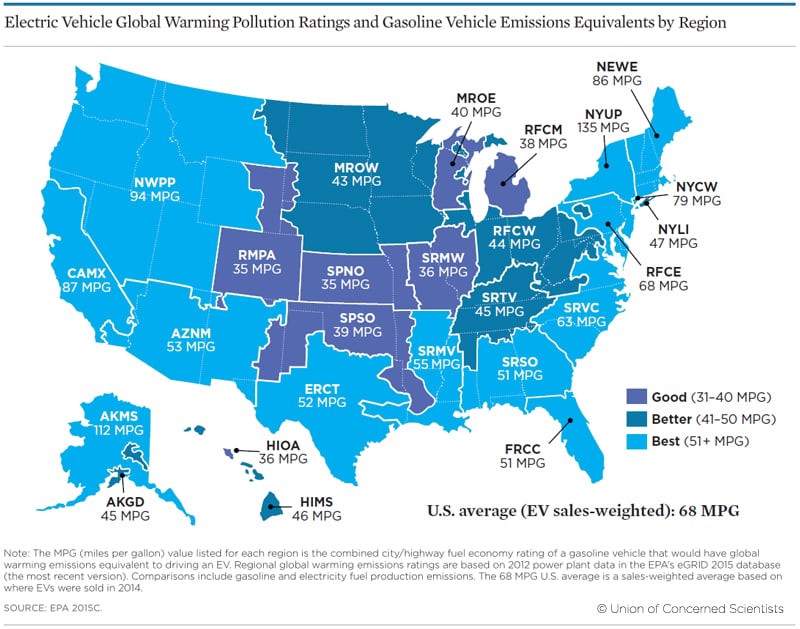
IMHO, if you want to do the least amount of emitting when you drive, you need to remember that nearly 70% of domestic electrical energy production in the USA comes from fossil fuels, including the energy you used to charge that battery.
Actually it's 63.5% (for 2018.) Natural gas provided 35.1% and coal provided 27.4%. Coal has been trending downward since 2008 -- largely due to market forces, not regulations. Nuclear has stayed pretty constant, but renewables have been trending upward.
Somehow I wonder if we'd be better off burning Natural Gas in internal combustion engines over burning it to charge my EV's battery given transmission losses, conversion losses and charge/discharge efficiency and losses you have to over come...
You may have a point, but let's review. Natural gas is relatively cheap and abundant, and while hardly carbon-neutral, it is better on the environment than coal or oil. It will be hard to talk people out of using it, and it may make more sense to burn it in the car rather than in an electrical plan that charges an electric car. However, unburnt natural gas is a far worse greenhouse gas than CO2. Leakage during transport is inevitable. (On the flip side, it does break down in the atmosphere more quickly than CO2.)
TL/DR: it's not just about the tailpipe.
But hey, your mileage may vary (literally) but I'm pretty sure there is no such thing as a "zero" emission vehicle especially if you look at the whole life cycle of the car...
You overlook that electrical energy can be created from many sources, whereas fossil fuels come from only one: fossils, and their availability is far more finite than other sources of energy. No matter how we make it, we're never going to run out of electricity.
-
Re:So what?
So many things wrong.
China was #5 in 2017 with around 4.75 mb/day (and shrinking fast. they are #6 last year)
interestingly, they were #2 consumer of oil with around 12.8 mb/day and growing rapidly. By end of 2020, they should surpass America to be #1 consumer of oil
Before trump, we seriously looked at stopping N. Korea. We thought it was not needed to invade. More importantly, we did not do so because they had not invaded in other nation.
As to Venezuela, we have done nothing against them. All of their issues are of their own making. -
Re:More than enough power in an EV to do so
Every time I point this out, the EV advocates mod me down. The Nissan Leaf comes with a 40 kWh battery, approximately 80% of which is usable (32 kWh). Charging efficiency happens to be about 80%, so you need to use about 40 kWh of electricity to top the battery off with 32 kWh.
The average American home uses 10,399 kWh in a year, or about 28.5 kWh per day. (Apparently a typical Japanese home uses a lot less.) So half-charging a Leaf every day (roughly 50 miles/day use) increases household electricity consumption by (20 kWh / 28.5 kWh) = 0.7 = 70%. Since all that additional electricity consumption happens overnight, if every house has an EV then suddenly the peak electricity consumption period switches from mid-day to overnight. And the lower electricity prices people are expecting to pay to recharge their EV evaporates. Moreso if there's significant solar power generation in the grid. Since solar provides electricity only during the day, the electricity during night to charge all these EVs will have to come from generators the power companies can spool up to meet the overnight demand spike. (Storing solar power in batteries for overnight use is not cost-effective unless solar generation exceeds 100% of daytime consumption. It makes no sense to run other power generators during the day just so you can store solar power in batteries for use during the night, when you can just use the solar power directly during the day (avoiding battery losses) and run the other power generators during the night.)
Meaning you're going to be paying the highest electricity rates to charge your EV, not the lowest. Modding me down doesn't change this truth. The same truth that lets your EV battery power your home for more than a day, also means the power pricing peak will invert when every home has an EV charging overnight. -
Re:Let's just hasten the death of IL..
You heard me right "green" is NOT free, it's actually much more expensive than current alternatives, namely Natural Gas.
While nothing in life is free, your assertion simply isn't true: some utility-scale "green" energy sources are cheaper than current alternatives, including Natural Gas. From the U.S. EIA's Levelized Cost and Levelized Avoided Cost of New Generation Resources in the Annual Energy Outlook 2018 (pdf warning):
Table 1a. Estimated levelized cost of electricity (capacity-weighted average) for new generation resouces entering service in 2022 (2017 $/MWh):
Dispatchable technologies
Plant type | 2018 LCOE including tax incentives
Coal with 30% CCS | NB
Coal with 90% CCS | NB
Conventional CC | 48.3
Advanced CC | 48.1 <–– Natural Gas
Advanced CC with CCS | NB
Conventional CT | NB
Advanced CT | 79.5
Advanced nuclear | 90.1 <–– Cherenkov Blue
Geothermal | 40.3 <–– Green
Biomass | 102.2 <–– GreenNon-dispatchable technologies
Wind, onshore | 37.0 <–– Green
Wind, offshore | 106.2 <–– Green
Solar PV | 46.5 <–– Green
Solar thermal | NB <–– Green
Hydroelectric | 73.9 <–– GreenAs you can clearly see, utility-scale Onshore Wind, Geothermal, and Solar PV are all currently cheaper than Natural Gas. Of those three, only Solar PV becomes more expensive than NatGas when tax credits are excluded (59.1 vs 46.5 $/MWh).
-
Re:Europe rejects technology, uses more coal
Actual numbers on coal use for electricity production in Germany in TWh from 2008-2018 lignite: 150.6 145.6 145.9 150.1 160.7 160.9 155.8 154.5 149.5 148.4 146.0 coal: 124.6 107.9 117.0 112.4 116.4 127.3 118.6 117.7 112.2 93.6 83.0 I know it is an annoying inconvenience to look at actual data before having an opinion, for those who want to learn, the source is here:https://www.ag-energiebilanzen.de/ (PDF below "STROMMIX")
Actual numbers to *Europe* show a 12.4% increase. 11.7 million tons, up from 9.7
https://www.eia.gov/coal/produ...
With electric power being transferred around Europe you can't really look at one country in isolation. For example France used to export nuclear based power, nukes get shut down, countries have to find alternate sources.
The simple fact remains. Europe had to increase US coal imports. -
Re:nuclear power ?
We are therefore not importing oil.
o.0
Oh? US Goverment statistics say we're importing 10.14 million barrels a day.
You can thank fracking.
Yes, we can thank fracking. For untold damage to the environment. For ever increasing damage to the world's climate. For putting billions of dollars more in the hands of the 1%.
Thank you fracking!
-
Solar's problem has always been its sparseness
- The energy density of sunlight hitting the Earth is about 1360 Watts/m^2.
- The atmosphere absorbs enough of that so the amount hitting the ground is about 750-850 Watts/m^2. Figure about 800 W/m^2.
- A 22% efficient panel can then pull in 176 W/m^2.
- But that's peak - you'll only get that much at noon on summer solstice with clear skies. You have to factor in night, movement of the sun, weather, dust buildup, weather, etc (capacity factor). The average capacity factor for fixed mount PV solar in the U.S. is about 0.145, with the desert Southwest peaking at around 0.195. So that brings your average PV solar power generation down to just 25.5 W/m^2 (34 W/m^2 in the desert Southwest).
That means installation large enough to power the average home (10399 kWh/yr / 8766 hours/yr = 1186 Watts) is about 1866 W / 25.5 W/m^2 = 73 m^2 or a 12.8 kW system (55 m^2 in the desert Southwest, 9.7 kW). Although that's based on an average - you'll have a shortage of power in winter, so will probably need an even bigger PV installation to get you off the grid year-round.
That quantity of PV panels costs several tens of thousands of dollars. On the other hand, a reflector/concentrator that size can be made for a few tens of dollars. Though the added bulk will increase the mounting and maintenance costs. So you can see where the guy in TFA is going with this. (I left out cost of mounting and voltage regulation circuitry since I figured it'd be about the same for both cases.)
The other option is to just allow plants/algae to collect solar energy. They use it to convert sunlight, CO2, and H2O into sugar, starches (sugar molecules glued together), and wood (starch molecules glued together). You can then use those as fuel. The efficiency is much lower (around 1% or less). But plants grow and reproduce on their own, so manufacturing cost is zero (negative in cases like weeds where we're actively trying to prevent the plants from growing). You only have to pay for harvesting and processing. Human global energy consumption is about 170,000 TWh per year, which at 8766 hours/yr is 19.4 TW. The rate at which energy is stored chemically by photosynthesis worldwide is estimated to be several hundred TW.
-
Re:California is much more expensive on average
Gas prices in the Bay area as I type this are around $3.40/gal versus around $2.10/gal in the midwest.
I'll always remember at some point in the past talking to a friend over AIM, telling him gas was a bit expensive in my area lately. He asked what the price was.... and it was something around $1.25 at the time? Moments later I got the response of: "Gas is $2.50 here." I then realized how insane prices were in California.
Then again, some time later I had moved to Charlotte and a big hurricane damaged something in the oil lines from Texas and we basically ran out of gas. Prices were around $4/gallon by the time gas became mostly unfindable (except some station with a $6/gallon price some people claimed existed)
-
California is much more expensive on average
Only housing is 400% more expensive. Gas is about 20% more. Most other things are about the same. Fresh produce is cheaper.
Housing is by far most people's biggest cost so that's not a minor thing. Let's get some better data Cost of housing in San Francisco is about 7X that of the US average and California overall is about 3X that of the US average. Median house price in California is around $500K and in the Bay Area it is over a million. Groceries are more expensive on average in CA, albeit modestly so. Gas and transportation in CA are 40-70% more expensive. Gas prices in the Bay area as I type this are around $3.40/gal versus around $2.10/gal in the midwest. That is ~60% more expensive for those counting at home.
So the tl;dr version is that CA has substantially and provably more expensive cost of living than most of the country. Not saying that is a good or bad thing, but it is a fact. If Silicon Valley or Manhattan is where you need to be to get where you want to go then do what you need to do. But there is a price tag attached to that.
When I moved to Silicon Valley, I lived in my van for two years.
I'm going to stop you right there. Obviously you didn't have a wife, children, and were young enough to find that a palatable option. (or if you had any of the above you had a VERY unusual wife) That sort of thing is fine when you are young, single, and have limited responsibilities and social obligations outside of work. If you are all about the job and in a position to do that then good on you but few people can or will live that sort of lifestyle and expecting others to do it is unrealistic.
Then I got a private office, and slept on a roll-up mat.
Yeah there are damn few employers who would be ok with you sleeping in the office. Maybe that sort of thing is normal at some companies where you are but that is not normal in general. Certainly not outside silicon valley.
-
Re:Bullshit
That's funny . . . looks like they're expanding 19 existing sites
No, Macron wants to do that. The report I quoted was the people doing the math and showing his plan isn't economically viable. Which is why his plan hasn't gone anywhere.
These hopeful projections -- backed by no real data, I might add
Except the historical trend of pricing......
In that amount of time we will certainly have entirely new ways of working with nuclear energy too
You guys made this promise when pebble beds were all the rage and totally going to change everything. How'd that turn out? Oh wait...not so well. And that
There is no time in recorded history that human energy consumption has ever dropped -- ever
You have somewhat of a point about waste, which is not nil -- but it would be vastly improved over today's situation, and I trust people like the French to come up with real-world solutions, as they have for many decades now.
....except for coming up with a solution for waste for decades now.
-
Re:Per capita
Here's the CO2 numbers for US, EU, and China, as of 2017: https://www.forbes.com/sites/r...
Over the past decade, the US and EU reduced their footprint. Meanwhile, China tripled theirs, and now emits more carbon dioxide than the U.S. and EU combined.
According to eia.gov https://www.eia.gov/todayinene... "Coal accounts for most of China's energy consumption, and coal has maintained an approximate 70% share of Chinese consumption (on a Btu basis) since at least 1980, the starting date for EIA's global coal data. By way of comparison, coal was 18% of U.S. energy use and 28% of global energy use in 2012."
-
Load factors
They were less than 10% in 2016, I don't think we've more than tripled our generation in California. And yes, I live in California. For the US, it's closer to 5%, not 18%.
The GP and you are confusing two different numbers. The GP is talking about total deployment. You are taking about how much power was actually produced. Which illustrates a great point. A 200MW wind farm doesn't equal a 200MW reactor. Solar and wind load factors are in the single digit percents. Nuclear's is north of 90%. So our 5% deployed nuclear generates 9% of our energy, but 18% of deployed renewables generates 5% of the power. Either way the real problem is the batteries needed to handle renewable deployments of more than about 20% energy generation. Without those batteries, its nuclear or natural gas.
Load factors for Wind, Solar and Hydro in the UK in 2017 according to the Digest of UK Energy Statistics published by the Department of Business, Energy and Industrial Strategy:
Onshore wind: 28.0%
Solar photovoltaics: 10.7%
Offshore wind: 38.9%
Hydro: 36.5%
The load factor for UK nuclear plants hovered betweeen 65 and 77% and onshore wind in particular beats UK Nuclear on energy prices quite handily, onshore wind even managed to beat Combined Cycle Gas Turbines.
Now please start talking about 'breeder reactors' I have some choice quotes from the US navy and some scientific publications on those things. -
Re:good
They were less than 10% in 2016, I don't think we've more than tripled our generation in California. And yes, I live in California. For the US, it's closer to 5%, not 18%.
The GP and you are confusing two different numbers. The GP is talking about total deployment. You are taking about how much power was actually produced. Which illustrates a great point. A 200MW wind farm doesn't equal a 200MW reactor. Solar and wind load factors are in the single digit percents. Nuclear's is north of 90%. So our 5% deployed nuclear generates 9% of our energy, but 18% of deployed renewables generates 5% of the power. Either way the real problem is the batteries needed to handle renewable deployments of more than about 20% energy generation. Without those batteries, its nuclear or natural gas.
-
Re:good
They were less than 10% in 2016, I don't think we've more than tripled our generation in California. And yes, I live in California. For the US, it's closer to 5%, not 18%.
-
Re:good
They were less than 10% in 2016, I don't think we've more than tripled our generation in California. And yes, I live in California. For the US, it's closer to 5%, not 18%.
-
Re:Cool. Runs on coal.
I don't know the specifics of it, but, it's certainly possible for two fuels to have differing amounts of energy produced versus CO2 released.
https://www.eia.gov/tools/faqs...
So, yes, at least according to EIA.gov, natural gas IS "cleaner" than Coal. Not even getting into side-products released when burning coal.
-
good, they can import more energy than
https://www.eia.gov/todayinene...
You do notice that this is from the U.S. goverment. Unbiased enough for you?
n 2016, the California grid region, which covers most of the state and a small portion of Nevada, imported a net daily average of 201 million kilowatthours (kWh) throughout the year from other western regions, or about 26% of its average daily demand. Those imports were supplied by the other two regions that make up the Western Interconnect (WECC). The Northwest region of WECC, which includes most of Colorado, Idaho, Nevada, Montana, Oregon, Utah, Wyoming, Washington, and a small area of northern California, supplied a daily average of 122 million kWh. The bulk of the remaining imports to the California region, 68 million kWh per day on average, came from the Southwest region of WECC, which includes much of Arizona, New Mexico, and small portions of Nevada and Texas.
I'm only posting this link because it is from the California Goverment, and it provides a break down of how the energy they produce is broken down. Good information.
https://www.energy.ca.gov/alma... -
Re: I thought Obama fixed climate change though
62 percent of electricity is still being produced by fossil fuels. And hydro produces more renewable electricity then Solar.
https://www.eia.gov/tools/faqs... -
Re:Cutting Emissions
Are there still people here who believe in this "long tailpipe" nonsense?
Start reading. Or, if you just want a cheat sheet for the US: here and here.
Here's where the US grid has been heading. Here's where it's going. So note that using, say, 2012 data above actually downplays the improvements of EVs vs. ICEs. Same story with the energy used in battery manufacture (which has been falling in almost direct correspondence to battery prices)
If I was wrong in my assumption that you're an American (most people who ask this question turn out to be), let me know where you're from and I'll give you data appropriate to your location. For example, major EU countries.
-
Re:So?
We need to assign about 89% of all externalities for fossil fuels to renewables. Why? Renewables are about 11% of our total energy supply, meaning that without the other 89% of non-renewable energy we couldn't do ANY renewables. We wouldn't have any reasonable society if our power consumption was cut by 90%. It is fossil fuels that allow us to play with renewables. They provide the foundation and framing for renewables - and renewables require that support to even be just 10% viable. So why not assign nearly the same level of externalities to renewables - since they couldn't even exist without that support?
-
Re:So?
First off, they are not subsidies - they are deductible expenses. Much like salaries, leases, and IT costs are deductible by all businesses. That comes from gross revenues, and as these are business expenses related to running the business, they are deductible against your taxable income (you spend the money, but you're not taxed on that money).
Secondly, all these deductions have direct analogies in other industries, they just may have different names (exploration and development is basic R&D, for example).
Now, if you want to talk subsidies, ask the EIA. You'll see that rather than subsidies, fossil fuels receive basically zero dollars (between coal and natural gas). Biofuels, solar, and wind get about $5.2 billion. Far from fossil fuels being subsidies, the Federal Government dumps billions in that "cheaper renewable" power and gives zero to fossil fuels.
-
Re: Good
A free market for energy does not exist. OPEC is a cartel of countries that set production levels to manipulate oil prices and control the supply.
OPEC is a cartel. But the market is less distorted than you think, at least in the US.
The US consumes about 20 million barrels/day of oil (source). Net imports are 5 million. 1/3 of imports come from OPEC countries. So OPEC is not able to exert monopolistic power.
Today's price for OPEC crude is $58.33. West Texas crude is at $53.37. Suffice it to say, any oil user in the US that has access to WTI crude is getting it. Imported crude users are likely refineries that do not have pipeline access to the domestic supply.
Once US oil exports ramp up, things might change, but for now, OPEC's price-setting ability is pretty subdued in the US.
Energy is a global market and the prices are global. Different regions have different prices because the oil is different.
https://www.investopedia.com/a...OPEC's power is way down because they no longer control so much of the supply. The low cost of fracking has wrecked their market.
The US is now a major oil and gas producer, is still sitting on hundreds of years of coal, and has a growing renewable sector.
It's a huge diversity of supply. Maybe not complete energy independence yet, but getting there. -
Re: Good
A free market for energy does not exist. OPEC is a cartel of countries that set production levels to manipulate oil prices and control the supply.
OPEC is a cartel. But the market is less distorted than you think, at least in the US.
The US consumes about 20 million barrels/day of oil (source). Net imports are 5 million. 1/3 of imports come from OPEC countries. So OPEC is not able to exert monopolistic power.
Today's price for OPEC crude is $58.33. West Texas crude is at $53.37. Suffice it to say, any oil user in the US that has access to WTI crude is getting it. Imported crude users are likely refineries that do not have pipeline access to the domestic supply.
Once US oil exports ramp up, things might change, but for now, OPEC's price-setting ability is pretty subdued in the US.
-
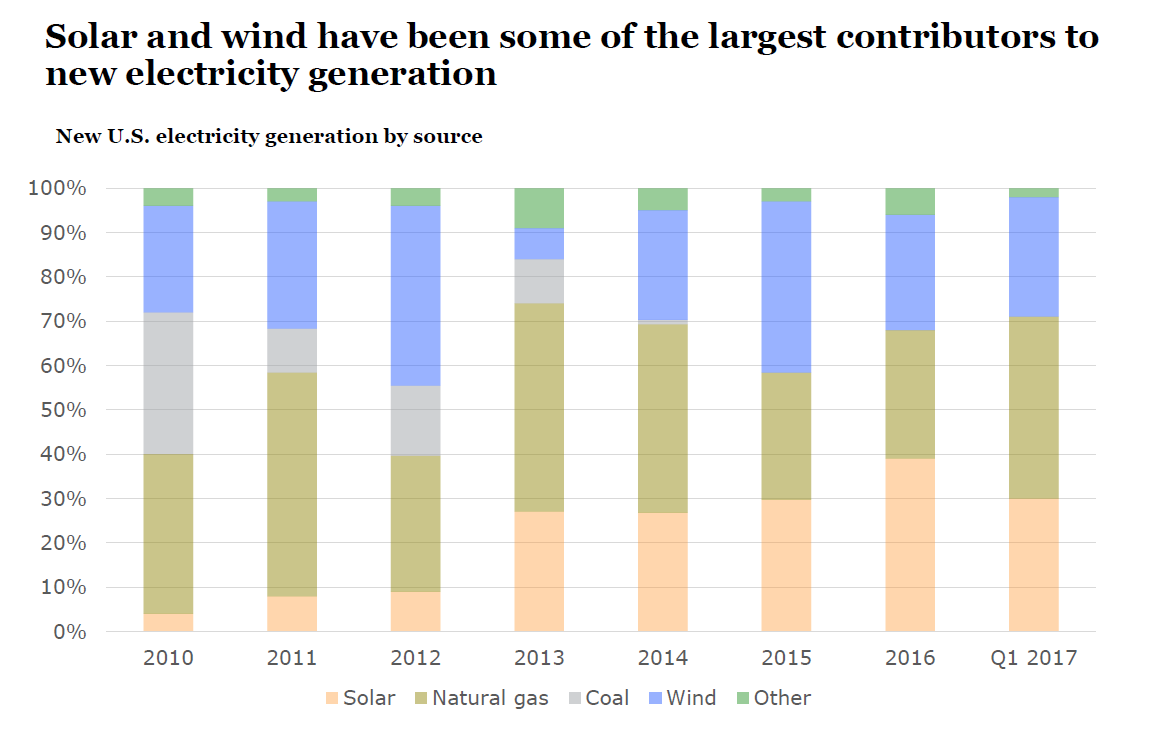
Misleading: coal being killed by natural gasThe summary is a little misleading. A portion of the competition for coal is indeed the "falling cost of renewables", but that ignores the other competition that's the main reason coal is not profitable: the low cost of natural gas, and the low cost of building turbines that produce electrical power with natural gas.
Natural gas power plants also spin up and spin down more quickly than old coal plants, allowing them to track the short-term changes in the demand curve better.
Here's a graph. Notice that the drop in coal is mirrored by a rise in gas. https://www.eia.gov/energyexpl...
-
Re:What is interesting ...
The US doesn't care either. US carbon emissions have been dropping for the last ten years, but the initial drop corresponded to the Great Recession, not any kind of public policy.
Later on those reduction continued because of the (then unpopular) fracking friendly policies of the previous administration. This was arguably more from concern over US energy independence than climate change. They also were keen for the US to become a gas exporter to blunt potential Russian influence in Europe.
The slight reduction in US CO2 output in 2017 was almost entirely due to the ongoing shift of electricity generation away from coal to natural gas. This represents a one-time shift from one carbon emitting fuel to another, significantly less carbon-emitting fuel. Once coal becomes economically extinct, US greenhouse emissions will resume growth as US economic output grows, absent any new public policies to promote conservation and/or renewable energy.
Note that EU carbon emissions per unit of GDP have actually fallen. However they don't have any vast untapped reserves of natural gas to produce the kind of easy short term reductions the US has; Germany in particular is dependent on coal. A switch to Russian natural gas would pull them inextricably into Russia's sphere of influence. Note that the other place Europe could turn for natural gas is Iran, however the US is insisting Europe reimpose sanctions on Iran.
-
Re:Too little, too late
Here's something you could educate us both on, how much would this algae based fuel cost?
Why don't you google it?https://www.google.co.th/searc...
1.7 million hits
https://www.sciencedirect.com/... an easy read, you can even download the PDF.
And as you are so fond of youtube videos: https://www.youtube.com/watch?...
Or if you like a more official one: https://www.energy.gov/eere/bi...So, your defense is your ignorance?
Ignorance about what? If you disagree with me or I say something wrong: it is not a lie. Period. The previous discussion is/was not about anything where anyone could be proven wronghttps://www.eia.gov/tools/faqs... 391.71 million gallons (or about 9.33 million barrels per day).
Energy per gallon: 370kWh
-
Re:stop hiding behind percentages
Actually, he wasn't far off (the correct figure is 37.1%). https://www.eia.gov/tools/faqs...
-
Re:False dichotomy
Over 1/4 of total household power use in AZ is Airconditioning, during the day that is obviously most of the household use. Guess what is not needed after a tropical storm with cloud cover? It also helps the wind and hydro power will then be driven up to take over any excess. Also cloud cover doesn't end solar, still get 25% of the capacity, so when daytime demand is cut in half you will still have 1/4 of the solar power, so not that much makeup would be needed if PV was providing half the power, all is still good.
-
Re:Legacy car maker vs Cell phone makers.
We have the grid capacity to charge even if ALL the cars become electric tomorrow.
Citation required.
He showed his work. Here's (some of) the basis for the 33% number. The link is for New England only, in 2011, but the numbers only look better for the rest of the country which uses more peak power for air conditioning than New England does, not less.
The numbers are actually getting dramatically better for available daytime capacity thanks to the ongoing installation of solar panels. The grid is so overpowered now that in two regions (California and New England), wholesale electricity prices go negative during the day. -$2.65 in the cited article is a vast oversupply. It is not a daily occurrence. Yet. It will become one, and sooner than you'd think. Seven years ago, it never happened in New England. Now it does occasionally. As time goes by, and solar installations continue, it will become more and more frequent.
Considering the grid is already heavily oversupplied today, during the day, in some parts of the country, the idea that if all cars magically become electric overnight and could still be recharged is not very farfetched. It was possible with only night time oversupply. Now that there is also daytime oversupply, it's down right easy.
-
Re:Solar jobs 260k, coal 77k
Solar long surpassed coal for jobs. By 2017 its more than 3 times the number of jobs: http://fortune.com/2017/02/07/...
Coal generates ~30 times more power than solar, meaning it takes about 90 people in solar to produce the same unit of energy as in coal.
-
Re:Too late
The US spends about $700 billion a year on defense. Clearly not all of that is spent on oil and the Middle East, but let's say it is. The EU gets about 20% of its petroleum from the Middle East, and the US gets about 16% from the Middle East. Assuming that oil runs about 30% of the economy of a region (transport, pharma, power, manufacturing, plastics, etc) that means about $7 trillion in annual economic activity is dependent upon the US military in the Middle East. And assuming that all US military spending is in the Middle East, that would be about a 10X return.
Now, we could always slash all our involvement in the Middle East, and turn off the spigots. The US currently has a net import of oil around 30% of its consumption (we do produce a massive amount domestically), and most of our imports are from Canada and Mexico. The EU has a net import of oil around 85% of its consumption - meaning it would have essentially no way of replacing oil (at least for now). So, ultimately, we're spending those hundreds of billions of dollars to protect and ensure the delivery of power predominantly for our allies in the EU. And that's generating around 10-15X returns in terms of economic activity. Is that worth the cost?
-
Coal will probably have a long life
Coal is used for many reasons. Look at Germany: it is turning to coal from nuclear. Do you think this report is going to have Germany do an about-face on closing its nuclear plants by 2022? I don't. For some countries, coal is a secure source of power. They do have coal and they do not have natural gas, for example. The technology for obtaining coal is low and practical for many developing and undeveloped countries. Non-hydro renewables and nuclear are not. Also, non-hydro renewables are not 24/7 power, and the grid needs that.
Coal is estimated by the International Energy Agency to shrink 0.1% a year through 2050. So yeah, it is trending down, but not by an amount that means anything. https://www.eia.gov/outlooks/a...
-
Re:This is why we have to stop using fossil fuels
I don't doubt the methodology could be refined further. I'm assuming your assertions are based on more comprehensive studies, rather than just personal assumptions - care to cite one?
As an example, it's true that some states produce emissions from power generation, exporting energy to states which consume it, and shifting the CO2 load. But California has the fourth-lowest energy consumption per capita, so they're efficient with their consumption. Yet they rank among the highest GDP per capita, so their production is also efficient. Still sounds relatively green to me.
-
Re:How's that work
That's cost per kW of capacity. Nuclear typically has a capacity factor of 90% - over a year it will produce about 90% of its max capacity. Gas and coal have capacity factors closer to 50%. (gas is typically used for peaking load, since it can scale up and down quickly; it's not run full throttle 24/7). So the $1800 per kW of capacity for gas is closer to $3600 per kW of actual production. Meaning NuScale's $4200/kW is pretty damn close.
It's the same reason why wind and solar appear to do so well by this metric. Onshore wind has a capacity factor of about 22%, solar about 15%. So if you normalize the metric to kW of production (rather than capacity), you end up with wind at about $7500/kW, and PV solar at about $12,300/kW. (PV solar with tracking can approach 30%, which would put it at about $7000/kW.) -
Re:SMR
Is it cheaper? Correct me if I miscalculated but...
This says that facility has 129 MW-h storage and cost between 50 an 200 million:
https://greycellsenergy.com/ex...
The US produced 4,015 Billion kWh in 2017:
https://www.eia.gov/tools/faqs...
Divide by 365 and get 11 Billion kW-h (for just 24 hours backup) or 11 Million MW-h
11,000,000 / 129 is about 85000
85000 * 50 million = 4,263,000,000,000
So 4.3 trillion dollars in batteries -
Daytime demand is 50% higher than night time
Here's a typical hourly demand curve:
https://www.eia.gov/todayinene...Not surprisingly, demand rises about 7AM and begins to fall around 8PM.
Coincidentally, the sun rises around 7AM and sets around 8PM.
So on clear sunny days, solar power becomes available right about when load increases and you need more power.
(Of course full output only occurs for a few hours per day, there isn't much solar available for a couple hours after sunrise and a couple hours before sunset).The minimum, night time load in this example is about 10GW and the peak is about 15GW. So you run your nuclear at 10GW and during the day for the extra 5GW you use solar or wind if it's available at the moment, natural gas to the extent you need it.
Nuclear provides your steady 10GW you need all the time, solar can provide some of the additional 5 GW you need during the day - which conveniently is when the sun is up and solar may be available.
-
Yes, I did say base but didn't specify peaking
I pretty much agree with almost everything you said.
You may have noticed I said nuclear for *base load*.Here's a typical hourly demand curve:
https://www.eia.gov/todayinene...Not surprisingly, demand rises about 7AM and begins to fall around 8PM.
Coincidentally, the sun rises around 7AM and sets around 8PM.
So on clear sunny days, solar power becomes available right about when load increases and you need more power.
(Of course full output only occurs for a few hours per day, there isn't much solar available for a couple hours after sunrise and a couple hours before sunset).The minimum, night time load in this example is about 10GW and the peak is about 15GW. So you run your nuclear at 10GW and during the day for the extra 5GW you use solar or wind if it's available at the moment, natural gas to the extent you need it.
-
Global spending by every oil company and govt
> But you shouldn't use fallacious arguments against solar out of your support for nuclear. It's possible (and logical) to support both.
I said we should use both. When the weather cooperates, make use of it.
> It looks like we spend about $250B / yr on energy infrastructure.
Yes, total global investment by all of the world's oil companies, governments, etc is about $250 billion. Which you then divided into *federal tax dollars* spent on solar in the US alone. Apples divided by oranges equals fruit salad. Speaking of specious arguments.
Btw 3% is probably significantly overstating it.
Here the Energy Information Administration reports 0.4%.
https://www.eia.gov/totalenerg...Estimates vary to as high as 3% of energy production, so I was being generous to solar.
-
Stop lying WindBourne When will you learn?
I've showed you numerous times Windy. here here and here at least 3 times just recently and many more previously. Don't pretend you don't know you are being dishonest.
Each time the discussion was about coal used for eletricity.
Even now everyone has been talking about electricity and you throw in a number (with a paywalled link, step up from no link at all I guess) that is including industrial coal use as well. Then claiming people are lying. (quite deceitful of you)
Strange that you would claim for the last 10 years. When even your own data shows 10 years ago in 2008 America consumed 535.9 and China consumed 1609.3
It's obvious even using total coal and not just electricity, per person America is way way higher. You can find the year it crossed over if you like. But why did you have to lie about it in the first place?So you move the goalposts, claim falsely that other people are lying, and then with your moved goalposts you still have to lie anyway to make it seem even worse. You just can't help yourself.
China consumes over 1/2 of the consumed coal on this PLANET EACH YEAR for the last 10 years.
And then there is this blatant lie. You can clearly see the red line is under the black one. Why lie all the time?
-
Neighboring states are having a good laugh
https://www.eia.gov/todayinene...
Seeing as they are already importing a quarter of their electricity.
Look on the bright side all you people that want solar, will finally have it. It will be the only power anyone can actually afford in California. Of course anyone that actually needs reliable power at reasonable prices is going to be out of there.
.png)