 Slashdot Mirror
Domain: noaa.gov
Stories and comments across the archive that link to noaa.gov.
Comments · 2,602
-
The inverse geodetic problem
What you're solving is the inverse geodetic problem, a topic of study in the field of geodesy for centuries, literally. http://en.wikipedia.org/wiki/Geodesy#Second_.28inverse.29_geodetic_problem As several people have commented earlier, you need to be sure whether this is a new algorithm, a modification of earlier algorithms, or just an optimization. You can research this yourself, and I assume you already have. Possible sources include the National Geodetic Survey, http://www.ngs.noaa.gov/TOOLS/, National Geospatial Intelligence Agency https://www1.nga.mil/ProductsServices/GeodesyGeophysics/Pages/default.aspx You would want to submit a paper to conferences in geodesy or surveying. Possibilities include the American congress on Surveying and Mapping http://www.acsm.net/ Intl Assoc of Geodesy http://www.iag-aig.org/index.php . This would be an easy way to determine how revolutionary your algorithm is. These organizations also publish journals, so a conference paper could be a first step.
-
640 kbytes
http://www.fas.harvard.edu/~epsas/dynamics/vortex/structure.pdf
http://arxiv.org/pdf/physics/0404004
http://www.peter-thomson.co.uk/tornado/A_self_organised_structure_for_the_tornado.html
http://ams.confex.com/ams/pdfpapers/21580.pdf
http://www.britannica.com/EBchecked/topic-art/594363/19397/Tornadic-thunderstorm-The-rotating-updraft-that-produces-the-tornado-extends
http://www.spc.noaa.gov/publications/edwards/hcr3may.htmThanks! I never thought of googling it!
Now why didn't Galileo just read the documentation Aristotle had written on gravitation? He could have avoided some nasty arguments with the pope! Or why didn't Einstein read what Lorenz had written on relativity? Or why did Schockley, Bardeen, and Brattain invent the transistor? Vacuum tubes were extremely well documented in 1947. I could go on all night.
Sigh. I guess 640 kbytes will always be enough for somebody...
-
Re:Big fucking deal.
Is google down in your area:
http://www.fas.harvard.edu/~epsas/dynamics/vortex/structure.pdf
http://arxiv.org/pdf/physics/0404004
http://www.peter-thomson.co.uk/tornado/A_self_organised_structure_for_the_tornado.html
http://ams.confex.com/ams/pdfpapers/21580.pdf
http://www.britannica.com/EBchecked/topic-art/594363/19397/Tornadic-thunderstorm-The-rotating-updraft-that-produces-the-tornado-extends
http://www.spc.noaa.gov/publications/edwards/hcr3may.htm -
Re:Big fucking deal.
The structure of tornado is already well documented.
The winds near the ground are already well documented.Oh, thank God for that!
Can you please provide links for that documentation? The cost savings will be staggering when those stupid scientists realize they can stop this useless weather research!
-
Re:Storm chasers spot tornadoes.
You would think, but that storm spotting requires professionals. Check out our local SKYWARN group.
-
Re:Cloud Seeding
Nonetheless, if you randomly assign 100 clouds to one group and the other 100 to another group, then add up the precipitation totals of the two groups, the totals should be approximately equal.
I think his whole point is that there is so much variability from one cloud to any other cloud that your statement is basically worthless because 100 clouds is nowhere near a large enough number to make an assumption on how much rain they’ll produce. It might take tens of thousands, millions even, in order to safely assume that the variability had been eliminated... and you might have to take them from widely different climates and altitudes or you’d never get an accurate prediction.
For instance, here is a chart showing the annual precipitation measured in various locations throughout Arizona. Now I have no idea how that even relates to the number of clouds actually passing over the rain gauge, per year; that number might also vary wildly from one year to the next. Take the annual rainfall, divided by the number of clouds that generated it... that will also vary wildly year-to-year. In other words, you could probably sample clouds for a whole year and still not have counted enough clouds for your rainfall prediction to be as accurate as you’d need it to be.
-
Re:Volume
0.5 PPM is the MAXIMUM concentration found, not the minimum.
The actual report shows average analysis results about 0.2 ppb.
That would mean about 1000 barrels spread out over 1000's of cubic miles.
Here is the link to the original NOAA report.
http://www.noaanews.noaa.gov/stories2010/PDFs/noaa_weatherbird_analysis.pdf
The press is totally misrepresenting the results of this report.
-
Re:Effects on the weather
Although yes, the Sun's becoming more active there's been a lot of discussion as to whether the low solar activity was responsible for the coldest winter in 17 years in England (and longer than that in Scotland).
Doubtful, given that:
For the year-to-date, the global combined land and ocean surface temperature of 13.3C (56.0F) was the warmest January-April period. This value is 0.69C (1.24F) above the 20th century average.
Furthermore:
The decade of the 2000s (2000-2009) was warmer than the decade spanning the 1990s (1990-1999), which in turn was warmer than the 1980s (1980-1989). More complete data for the remainder of the year 2009 will be analysed at the beginning of 2010 to update the current assessment.
Citation. Which, of course, makes the idea of solar drive GW look pretty silly, what with the solar minimum during this decade.
So, alas, apparently I *once again* need to point out: Local temperature != global temperature. Seriously, people, how many times does this have to be repeated before you start to actually get it?
-
A reliable flow rate is important if you want...
A reliable flow rate is important if you want to try to understand how a leak of as much as 100,000 barrels/day during a time when we are supposedly retrieving "only" 1,734,000 barrels per day in total from the Gulf is related to declining oil prices.
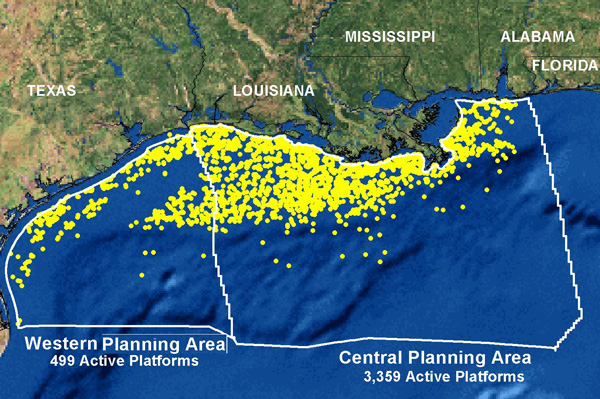
Put another way: "Gee...how come just one leak is equal to 1/18th of the total amount of oil that is supposedly being pumped out of the Gulf of Mexico? When there are "nearly 4,000 active oil and gas platforms" in the Gulf of Mexico?"
-
Re:Experts
The Watts research is case in point. He went out and did legwork that everyone else was ignoring. Unless you're actually claiming it's better off not knowing the quality of surface stations, he made a contribution. But the papers you reference, and your own statements on here, show your amazing reluctance to ever grant a single scrap of credit to the guy.
Yet again, it's the "everyone else was ignoring" clause that I'm disagreeing with. Watts isn't the first person to repeatedly survey stations in person, as riverat1 and I have been saying over and over. Notice that the emphasis is on correcting for undocumented changes. That is, scientists long since recognized that even their labor-intensive survey efforts would miss changes to the site quality, so the last decade has seen additional steps above and beyond repeated surveys. Watts isn't the first person to examine stations in person, he's just the first person to become an internet celebrity by claiming he is.
Climate science is closer in practice to economics than any other field. So either economics is a science, or climate science isn't, or you have to put some sort of nebulous grey area together for fields that make observations and construct hypothesis for predictions, but can't run controlled experiments and have problems with falsifiability.
Radtea made a similar argument, which I've already pointed out is ridiculous.
To use your own words, it's like a modified Salem Hypothesis that lets non-physicists like climate scientists think that their hand-waving is a legitimate form of argumentation, whereas everyone else is an anti-scientific nutjob. It probably comes from their field being only tenuously considered a science. Yes, yes, I've read http://www.realclimate.org/index.php/archives/2005/01/is-climate-modelling-science/, and as someone who as actually studied the philosophy of science, in graduate school... RC.org is wrong, again.
You're not the first "graduate student of the philosophy of science" to say these things. And it's really odd to see you label me a non-physicist. My physics B.S. is in physics, with a research emphasis on experimental optics. I went to graduate school planning to focus on quantum teleportation (that presentation and review paper was part of my physics M.S. defense). It's only in the last 4 years that I switched from optics to studying Earth's time-variable gravity field using GRACE k-band satellite ranging measurements (which got me interested in the physics of the climate). I realize that you think that "I don't fucking know what I'm talking about" but I'm curious as to what you think qualifies someone to be a physicist?
You're not familiar with the Gettier paradox then. I'm tempted here to just quote a bunch of papers on it to show you why you're wrong, without ever saying why, just to show you why your method of argumentation is so poor. But I'll just leave it up to you to research it and figure out for yourself why this claim is fallacious.
Again, you're not the first person to change the topic from "how many independent empirical data sources have been shown to be consistent with dynamical climate model ensembles" to something like "Is justified true belie
-
Re:Experts
Ok great. But his politics don't matter, unless he's lying about the surface station data. Are you saying his surface station data is wrong? That's the only thing that matters. I haven't seen anything that says it is, but I could be wrong. In regards to the verification, what I mean is that the fact that his good stations agree with the national average shows his selection process is probably a good one, since it matches satellite temps.
What surface station data? Anthony Watts has a blog filled with photos and a history of failed journal submissions. I'm not disputing his politics. I'm saying that he clearly implied that the "best" 10% of stations would show global cooling (or stagnation) whereas the "bad" 90% of stations contaminated by the UHI would show an even bigger increase. When someone actually checked this, it turns out he was wrong. Seriously, read Menne et al 2010, linked previously but I'll give it one more shot. Scientists hadn't ignored any of the issues Watts implies. They'd actually checked the time series in quite a few interesting ways. Watts simply didn't do a thorough literature search before making his wacky claims.
I'm not an AGW denier. By no means am I claiming that. I only take exception when people overstate a threat, or ascribe global warming to whatever news item of the week it is. Back when I was living in SF, pretty much everything was ascribed to global warming on the local news.
I've made a list of all the nonsense I'd seen from the Greens. What utter rubbish. I've still got things to add to that list, too, I just can't divert time away from school...
In terms of the error bars, I just find it amusing that they're so large you can basically never prove the predictions wrong. Being off by 30-50% over twenty years, for example, is considered acceptable. My own personal prediction is that by 2100, the temperature of the earth will be somewhere between the surface temperature of the sun, and absolute zero. Even though I'm confident this will play out, I'm still waiting to pick up my Nobel Prize, unfortunately.
They're smaller than the error bars you can get using the most sophisticated approach that can be solved using a paper and pencil. Decreasing the error bars further will require better understanding of cloud formation and aerosol interactions, faster computers, raw data at higher spatial and temporal densities, and a better theoretical understanding of the turbulence that is currently extremely difficult to model such as the oscillations ENSO, AO, AAO, NAO, PNA, AMO, PDO, MJO, etc.
Radtea already asked what would be necessary to convince me that our emissions aren't responsible for at least the majority of the warming since ~1970, as measured using 20 year smoothing to account for our current limitations.
-
Re:Isn't water vapor...
Unfortunately, most of the excess carbon dioxide that doesn't remain in the atmosphere seems to result in ocean acidification.
-
Re:When industry polices itself...
The problem is we need oil and we need those companies to drill for it. Given that there are about 4000 oil rigs in the gulf, it is unrealistic to expect 0 accidents forever. When you say the government needs to step in and make industry take actions you are almost always on a very slippery surface. The devil is in the details. Can the accidents still happen even if those regulations are followed exactly? Unless those regulations require miracles then the answer is probably, and they just allow the industry to say "Hew, it's not our fault, we followed the government's safety rules exactly". Much better to require as we do now for the companies that own that oil to pay for the cleanup. What is needed is full enforcement of that, but my prediction is that after years of wrangling and lawsuits, BP will really only pay a fraction of the true cost.
-
Re:Scary MWP
But if climate is really as unstable as a global MWP would indicate, then all bets are off, and perturbation of climate is far more dangerous than climate scientists currently believe.
The planet seems to have a temperature range that acts as a strange attractor,
The global-average lower tropospheric temperature continues warm: +0.50 deg. C for April, 2010, although it is 0.15 deg. C cooler than last month. The linear trend since 1979 is now +0.14 deg. C per decade. APRIL 2010 UAH Global Temperature Update: +0.50 deg. C
The MWP wasn't much when viewed in perspective of many cycles on different periods that sometime interfere constructively or destructively with each other; even today the warming that caused all of the concern is reversing. Heading into a cool period lasting for 30 years or so wouldn't surprise me, Ocean energy is down, no reason to get stupid on either side of the debate, the data just doesn't support a catastrophe right now.
-
Re:Integrety
You work with what you have. The temperature records they are working with have been collected over the past 150 years or so by hundreds of different entities around the world without any consideration of some of the things they're being used for now. It'd be great if we could go back and redo the observations but we can't. Of course the more recent the observations the better confidence we have in them especially since the 1950s.
Lots of raw data is available at the National Climate Data Center. Interestingly processing that raw data without making adjustments for the vagaries of the data collection process produces substantially the same answer as the processed data does.
-
Re:No mention
The planet is warming due to the sun.
Nope. We are actually in a solar cooling phase, which is masking somewhat the increase due to CO2 emissions. Unfortunately, the solar cooling trend will eventually reverse, and we'll then have solar heating on top of CO2-mediated warming
The impact the rest of nature has astronomically outstrips the impact humans alone have.
Technically correct. The planet is estimated to be about 30 degrees C warmer than it would be if there were no natural CO2. The anticipated temperature increase due to man's emissions of CO2 is only a fraction of that, but still enough to be a serious problem.
These changes are only "unprecedented" if you describe "modern times" as spanning only the last few centuries. The planet has undergone more severe changes than any doomsayer has predicted - life, including human life, has done nothing but flourish.
Also correct. Current theory does not predict that global warming will wipe out humanity. But substantial sea level rises and changes in the climate in regions where most of the world's food is grown would be far more disruptive than in the prehistoric world.
-
Re:Sadly...
Nothing you've said here is science: it is economic and political opinion.
I couldn't agree more. We are after all on an internet forum, and I wouldn't expect my comments to have any more weight than anyone else's, and certainly not to be taken as 'science' of some kind. I don't recall every making a claim that they were science though. I'm not aware of any science posted as comments to slashdot.
This is the problem with the AGW debate (one of them, anyway): mixing of hysterical speculation about economics and politics with some reasonably ok science. The science is reasonably ok--just not nearly solid enough to justify the hysterical speculations.
The comment wasn't speculating or hysterical (nice use of emotive language there to try to polarise debate). Sea level rise is an obvious consequence of a warming climate, and one which has seen an awful lot of scientific studies estimating its possible effects. Here's one, as an example:
http://www.pnas.org/content/early/2009/12/04/0907765106.full.pdf
If we have a rapidly warming climate, the changes could be around 1-2m of rise within a century - that is very rapid in geological terms so far as we know. As you can see from this graphic from Nasa, the results would be dramatic -
http://sos.noaa.gov/videos/sea_level4.mov
and incredibly expensive to mitigate, given the amount of land involved. We'd probably end up giving up on huge areas which are currently densely populated.
Of course there have been many climate changes in the past of much greater magnitude, but all of them happened very slowly in comparison, except perhaps those which resulted in mass extinctions like the K-T boundary (hard to say for sure). If this was over 1000 years, it would be easier to work with the changes, but over 100 years, such a change in coastlines would lead to massive upheavals, given that most humans live along coastlines, many in countries without the resources to mount flood defences.
So the question is really has mankind affected the climate recently - given the proven connection between greenhouse gases/particulates from volcanoes and climate, and the huge amounts of particulates and greenhouse gases we have been producing over the last couple of centuries, I'd say the correlation is pretty solid. A lot of real scientists (whose job it is to study these phenomenon) agree. You may not. Regardless, we're going to have to face our dependency on fossil fuels sooner rather than later, so I'm not too worried, but it will be a massive challenge, and we may as well start now.
-
Re:Here is how you do science.
Indeed you do need a wake up from your zombie state, for that is the condition of those who endlessly echo zombie arguments about climate science throughout the blogosphere. A zombie argument is one that endlessly presents an illusion of life no matter how many times it has been shown to be just plain wrong.
Let us start with the availability of raw temperature station data from the CRU. Nearly all of it is and has been for several years freely available from the Global Historical Climatology Network maintained by the National Climate Data Center (US Department of Commerce). Here it is: ftp://ftp.ncdc.noaa.gov/pub/data/ghcn/v2/ Some station data held by the CRU was not made available publicly because it is the intellectual property of some national meteorological services around the world and subject to non disclosure agreements. Moves are afoot to change that situation. Move along - no conspiracy here.
The NCDC station temperature data set is used by NCDC to produce their global temperature record. It is also used by NASA GISS to produce their temperature record. All three of the temperature records - HadCruT (from CRU), NCDC and NASA are all in close agreement. Furthermore the satellite temperature records produced by UAH and RSS from entirely different data and using entirely different methods are also in agreement with the surface temperature record. All of this stuff is freely available (including code). Do we see a pattern here?
Lest the OP still feel deprived of data, the RealClimate web site (run by real climate scientists) provides a handy page of links to freely available data and code: http://www.realclimate.org/index.php/data-sources/
Notably, this page also contains a link to the NOAA Paleoclimate site which make oodles of paleo climate data available including multiple studies and their multiple data sources that broadly support the famous hockey stick.
The reality is that climate science has had excellent public and free access to data (and code) and the situation is improving all the time.
So could we please get on with the science and the enormous tack of implementing solutions rather than dealing with the echoes of zombie arguments that stagger around aimlessly on the Internet.
-
Interesting discussion of what caused this blowoutDespite all the gloom and doom over the environmental ramifications, as an engineer, I'm very interested in the solutions that are being put forward as well as the arm-chair failure analysis that is being done. One forum that has had many people from Oil and Gas backgrounds comment on what may have happened, as well as many links to good resources has been at GCaptain
Enjoy (if you've got the patience to read through 22 pages of comments!)
A couple of highlights -
First radio interview from someone on the rig:
http://www.marklevinshow.com/Article...422&spid=32364For those really interested in this sort of issue, read the document accessible via the following link. There was a near miss when BP was drilling the Thunder Horse well, and this paper documents how it was handled. We're not talking about a bunch of amateurs here, on the BP side or the Transocean side. That's why this incident needs to be understood - it caught a bunch of very good people by surprise:
NOAA Report
Google cacheSecond - OSHA's website has some of the best diagrams:
http://www.osha.gov/SLTC/etools/oilandgas/well_completion/well_completion.html
Third - the specs from this platform/ship:
http://www.deepwater.com/fw/main/Deepwater-Horizon-56C17.html?LayoutID=17 -- check out "Thrusters: 8 x Kamewa rated 7375 hp each, fixed propeller, full 360 deg azimuth"
JGG -
Re:Not quite Florida
Just to clarify, the surface oil area is not anywhere near the size of Florida, according to those NASA images and overflight observations.
Download the KML file yourself. The government is lowballing numbers to prevent mass panic. The size of the spill in the links you have given do not match up with the actual satellite images. The government originally reported 1,000 barrels a day and then skytruth.org challenged that it must be at least 5,000 barrels and the government acknowledged it immediately. Skytruth then revised their number after the spill grew 3 times in size over night and said the number must be 25,000 a day and the government responded by saying there is no way to given an accurate number. Skytruth last reported the spill was larger then the Exxon spill and we have heard nothing since. During that time at least two government memo's where leaked showing the government is hiding the actual amounts from the public. Again, don't take my word on it. Down load the KML file from the NASA site yourself. The Satellite image will pop up in Google earth and you can see that the spill is larger then the size of Florida yourself. Also note that the picture was take on May 1st and the Satellite photos from the 2nd and 3rd are hidden by cloud cover so it must have grown since then
-
Not quite Florida
Just to clarify, the surface oil area is not anywhere near the size of Florida, according to those NASA images and overflight observations.
-
Re:Typical Government Over-Regulation.
How do you even get up in the morning? I guess you must wait until your government tells you it's all safe outside.
Yeah, those are called weather reports. Provided by NOAA, by the way. I check them, as well as anyone else who doesn't want to get soaked on the way to the office.
-
Why So Much Focus on Cows?
Methane is present on our life-bearing planet, manufactured primarily by microbes living in cows, and all of the giant planets in our solar system have methane too, despite their lack of cows.
Why are cows focused on so much when it comes to methane? The only study I can find lists livestock making up only 19% as a source of atmospheric methane. That's little more than our industrial energy sector production and about half as much as our wetlands produce. From NOAA:
Rapidly growing industrialization in Asia and rising wetland emissions in the Arctic and tropics are the most likely causes of the recent methane increase, said scientist Ed Dlugokencky from NOAA's Earth System Research Laboratory.
-
Re:Ultimately
HERE IS YOUR FUCKING RAW DATA (because you are unvilling to search it for yourself -- and call yourself a skeptic...):
ftp://ftp.ncdc.noaa.gov/pub/data/ghcn/v2 [noaa.gov]
ftp://ftp.ncdc.noaa.gov/pub/data/ushcn/v2/monthly/ [noaa.gov]
http://dss.ucar.edu/datasets/ds570.0/ [ucar.edu]
http://www.antarctica.ac.uk/met/READER [antarctica.ac.uk]
http://eca.knmi.nl/ [eca.knmi.nl]
http://www.zamg.ac.at/histalp/content/view/35/1 [zamg.ac.at]
http://daac.gsfc.nasa.gov/atdd [nasa.gov]
http://mirador.gsfc.nasa.gov/cgi-bin/mirador/presentNavigation.pl?tree=project&project=SORCE [nasa.gov]
http://amsu.cira.colostate.edu/ [colostate.edu]
http://www.pol.ac.uk/ntslf/data.html [pol.ac.uk]
http://www.geo.unizh.ch/wgms/dataexp.html [unizh.ch]
http://www.marine.csiro.au/~ttchen/argo/gmap.htm [csiro.au]
http://icoads.noaa.gov/ [noaa.gov] -
Re:Are climate researchers....
YOU IDIOT!
Here you are, PLENTY of RAW datasets:ftp://ftp.ncdc.noaa.gov/pub/data/ghcn/v2
ftp://ftp.ncdc.noaa.gov/pub/data/ushcn/v2/monthly/
http://dss.ucar.edu/datasets/ds570.0/
http://www.antarctica.ac.uk/met/READER
http://eca.knmi.nl/
http://www.zamg.ac.at/histalp/content/view/35/1
http://daac.gsfc.nasa.gov/atdd
http://mirador.gsfc.nasa.gov/cgi-bin/mirador/presentNavigation.pl?tree=project&project=SORCE
http://amsu.cira.colostate.edu/
http://www.pol.ac.uk/ntslf/data.html
http://www.geo.unizh.ch/wgms/dataexp.html
http://www.marine.csiro.au/~ttchen/argo/gmap.htm
http://icoads.noaa.gov/Let me repeat:
YOU IDIOT -
Re:Are climate researchers....
Seriously.
There are about five links to the "raw unaltered data" on this Slashdot comments page alone. Here's another one.
Have fun, its about 6GB of numbers.
Stop spreading this ridiculous story of "the data isn't available"
-
Re:Who exactly is fighting back?
The point is
Citing a statement on the research unit's Web site, CEI blasted the research unit for the "suspicious destruction of its original data." According to CRU's Web site, "Data storage availability in the 1980s meant that we were not able to keep the multiple sources for some sites, only the station series after adjustment for homogeneity issues. We, therefore, do not hold the original raw data but only the value-added (i.e. quality controlled and homogenized) data."
they actually delete their copy of the data, but more embarrassingly they also destroyed the documentation of exactly how the value-added dataset they produced was actually produced.
They can not at this time,- reacquire the original raw data, it's been changed
- re-quality-control the raw data, they're not completely sure how they did it
- re-homogenize the data again they're not completely sure how they did it
and they really need to go back to square 1 and reproduce what they've done; reproducibility is a corner stone of science. It's the Apocalyptic Global Warming crowd that needs to prove that
- The Globe has warmed significantly
- the warming is unprecedented and therefore man-made
- the warming is not do to UHI, Urban Heat Islands, or land use changes
- reducing CO2 to pre-industry revolution levels will return temperatures to pre-industry revolution levels also;
I'm perfectly happy using more accurate satellite data, but that only goes back to 1979 so it can never support or refute AGW historically.
Refuting CEI's claims of data-destruction, Jones said, "We haven't destroyed anything. The data is still there -- you can still get these stations from the [NOAA] National Climatic Data Center."
That's almost right, the data there undergoes continuous quality control, new data is added and old data is revised when they find a problem, (and there are plenty of problem datums in there) so it's not exactly the same. If you want it you can go to NOAA and download the ghcn, Global Historic Climate Network, but be advised it's about a 1.8GB compressed download and decompresses to about 5.8GB of data. On a modern computer, running Linux, some Perl scripts, revision control and a database like postgresql you can do anything the bigboys in climatology can do and from what I've seen do it better. The data itself has a lot of documentation with it, a lot of it is wrong or misleading, if you like challenges, GHCN will do it.
-
Re:Who exactly is fighting back?
Here is the raw data, now will you please stop linking tabloid hit pieces and repeating their propoganda?
Note the raw data in the link has a few minor holes, this is due to the fact some national weather services (eg: France) will only release their data on condition you keep it private. If you intend to perform a reconstruction be aware the raw data is chock full of anaomolies such as undocumented station movements and typos. OTHOH Jones and his unit have spent the last couple of decades ferreting out and documenting these anomolies so you may want to consider using the more complete and more accurate HadCRUT data set or NASA's similarly painstakingly cleaned GISTemp data set.
As you may or may not be aware historical temprature reconstructions are fairly insensitive to the holes and anomolies mentioned above, meaning that the raw data in the link is more than sufficient to reproduce any of the historical temprature reconstructions in the literature. If this is still insuffitient to shake your faith in tabloid journalisim, you could try some of the other raw data and master repositiries. -
Re:Raw data can be useless
If you want ground station air temperature data it's at ftp://ftp.ncdc.noaa.gov/pub/data/ghcn/daily/, what's there is as close to raw primary data as anybody has. Everybody else's products have been "value added" i.e., cooked, homogenized, and adjusted.
-
Conclusions from googling..
From what I can tell via google,
- Ash melts at 1100 degrees, below operating temperature of jet engines, and fuses into the engine
- Windshields can be abraded so badly you cannot see out of them
- Ash is dry and doesn't show up on radar, so new sensors are needed so pilots can discover it
- There are no standards for how much ash is allowed or how to test aircraft against it.
- Possibility that propellor planes and helicopters are saferSo my conclusions for now are:
- Need better rules, and government should pay for the experimentation
- Need better intelligence, so we can be sure a route is safe
- Need to examine flying propellor planes slowly at very low altitudes below the ash
- Nobody has thought about ash bothering ground transportation. Does it?
- Need alternative transportation
o Trains, buses, boats
o Slower aircraft.. hovercraft or balloons? (they still have engines though)
o Need a closed engine design. (chemical or hydrogen powered electric closed engine?)
o This is a common problem, more needs to be done for global transportation security. I even found a volcanic explosion in Japan yesterday at the ash advisory center, though it is not in the news at all.
http://ds.data.jma.go.jp/svd/vaac/data/TextData/20100420_SAKU_0403_Text.htmlLinks:
http://www.pprune.org/rumours-news/412103-ash-clouds-threaten-air-traffic.html
http://www.guardian.co.uk/science/2010/apr/15/volcanic-ash-bad-for-planes
http://www.boards.ie/vbulletin/showthread.php?threadid=2055888944
http://www.ssd.noaa.gov/VAAC/vaac.html -
Re:Raw feeds?
-
Raw feeds?
So I guess the
NASA Aqua
NASA Aura
NASA's Terra
European Space Agency's Envisat
European Space Agency's MetOp
NOAA's GOES: National Oceanic and Atmospheric Administration Geostationary Operational Environmental Satellite
- http://www.goes.noaa.gov/
- http://en.wikipedia.org/wiki/NOAA
- http://en.wikipedia.org/wiki/Geostationary_Operational_Environmental_SatelliteSpace research always pays for itself in the long term. The acronyms in the NOAA GOES got me interested.
-
Re:Could Be Worth Some Money
Part of the meteor trail was captured here by NWS weather radar. The end of this trail might be a good place to start.
-
Geomagnetic data on the storm
NOAA's Space Weather Prediction Center has a bunch of data on the storm, including the estimated 3-hour Planetary Kp-index, and a bunch of other data and alerts.
A readable description of the relationship between geomagnetic events and aurora can be found here.
-
Geomagnetic data on the storm
NOAA's Space Weather Prediction Center has a bunch of data on the storm, including the estimated 3-hour Planetary Kp-index, and a bunch of other data and alerts.
A readable description of the relationship between geomagnetic events and aurora can be found here.
-
Geomagnetic data on the storm
NOAA's Space Weather Prediction Center has a bunch of data on the storm, including the estimated 3-hour Planetary Kp-index, and a bunch of other data and alerts.
A readable description of the relationship between geomagnetic events and aurora can be found here.
-
Geomagnetic data on the storm
NOAA's Space Weather Prediction Center has a bunch of data on the storm, including the estimated 3-hour Planetary Kp-index, and a bunch of other data and alerts.
A readable description of the relationship between geomagnetic events and aurora can be found here.
-
Geomagnetic data on the storm
NOAA's Space Weather Prediction Center has a bunch of data on the storm, including the estimated 3-hour Planetary Kp-index, and a bunch of other data and alerts.
A readable description of the relationship between geomagnetic events and aurora can be found here.
-
Re:Warning, no. Detection, yes
Yes. RADAR is already being used, wonder if a Tsunami already is visible from space: http://www.osd.noaa.gov/ostm/
-
Re:Wave height
They have satellite radar altimetry:
http://en.wikipedia.org/wiki/TOPEX/Poseidon
http://www.noaanews.noaa.gov/stories2005/s2365.htm
For early warning they use undersea pressure sensors:
http://en.wikipedia.org/wiki/Deep-ocean_Assessment_and_Reporting_of_Tsunamis
-
Re:Show me the data
Right. Let's go there shall we?
http://www.ncdc.noaa.gov/paleo/data.html
I grabbed 4 random ice core and tree ring data series, and plotted the raw data in excel, and I see NOTHING.
I submit - 80 years of warming is meaningless static if you're talking about CLIMATE data. 80 years is practically weather, especially if you consider the longer-term Milankovic cycles.
-
Re:Show me the data
"I look in the raw data section and low and behold, there is no raw data linked to for the stratosphere. Damn. Guess I'll have to settle for processed data."
http://hadobs.metoffice.com/hadat/hadat2.html - go crazy.
Etc.
Raw data is easily obtainable. But I'm not going to jump through hoops to find you every single dataset. There are so many datasets that it's impossible to put them on a single page.
Several major datasets are cataloged here:
http://iridl.ldeo.columbia.edu/
http://www.esrl.noaa.gov/psd/data/gridded/Also, learn to read dataset names. 9641C_201003_RAW.MAX contains raw unadjusted monthly data. I.e. they are not adjusted for urbanization effects and broken sensors. Since it's a MONTHLY measurement made of multiple daily measurements, they must be averaged, thus the word 'mean'.
You can ask NOAA for daily datasets for all weather stations, but they are huge and are not necessary for climate projections.
You can grab them directly from here:
ftp://ftp.ncdc.noaa.gov/pub/data/ushcn/v2/monthly/It even has a nice README: ftp://ftp.ncdc.noaa.gov/pub/data/ushcn/v2/monthly/readme.txt
So stop being an idiot and jumping at everything without even trying to assume that not every climate scientist is an idiot.
-
Re:Very Strange
"That meant we had to account for things like planet-shine and Earth albedo in our thermal control designs so that we didn't bake our electronics."
? Several percent of difference is not going to fry your electronics, probably.
"That is, show me a model where I can input a historical data set that terminates in 1900 and have it accurately predict, to a statistically significant degree, most of the climate happenings up through 2000."
http://www.cpc.noaa.gov/products/wesley/reanalysis2/ - you're welcome. Of course, you'll need to provide real data on CO2 concentration. If you predict climate for 20-th century based on 19-th century's CO2 concentration you're going to fail miserably.
-
Re:Um..no
The problem is that it's only the warmest decade if you include adjustments. If you take the USHCN v2 data or GHCN v2 data, and plot adjusted and unadjusted average temps, you can see that their adjustments themselves add warming. The linked graph is for USHCN data. I didn't see a way to add trendlines in google docs, but when i ran it in excel the adjustments had a slope 3 times larger than the raw trend. That's deeply suspicious, as is the relatively smooth graph of adjustments themselves. I added 520 to the adjustments so i could graph them together easier. The numbers are in 10ths of a degree. My personal suspicion is that the method they use to calculate adjustments will magnify any trends present in the existing data.