 Slashdot Mirror
Domain: noaa.gov
Stories and comments across the archive that link to noaa.gov.
Comments · 2,602
-
Re:Fairness
Slight correction to your post, typically speaking only tropical CYCLONES are "hurricanes". tropical storms are essentially a weaker stage in what is considered a "hurricane" with lower wind speed and less defined circulation, although they are still destructive in their own right. Tropical systems aren't classified as a "hurricane" unless the sustained wind speed is >64knots/74mph. Hurricane is just a name (in NA) used for a tropical system once it reaches a certain strength threshold. Its mostly a way to define the intensity of the storm. TC evolution:Tropical disturbance>tropical depression>tropical storm>tropical cyclone(hurricane/typhoon).
Tropical thresholds definitions: http://www.aoml.noaa.gov/hrd/t...
Tropical cyclone definition: http://www.aoml.noaa.gov/hrd/t... & https://oceanservice.noaa.gov/...Its quite common for tropical cyclones to downgrade once they reach land because warm and deep water it what drives them (primarily, there are other significant factors). The rapid change in moisture and temperature from water to land degrades or kills the average storm rapidly, although it will still leave an area of lower pressure with residual thunderstorms and the like.
Posting ac since I'm moding.
Disclaimer: The post is solely meant to be educational. Weatherman awayyyyy
-
Re:First sentence is absurd
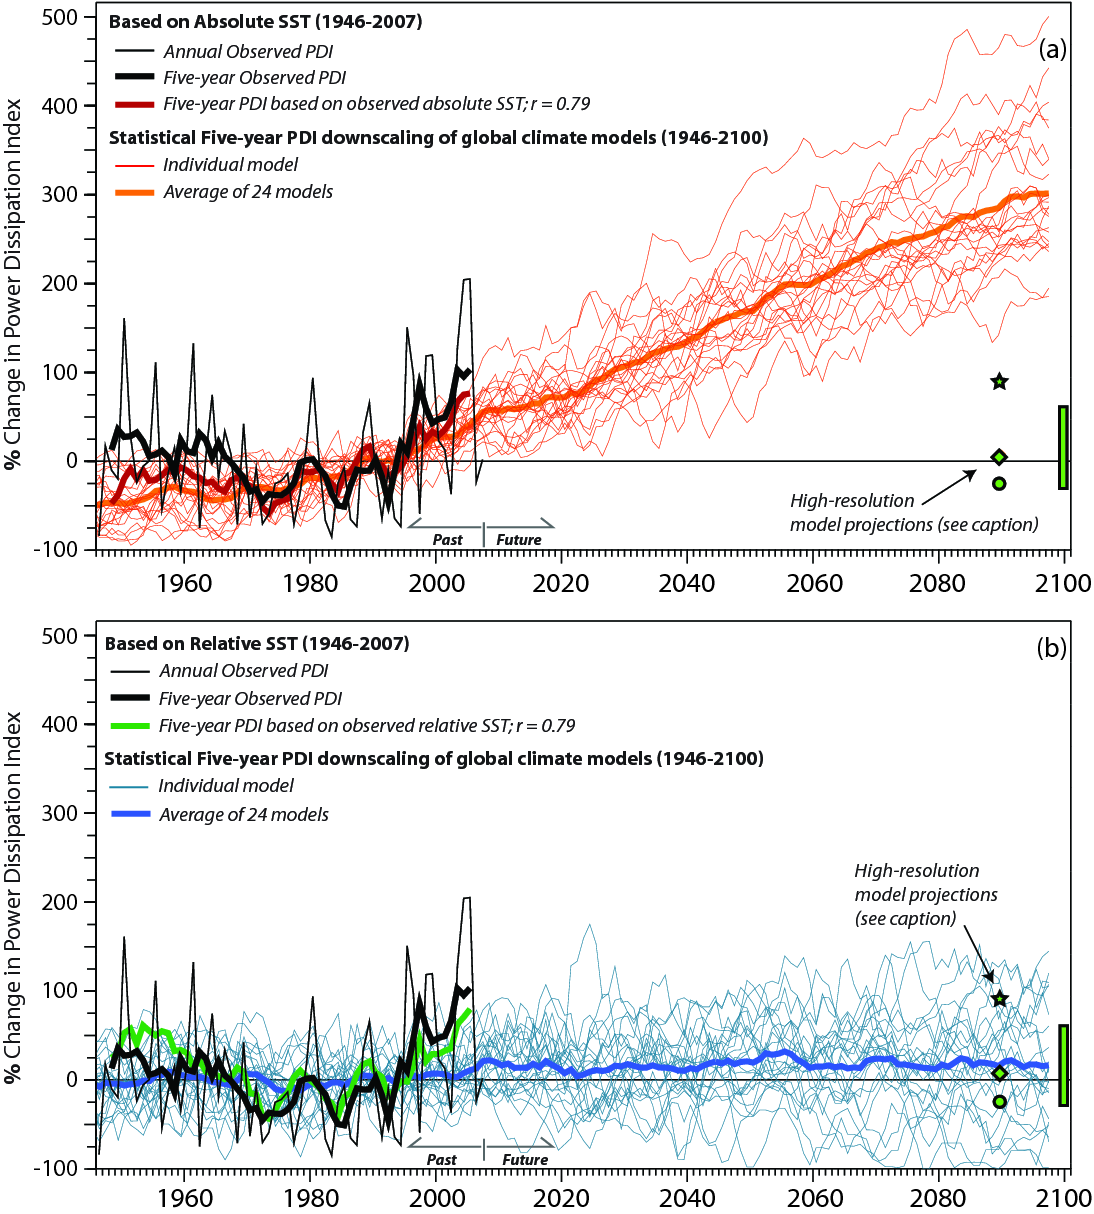
The Atlantic hurricane power dissipation index has increased very substantially since the 70s. This value combines frequency, intensity, and duration.
Since hurricanes result from a difference in temperatures, rather than from high sea temperatures alone, that image gives two potential predictions for the future. In the top (pessimistic) scenario, the north Atlantic and tropics warm unevenly and power dissipation goes up, in the bottom (optimistic) scenario warming is even and power dissipation remains mostly the same. Regardless of the future, it is undeniable that in recent decades hurricanes have gotten worse.
You can read the full article here, if you like. -
Re:First sentence is absurd
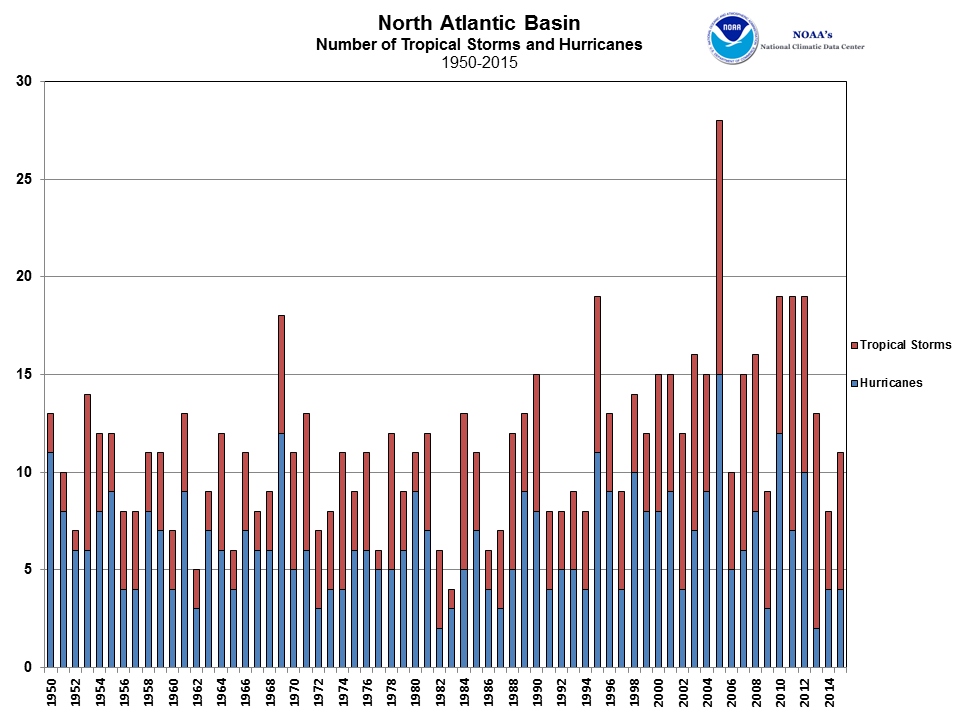
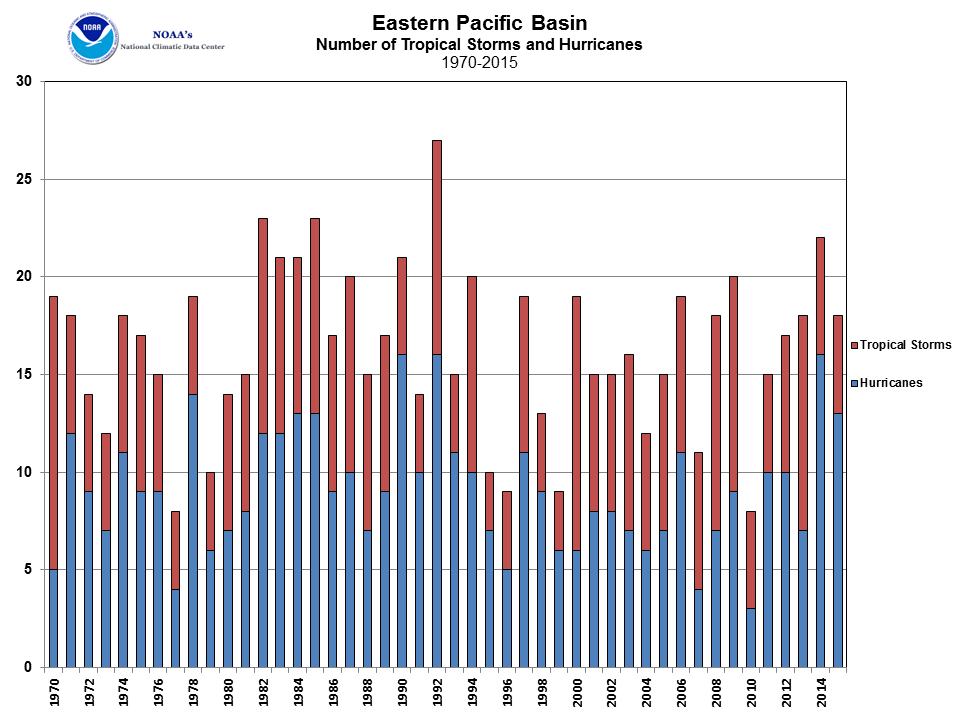
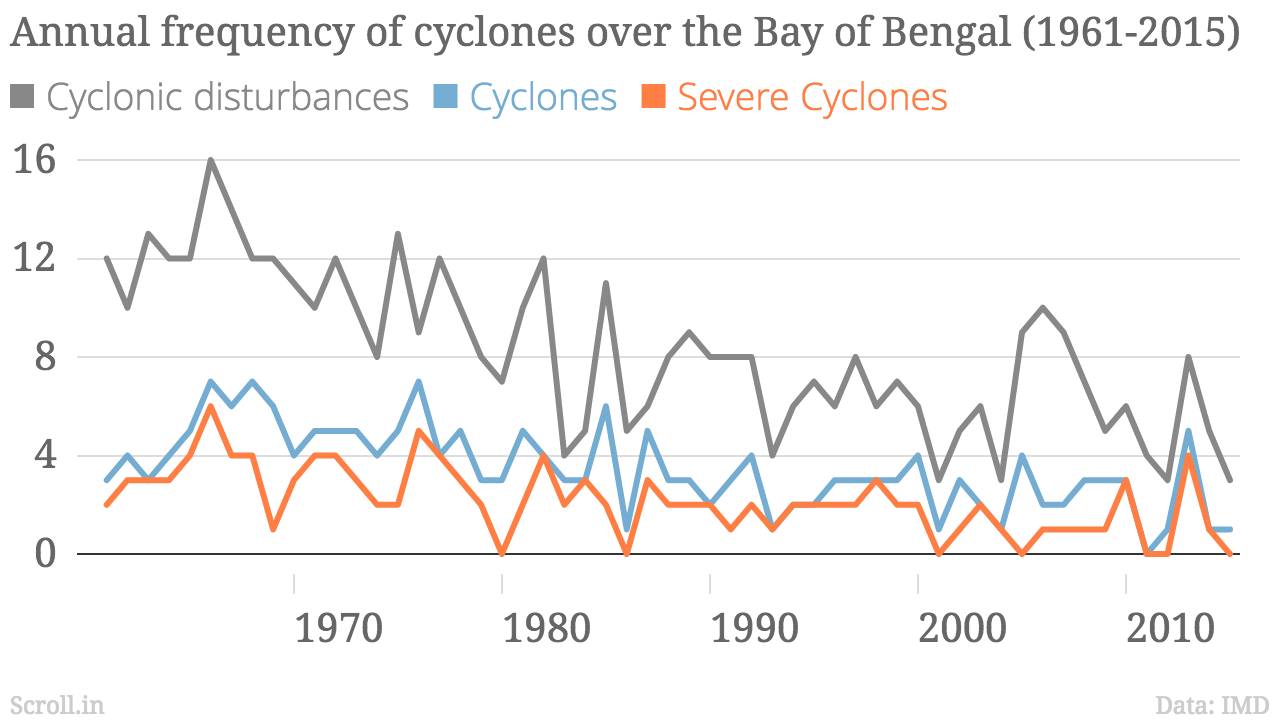
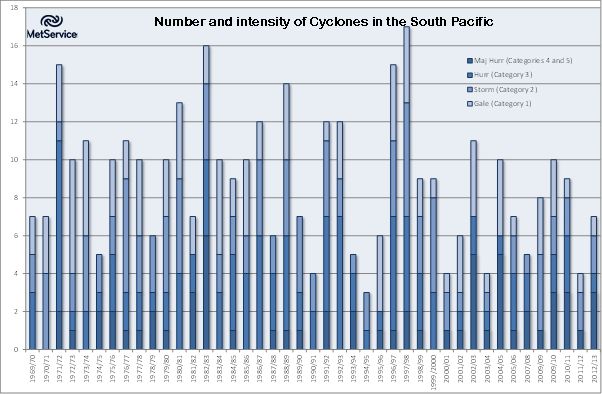
Only the North Atlantic has seen a slight uptick in hurricanes the last 15 years. The eastern North Pacific has been pretty flat. Tropical cyclones in the Indian Ocean have been down. As have cyclones in the South Pacific (off Australia). And cyclones in the western North Pacific have been mostly flat with a recent downward trend.
So if you cherry-pick your data from just the one storm basin which fits your preconceived expectations and ignore all the others, yes hurricanes have been increasing in frequency and intensity. -
Re:First sentence is absurd
Only the North Atlantic has seen a slight uptick in hurricanes the last 15 years. The eastern North Pacific has been pretty flat. Tropical cyclones in the Indian Ocean have been down. As have cyclones in the South Pacific (off Australia). And cyclones in the western North Pacific have been mostly flat with a recent downward trend.
So if you cherry-pick your data from just the one storm basin which fits your preconceived expectations and ignore all the others, yes hurricanes have been increasing in frequency and intensity. -
US hurricane landfalls are trending down
http://www.aoml.noaa.gov/hrd/tcfaq/E23.html
Landfalling US hurricanes are trending down the last 140 years. All categories (1-4+) are trending down.
-
Interesting...
I just read an article by NOAA arguing the opposite of this.
-
Re:Two storms of unusual magnitude ....
It's current...revised 30 Aug. 2017
-
Re:Winter is coming
I guess to you it's just an "inconvenient truth" how long it's been since we've even had any serious hurticanes hit the US.
I think that the prediction is actually for fewer storms, but greater magnitude.....
C. Model simulations of greenhouse warming influence on Atlantic hurricanesIt's about time we got some science into this conversation. All that reached the public was the promise that there would be no fewer than five hurricanes each stronger and more economically damaging than Katrina in 2006, along with a lot of yelling and screaming and calling people idiots for having the slightest skepticism that climate models were good enough that such precise predictions could be made. Then 2006 was not as bad as was predicted and neither was 2007 or 2008...
Meanwhile, every loudly announced "warmest year on record" was quietly adjusted to be cooler than 1998 which anyone could see on the annual graphs where the last year's "warmest year on record" had been moved below the temperatures of the 1990s. A lot of people now refuse to believe anything about global warming because they think it is all bullshit.
-
Re:Why don't they just say 'Alaska'?
OK, so I found the experimental 3 day forecast:
http://www.swpc.noaa.gov/produ...
It looks like I might have actually seen something... if my region wasn't also predicted to be blanketed with rain clouds and the occasional thunderstorm through to the weekend.
-
Fixed link
Sorry, here is a link to the many, many people who claimed Global Warming would cause more hurricanes.
It's also funny how the GFDL used to claim global warming would neither make hurricanes more frequent nor more powerful...
-
Both storms were usual in magnitudeQuoting the wiki page on Atlantic hurricane seasons:
On average, 10.1 named storms occur each season, with an average of 5.9 becoming hurricanes and 2.5 becoming major hurricanes (Category 3 or greater).
So far this season, we've had 9 named storms, 4 of which have become hurricanes, 2 major hurricanes. While we've still got 3 more months, but the end of September is the end of the peak, with a few storms in October, and almost none in November. Predictions at the start of the season were for about 14 named storms, 6-7 hurricanes, and 3 major hurricanes. So we're on track for a really boring, average year in terms of Atlantic hurricanes.
The only reason both storms seem unusual is because until Harvey, the U.S. hadn't been hit by a major hurricane since 2005. Contrary to the doom and gloom scenario painted by climate change alarmists after Katrina, Rita, and Wilma, who warned us that 2005 was going to become the new norm for Atlantic hurricanes. Sometimes outliers are nothing more than outliers. -
Re:Winter is coming
I guess to you it's just an "inconvenient truth" how long it's been since we've even had any serious hurticanes hit the US.
I think that the prediction is actually for fewer storms, but greater magnitude.....
C. Model simulations of greenhouse warming influence on Atlantic hurricanes
Our regional model projects that Atlantic hurricane and tropical storms are substantially reduced in number, for the average 21st century climate change projected by current models, but have higher rainfall rates, particularly near the storm center."I guess you will also have an explanation for the fact that there is less ice in the Arctic?
Summary: climate change denier detected.
-
Re:Halibut in my neck of the woods
You can thank the politically powerful IPHC for some of that price. Visit this site, and look at this map. There is no biological basis for how the catch quota for area 3A exceeds the catch quota for all parts of area 4 combined. That's strictly the IPHC keeping its members happy (ie wealthy). Of course the other factor is that the number of people around the globe who are willing to pay $30/lb for halibut grows every year.
-
Re:By the year 2100?
"You "hear" incorrectly. Assuming no runaway feedbacks kick off, the expected increase by the end of the century is between 1 and 2 meters."
Let's see what NOAA has to say.
https://oceanservice.noaa.gov/..." Sea level continues to rise at a rate of about one-eighth of an inch per year."
So, 1/8 inch per year, for 100 years, that's... 12.5 inches. You're right, that's not a foot per century it's 12.5 inches per 100 years. AHA! Oh, wait, it's not a meter either.
" Places like Miami flood during high tide now."
That's because the city is sinking into the sand.
http://dailycaller.com/2016/07..."Andrew Kiernan, a real estate expert from Franklin Street, makes the point that Miami Beach was built on sand, something that would lend itself to subsidence."
"The climate SCIENTISTS have been pointing out the bad science coming from the right and climate cranks for decades."
The climate scientists should perhaps talk to some geologists and real estate people before claiming that sea level rise is the cause of city flooding. Miami is 3 feet above sea level, they get some minor flooding once or twice a year. Assuming a meter rise in sea level per century they have decades yet from when flooding goes from a minor nuisance to a constant problem. They can start by telling people to STOP BUILDING THEIR HOUSES ON SAND!
We have flooding here in the Midwest. In the last couple decades we saw some old neighborhoods get flooded in just about every major city in the Mississippi River valley. It's common practice to redraw the flood plains every so often and declare those places off limits to new development. They get turned into grazing lands, hunting areas, parks, sometimes farmers still plant crops there knowing they run the risk of losing what they planted.
We have this figured out. Maybe those people wearing expensive suits in Florida need to go talk to a trucker hat wearing farmer on how to manage flooding.
-
Re:Enough with the lies
I can think of one thing that would be useful for self driving cars that would benefit greatly from low latency. The use of RTK for getting highly accurate positions using the CORS network that the US has and supplementing with state CORS networks if available. I know it is being used by some MnDOT and MetroTransit vehicles but can't find the article that I read stating as such but did find a paper from the University of MN when they were doing some trials.
Then again for something like that maybe having a dedicated system that continuously broadcasts the current (last few seconds) of data to all would be better as it would be even lower latency and wouldn't require massive amounts of bandwidth. -
Not quite...
The aurora are not always visible all around the globe at the same latitude; they often appear brighter in one hemisphere and not the other at a given time. There's a good visualization here: http://www.swpc.noaa.gov/produ...
So, it could very well be that Fairbanks could get a very good show one night (assuming it's not mid summer and it's dark enough) while Iceland might not see anything, even though they are both roughly at the same latitude.
Also, the aurora typically aren't as intense right at the poles, but are often most intense at less extreme latitudes around 60 degrees. So it's not unheard of for the aurora to be very impressive in Alberta, while not even being visible in the north part of the Yukon. -
Not really expecting a good show
As per http://www.swpc.noaa.gov/communities/space-weather-enthusiasts, the Kp index peaked several hours ago and is on the way down. The official forecast called for higher activity though 06 UTC, and then declining after that. The Kp index was higher several hours ago, so there was a good opportunity to see the Aurora Borealis in eastern Europe and parts of Asia. If we were going to get a good show in North America, it would be happening right now. But that's not happening, and based on the forecast, I doubt we'll see much in the USA.
-
Re:So Make Hydrogen
Actually, I think one of the issues with melting polar ice is a decrease in salinity that slows the circulation of the oceans. It used to be that cold salty water dropped to the ocean floor at the poles and drove an underwater river that circled the globe, http://oceanservice.noaa.gov/facts/conveyor.html. That is now slowing, too much warmer fresh water from ice melting (no matter why). Less winter sea ice forming means less salt adding to the process.
Also, people are actively harvesting sea salt today in California... not sure why... lot of algae from the looks of it.
San Francisco Bay @ Coyote Creek... I don't think I want that on my salad... -
Lack of data worrisome
Interesting read but I have to admit I'm skeptical. I work in the field and its common knowledge that sensors are few and far between outside of normal travel lanes/coast lines. http://www.ndbc.noaa.gov/ is the site I most often use and its quite lacking all things considered. From TFA (I know, I know) "Since one can never re-observe the ocean in the past, some synthetic data should be used, for instance high-resolution model outputs, sea level data, etc." While these models are decent, they won't perform the best in extremely data sparse areas which can easily skew data when working with over a large area. Not claiming its wrong, just that the lack of live data makes it difficult to honestly assess the situation.
-
Re:"Could" is not scientific
You were making the definite sweeping statement without bothering to google for something like "accurate climate change predictions". Here's a PDF from NOAA, which I found after a moment's search.
-
Re:a third has ALWAYS been exposed to deadly heat
Weather is not climate. One heat wave 80 years ago doesn't prove anything, especially not if you're comparing the two by the number of deaths. People didn't have AC back then, so of course more died.
Last year was already the warmest year on record, 0.94 C above mid-20th century mean, and we've been having very warm years for the last 2 decades. If your point was that temperatures aren't rising, then I'm going to want to see some data to back up your claims. Even if it's just where you live, can you show temperatures have been flat or falling in the past 4 decades? Or do you just have worse and worse memory and can't remember how cold it was back then? -
Re:The priesthood has spoken
TFA is a junk. It didn't even cite the source article. TFA cited the original image with some infos but never gave the link to the article. What does this say to you? What is the intention of the author?
-
Re:So, how can they can they declare it ended?
You should read the source article instead, and you will see that it is not the message TFA is delivering. TFA is a junk!
-
Re:So, how can they can they declare it ended?
Article doesn't explain how the scientists know this is an end to the destruction versus a temporary reprieve? Seems like a stupid title altogether.
Because TFA cited for
TFA is just a rephrase from the article written on NOAA site. The site talked about the end of "the third global event" of coral bleach event. That meant there could be another bleach event occurred in the future, so we can't be celebrating yet. However, TFA rephrase it as if the whole bleach event is now over (and no more)! Such a BS!
-
Paris agreement's goals are laughable
What ever else you want to say about the Paris Agreement, it's temperature goals are laughable. Look at NOAA's temperature trends since 1880. Temperatures have increased by 1.0 C since 1880, already. The Paris agreement suggests setting goals to keep temperatures below 1.5C above pre-industrial levels. From the climate modelling the IPCC has collected, even a complete and absolute global ban on all CO2 emissions tomorrow would NOT reach the 1.5C goal. The existing emissions already out there will ride us over 1.5C before 2100.
-
Re:Handily Difficult to Check
The pacific ocean is the true world ocean of today. Look at this showing the general ocean currents in the pacific. Notice how there are streams that pass by all land masses and particularly the most developed trade-based coastal nations. If you have ever had physics using differential equations to model fluid movements then you can easily understand the implications of all the feed-back loops. Easter island and Henderson island (the one this story is about) are the clear sinks in the right side of the south pacific gyre. Also, notice this which explains that the atlantic is less than half the size of pacific - that is why there is more trash in the pacific.
-
Re:Handily Difficult to Check
The pacific ocean is the true world ocean. Look at this showing the general ocean currents in the pacific. Notice how there are streams that pass by all land masses and particularly major ones pass by the most developed trade-based coastal nations. If you've ever had any education in physics with differential equations for modeling fluid movements then you can see the understand the implications of all those feed-back loops. Easter island and Henderson island (the one this article is about) are at the right side of the south pacific gyre, and are the very obvious sink where items accumulate from the entire pacific region. Also, notice this which explains that the atlantic is less than half the size of pacific.
-
Re:Well...
Here's the NOAA data, it certainly does look like the general trend is the northern climes to have a falling sea level (rebound) and the middle/southern climes to have a rising sea level (also rebound). There are a few exceptions along the ring of fire where we have huge plates subducting, but other than that... If it really were global warming, wouldn't we see a much more even growth in sea level everywhere, or at least one not quite so well delineated by the 49th parallel?
-
Re:Yeah
Looking at the long-term NOAA data it looks like the earth's crust is still rebounding from the last ice age, as much of the northern extremes are generally rising (sea level "falling") and the middle and southern areas are sinking (sea level "rising"). Not much we can do about that, is there? Other than use a solution the Dutch have implemented for the last several centuries, anyway...
-
Re:Yeah
"There are people in Miami (and other Florida coastal cities), who beg to differ."
They seem to have built parts of Miami Beach below the level reached by the highest high tides. Imprudent of course, But profitable if you can sell the property before the moon and sun next align in an unfortunate configuration. Maybe they should have put a bit more thought into approving building permits.
There are a number of tidal gauges in Florida and several in the Miami area.
Here's what NOAA has to say about Miami Beach
"The mean sea level trend is 2.39 millimeters/year with a 95% confidence
interval of +/- 0.43 mm/yr based on monthly mean sea level data from
1931 to 1981 which is equivalent to a change of 0.78 feet in 100 years. "
https://tidesandcurrents.noaa....Don't take my word for it, nor your local newspaper's and certainly not the Slashdot editor's. I'd encourage you to check both NOAA.gov and psmsl.org for yourself.
-
Re:Yeah
Sea Levels really are rising. But not very fast.
The good news is that the article is, like most of the stuff BeauHD posts, more or less unmitigated nonsense. Despite mankind's practice of building way to much stuff below the level likely to experience storm surge in a major storm, a few inches of sea level rise in the next 50 years clearly isn't going to do all that much additional harm.
The bad news is that there is no reason to expect sea levels to stop rising any time soon. Here's a link to the NOAA webpage for the tide gauge at The Battery in NYC. https://tidesandcurrents.noaa.... If you look carefully at the picture of the gauge, you'll see there is probably less than a meter clearance between the high tide line and the top of the dock. A few centuries of 20-30cm/century sea level rise and "they" are going to have a problem. And not only with the dock. The street, parking area, and building behind the dock all appear to be at about the same level as the dock.
BTW. The evidence is thin, but it looks like sea levels in the last interglacial period 120,000 years ago peaked 5 meters (16 feet in American) above current sea level.
For whatever reason, I couldn't get to historical tidal gauge data for the Battery from the NOAA site (503 error). Maybe I clicked the wrong link. Here's a link to a chart from a reputable source (psmsl.org)
http://t0.gstatic.com/images?q...
Note that a couple of cm per century of the Battery seal level Rise is thought to be due to tectonic forces -- The Battery is thought to be sinking a bit due to glacial isostasy. -
Re:Helium
> Helium is not exactly abundant here on Earth.
Hydrogen works very well too. It can be generated on site, on demand, using water and electricity or a controlled chemical reaction. Or it can be shipped in tanks like Helium. Hydrogen is used for radiosonde balloons http://www.srh.noaa.gov/jetstr... https://en.wikipedia.org/wiki/... Given that its payload will be radio gear, there's no worry of a Hindenburg-type disaster. Radio gear is replacable.
-
Re:The scientists are talking, who is listening?
Waves are as intermittent as the wind. I live about 200 meters from the beach, here in Ventura, CA. I can hear the surf when it's up. And it's quite often that it will go a week or two with less than 1m high waves. Now, we do get a good surfing season in (1-3m waves) a few times a year, but it's variable. Waves are as intermittent as the wind - which shouldn't be a surprise because waves are predominantly driven by wind. And I don't think anyone is arguing that wind is NOT intermittent.
As far as tides go, here's a good primer on how variable they are, and why you cannot just make predictions. You do need to have actual measurements to assist your predictions - and even then it's a guess. A good one, but still a guess. Ask any fisherman or harbor captain and they'll tell you the tides are variable and only somewhat predictable. Much like NOAA itself says. And it is intermittent (meaning not constant) as many, many, many sources confirm.
It's not surprising, because the energy from a fluid is related to the velocity (squared). A lower tide has less energy, and a 12 hour cycle time also makes the energy low - such that you want to trap the water behind a temporary dam, then let it all out at the greatest differential in height. But that, of course, creates zero energy for a majority of the time then a big burst of energy when the water is funneled through the turbines. Which - by definition - is intermittent. It may be repeatable, and it may even be predictable. But it is not constant, it is intermittent.
-
Re:La Niña is about to bite us in the arse
Stuff like this is a real PITA. Climate change is real and poses real threats, but when people post totally unscientific nonsense like this, it undermines the credibility of real science.
First, there is a real possibility that a new El Niño will occur in the summer or fall.. This would suppress hurricanes in the Atlantic.
Second, how many severe (Cat 3+) hurricanes hit the Gulf Coast during the 2010-20112 La Niña? Zero.
Third, the connection between climate change and hurricanes is pretty weak. Legitimate climate scientists have major honest disagreements on this. Add stochasticity (i.e., weather), and no one can make credible predictions of hurricane landfalls on the U.S., or portions of the U.S. over the next several years.
Climate change is real, is caused by human activity, and poses real risks, but we will be better able to prepare for it if we stick to what we know scientifically and don't try to spread exaggerated unscientific alarms.
-
I Doubt It
Seriously, do you think that the CBC isn't used to lawsuits? That any major news outlet isn't regularly threatened with lawsuits, both real and imaginary? That the CBC doesn't have fleets of lawyers on retainer for exactly this type of situation?
There are lots of US commentators with a major hate on for the Mainstream Media, and this fits their biases about MSM. Except, we all know who hates on the MSM and what their agenda is. Well your agenda doesn't fit the CBC performance profile. The CBC has a good reputation and decades of experience with this type of thing.
I don't know about the specific merits of this case, let's be clear about that. However if the CBC screwed up, there will be an apology and a settlement. I'm betting what we will actually find, though, is that Subway screwed up and they will be the ones going home with their tail between their legs. Not that I have an agenda against Subway, and not even considering that whole Gerad/child sex scandal. The CBC had their own personnel issues not long ago with Jian.
What I do know is this. There has been a huge issue with product dilutions/substitutions/mislabeling, and only in the last 5 years has the technology been widely deployed to detect it. Fish of one species is routinely marketed as fish of another species. And somehow, less valuable species always wind up marketed as more valuable species, never the other way around. Herbal products have routinely found to contain little or no content that the label says is there.
http://www.noaanews.noaa.gov/stories2011/20110204_seafoodmislabeling.html
http://www.fooddive.com/news/5-products-accused-of-mislabeling-issues/400694/
http://www.health.com/mind-body/investigation-reveals-many-supplements-sold-by-major-retailers-are-mislabeledThat is just with 2 minutes work with Google. The list is endless and I could go on but my point stands. Good companies are learning that sometimes they had a problem and didn't even know about it; as a result they are modifying their procedures and can do better by their customers. The bad ones, well they deny and try to sue their way out of trouble.
-
Re:This has been planned for a very long time!
I.e. significantly longer than the US
I couldn't help but following your link after you said that, since it's one of those, "I knew Norway had a lot of coast, but THAT much?!" moments for me. I did want to point out that the numbers even at the link you shared are a bit incongruous, since they seem to vary quite a bit from source to source based on how they define a coast or shore (e.g. do they include freshwater or inland bodies of water? if they're measuring the actual coast (as opposed to the boundary of jurisdictional waters), are they measuring to a particular depth of tidal water, or are they measuring the shore as it's represented on a map? are overseas territories included in the country's total? ). For instance, here are some official numbers, most of which were pulled from the Wikipedia article you linked (I also grabbed numbers from other sources I've linked):
Norway's coast:
25,148 km (World Factbook) or 53,199 km (World Resources Institute) or 125,225 km (Statistics Norway)USA's coast:
19,924 km (World Factbook) or 133,312 km (World Resources Institute) or 153,646 km (NOAA)All of which is to say, while I can't say with any certainty which has the longer coastline (not that it matters), it's indisputable that the overall point you were driving at--that Norway has a LOT of coast (particularly given its size) and that it impacts things in all sorts of ways that most of us may be unaware of--is both correct and inherently fascinating. Thanks for sharing the info!
ADDENDA:
In case you're curious about the massive differences in the numbers...The World Resource Institute's dataset was designed to be used for comparisons between countries. They talk at that link about the difficulty in producing useful numbers and in comparing numbers from different sources. To get around most of the issues they identified, they used a vectorization of the coastlines at a constant resolution (to ensure that no country benefitted from having a more detailed mapping than other countries) and didn't include overseas territories. As such, theirs are useful approximations for the purpose of comparisons and are relatively accurate as far as these sorts of measurements go, but for coastlines with lots of nooks and crannies (e.g. Norway's), their approximations may have a greater degree of error than they would for locations with simpler coastlines.
NOAA and Statistics Norway are, I believe, both official organizations, but I wasn't able to find much about the methodology that either used. NOAA mentions that it includes outlying territories, so that immediately inflates their numbers a bit. They also include the shorelines of the Great Lakes, which makes some sense given that they are boundary waters between the US and Canada, but some people may question their inclusion. Either way, it's probably safe to say that both NOAA and Statistics Norway are working with highly detailed maps when making their measurements, so they're likely to be closer to the true numbers than the World Resource Institute's, though it's difficult to compare them without adjusting for differences in methodology.
As for the CIA World Factbook, they don't list their methodology in a place I could find, but it's pretty clear from their numbers for landlocked countries that they're not including inland bodies of water. Given how much lower their numbers are than everyone else's, I'd wager they were calculated at a low resolution, or else they may simply measure at a set distance from the shore, effectively decreasing the resolution of their measurements significantly.
At the end of the day, it looks like the US' coastline may be slightly longer, but the country also benefits from being significantly larger. Ba
-
-20C is not uncommon here
Not just Canada. I live in Montana, and -20C is nowhere near as low as we experience. That's only -4F; we see -40F here often enough to have to be ready for it every winter. Which is also -40C, for you metric types. The low temperature record here is -56F, or about -48.8C. This year we only got to -29F/-33.8C, so it was a good year as far as that goes. Global warming, I guess.
Also, this.
-
Re: s/drug trials/climate change/g
"measured in the laboratory" What climate-related factors are *not* measured? Clouds? Water vapor? Convection?
These are, however, measured in the actual environment. Along with the variables from the lab experiments. https://www.gfdl.noaa.gov/bibl... for example.
-
Re: s/drug trials/climate change/g
Consider that the global average land+sea temperature for this month (February), averaged over the entire 20th century, was 12.1 C. In a chaotic system, one would expect a roughly equal probability of seeing a cooler temperature as a hotter one, individually or averaged, though the average of large numbers of readings are less likely to show outliers. Seasonal and other cyclical factors would skew temperatures one way for a while, then the other way, balancing out over time.
For 2015, the globally-averaged temperature for February was 0.86 C higher than that 20th century average. If that was a single reading, or a local average, that wouldn't be at all noteworthy. Even averaged across the entire globe for the month, it was merely the second-highest February recorded, next to 1998. Similarly for land-only average temperatures, though with larger variations.
But when you consider that 2015 was the 30th hotter-than-average February in a row, the odds shift dramatically. If there's a 50/50 chance that we would see a hotter-than-average February any given year, then there's 1 chance in 2^30 that we would get 30 hotter "heads" in a row - ridiculously improbable. There hasn't been a cooler-than-average February since 1985 - and February 2016 was even hotter, setting a new record at 1.21 C above the average. Clearly the global average temperature isn't stable, but is showing a long-term underlying rising trend, which makes the new highest-temperature-ever records not only more likely, but bound to happen eventually. (Incidentally, if you use yearly averages instead of just February, it's now been 38 years of above-average temperatures.)
So the existence of a rising temperature trend is virtually certain. Whether it's anthropic or caused by a hitherto-undiscovered long-term natural cycle is a separate discussion, but the probability of the former is very high indeed.
-
Re: Paging Dr. Faustus
Wikipedia states that Greenland's ice sheet contains 2,850,000 km3 of ice. If a gigaton of ice is 1 km3, then that agrees with your math, and if it were only a constant rate of melting, it would take millennia to melt completely.
However, the rate is not constant - it's been steadily increasing due to positive feedbacks like reduced albedo and water lubrication of glaciers. In fact there's evidence that the ice loss is accelerating exponentially, so it could happen much quicker (still likely centuries).
Models also suggest that a 2-3 C rise would be all that's needed for complete melting, and at least 7m of sea rise (plus Antarctica's contribution, which will be a lot more). Since it appears highly unlikely that we'll prevent that now, our descendants are going to have to relocate almost every coastal city on the planet (multiple times, since current experience suggests they won't think ahead much either).
-
Re:Satellites?
The Indian Regional Navigational Satellite System (IRNSS) is a regional satellite navigation system owned by the Indian government. has completed the Navigation Indian Constellation (NAVIC) constellation. Measuring Everest would be a worthy demonstration project.
NAVICSome of the time probably is accounted for by taking long observations several times.
Final observations of satellite orbits usually are published 2 weeks later, so final post processing will occur after than.
For the highest precision GPS work surveyors are very methodical. I would expect final error on this kind of work will approach the theoretical best possible.More information can be found at www.ngs.noaa.gov National Geodetic Survey
-
Re:Satellites?
The GPS measurement have to be be evaluated against the sea level (that varies across the globe) and corrected for earth's non uniform shape. Here are some additional details on how this correction is done: https://www.ngs.noaa.gov/PUBS_... The high precision GPS recording have to be taken for a long time and then combined with standard survey methods for building baseline. And that means triangulating and correcting for atmosphere by calculating refraction coefficients by measuring pressure, humidity and temperature (typically done by releasing a weather balloon).
Plus, there is snow on top that is subject to seasonal shifts.
The survey will not just measure Mt. Everest height, but also conduct other geological studies.
I think 1 month is a very efficient time frame for this effort.
Like climate sciences, these things that appear trivial for casual observers are not. People have spend their entire lifetime specializing in these area's. -
Re:Depends on the Department
Before long if we want to review NOAA climate data we'll have to go to WikiLeaks.
Go for it, ftp.ncdc.noaa.gov/pub/data, just be advised, their connection is slow as shit.
-
Re:Leave.
Regarding recent Hausfather et al. paper, which is the source of the latest hype about "no pause": As Anthony Watts points out, the study only goes to 2015, and the middle of its strong El Nino. If it had gone to the present, after record cooling, it would show less or no overall warming. Quote Watts: "Personally, it looks like ignoring the most current data available for 2016, which has been cooling compared to 2015, invalidates the claim right out of the gate" Here's the quote and some other criticisms of Hausfather et al. dailycaller.com/2017/01/05/new-study... [Lonny Eachus, 2017-01-11]
No. When Hausfather et al. 2017 was published (long after it was submitted) the most current available NOAA data ended in November 2016. Nick Stokes showed that even if Hausfather et al. had used a time machine to include those data when submitting their paper, it would have showed more warming. Even the silly opinion piece Lonny linked notes that "climate models will more closely match observations once 2016 data is included".
... its conclusions might have been different after the record cooling we've seen, post- El Nino. [Lonny Eachus, 2017-01-11]
Ironically, Zeke Hausfather showed that including all the 2016 data available at publication actually increases the observed warming trends compared to their paper's conclusions using data through 2015. This is still true using the full 2016 NOAA data which just became available on January 18. Lonny could verify this by repeating these least squares trend estimates with the monthly data, or just noticing that the annual ocean average was even higher in 2016 than in 2015. Zeke Hausfather challenged Anthony Watts to find an ocean temperature record that was cooler on average in 2016 than in 2015. Watts couldn't name one or bring himself to retract his claim. Can Lonny?
... Personally, it looks like ignoring the most current data available for 2016, which has been cooling compared to 2015, invalidates the claim right out of the gate.
Watts accuses Hausfather et al. of ignoring the most current data and missing an ENTIRE YEAR's worth of data. Since Hausfather et al. 2017 was submitted in early 2016, they'd have needed a time machine to include the ENTIRE YEAR's worth of data that Watts accused them of ignoring and missing. In contrast, Sou notes that Anthony Watts presented an AGU poster in 2015 without data from 2015, 2014, 2013, 2012, 2011, 2010, or 2009.
Global Warming Lies: thinkprogress.org/climate... "It's Happening Now"
No, it isn't. NO warming -
Re:Leave.
Regarding recent Hausfather et al. paper, which is the source of the latest hype about "no pause": As Anthony Watts points out, the study only goes to 2015, and the middle of its strong El Nino. If it had gone to the present, after record cooling, it would show less or no overall warming. Quote Watts: "Personally, it looks like ignoring the most current data available for 2016, which has been cooling compared to 2015, invalidates the claim right out of the gate" Here's the quote and some other criticisms of Hausfather et al. dailycaller.com/2017/01/05/new-study... [Lonny Eachus, 2017-01-11]
No. When Hausfather et al. 2017 was published (long after it was submitted) the most current available NOAA data ended in November 2016. Nick Stokes showed that even if Hausfather et al. had used a time machine to include those data when submitting their paper, it would have showed more warming. Even the silly opinion piece Lonny linked notes that "climate models will more closely match observations once 2016 data is included".
... its conclusions might have been different after the record cooling we've seen, post- El Nino. [Lonny Eachus, 2017-01-11]
Ironically, Zeke Hausfather showed that including all the 2016 data available at publication actually increases the observed warming trends compared to their paper's conclusions using data through 2015. This is still true using the full 2016 NOAA data which just became available on January 18. Lonny could verify this by repeating these least squares trend estimates with the monthly data, or just noticing that the annual ocean average was even higher in 2016 than in 2015. Zeke Hausfather challenged Anthony Watts to find an ocean temperature record that was cooler on average in 2016 than in 2015. Watts couldn't name one or bring himself to retract his claim. Can Lonny?
... Personally, it looks like ignoring the most current data available for 2016, which has been cooling compared to 2015, invalidates the claim right out of the gate.
Watts accuses Hausfather et al. of ignoring the most current data and missing an ENTIRE YEAR's worth of data. Since Hausfather et al. 2017 was submitted in early 2016, they'd have needed a time machine to include the ENTIRE YEAR's worth of data that Watts accused them of ignoring and missing. In contrast, Sou notes that Anthony Watts presented an AGU poster in 2015 without data from 2015, 2014, 2013, 2012, 2011, 2010, or 2009.
Global Warming Lies: thinkprogress.org/climate... "It's Happening Now"
No, it isn't. NO warming