 Slashdot Mirror
Domain: noaa.gov
Stories and comments across the archive that link to noaa.gov.
Comments · 2,602
-
Galactic Cosmic Rays (GCR)
"Telesat is continuing to investigate the root cause of the anomaly and will advise affected customers as more details become known." link
"Just as the solar cycle follows a roughly 11-year cycle, so does the GCR, with its maximum, however, coming near solar minimum" link
"Highlights of Solar and Geomagnetic Activity 26 September - 02 October 2016 Solar activity was at predominately very low levels" link -
Re:Dishonest Arguments not Politics
There are literally tens of thousands of scientists that don't think it's warming.
Ok it should not be a problem to name some then should it? Please pick some that are in faculty positions at reputable universities though because when I have spoken with my colleagues over in geophysics and earth and atmospheric sciences not one of them has raised any doubts whatsoever that the mean temperature of the planet is increasing. There IS debate about the level mankind's contribution to the increase but absolutely no doubt whatsoever that the temperature is increasing....and before you go off the deep end about funding conspiracies etc. a lot of these people receive grants from the oil industry so if anything they would have a bias against global warming.
So apologies if I take the word of world experts in the field over a random guy on slashdot who has provided absolutely zero evidence to back up his claims. For example what evidence do you base your claim that only 4% of the world's CO2 is from humans? This plot shows a 25+% increase in the level since 1960. What natural process has caused such a rapid yet steady rise in CO2 over that period? I'm more than willing to keep an open mind about the causes but it seems very plausible that human CO2 emissions caused this increase and I've not heard of any natural process that could account for it. If you want to convince people you need to explain the data. Just stating what you believe and shouting at anyone who disagrees is not how science works. -
Re:The anti-science sure is odd.
the EXACT OPPOSITE has been *****OBSERVED*****
So you keep claiming, but repeating it louder isn't going to help. If you can produce this supposed evidence, try doing that, because spamming links to some political site won't sway anyone. And while you're at it, see if you can explain away the mountains of evidence showing the accelerating rise in temperatures for the last 150 years.
the falsified data from NOAA, yes, FALSIFIED
Let me guess, you've got no evidence for this accusation of malfeasance either, right? Your sole basis for all this seems to be that you don't like the results, and something something conspiracy. Well too bad, science doesn't work that way. You can spout Lysenkoism all you like, but from here it looks much more like you're the one denying the evidence you dislike, and producing none of your own.
NOAA are completely open about their data correction methods, which are peer reviewed, confirmed independently, and are corroborated by data & analysis from NASA, CRU, and other international agencies. And if you still don't like it, take their raw data (yes, it's always been available) and do your own analysis (if you can get your methodology through peer review, ha ha). That's what the Berkeley Earth people did (you can check their data too) - and surprise surprise, their results agreed with NOAA, NASA, and the others. So your unsubstantiated claims of "tainted" data are laughable in the face of the real evidence.
No amount of evidence will ever persuade you from your religious beliefs.
What a coincidence; "no amount of evidence" is exactly what you've produced. And yet it's you that has repeatedly dismissed all the evidence against you, citing only some purely hypothetical political manipulation. "Zombie minion" indeed.
-
While correlation is not causation
Here is a map of air pollution in the United States http://www.nws.noaa.gov/airqua... Here is a map of mental illness in the United States http://www.medicaldaily.com/sa... If toxic particles from the air are getting into human brains, could this be related?
-
Re:The anti-science sure is odd.
did you not know the Minoan Warm Period, Roman Warm Period and Medieval Warm period were warmer than today?
No, because globally, they were much colder (see fig 2).
Vikings farmed in Greenland
And now it's easier than ever before.
wine grapes could be grown as far north as York in England.
There's many commercial vineyards there today, and even further north.
Now the graves of the Vikings are under 'permafrost'
Wrong, there hasn't been permafrost at those sites for a long time.
You talk about 'nutters' yet seem to be defending a position for which you don't even understand even the basic counter evidence
I've yet to see you present any, only oft-repeated claims that you obviously have never bothered to check for yourself.
I would hope you would look at the statement of the leaders of the CAGW movement
You seriously expect us to accept a bunch of out-of-context quotes as evidence of some global conspiracy? The only "agenda" it proves is that of the people who set up the website.
"Anti-science" means people who deliberately ignore the huge amounts of collected scientific evidence, and continue to spout provably incorrect claims with no evidence of their own. "Nutters" usually follow this by attempted FUD about the reliability of all the evidence against them, inevitably resulting in global conspiracy claims. You certainly qualify for both terms.
-
Re:the could just give it to openstreetmap ...
More like up to date photos. I have added a bunch of new roads in my town using GPS traces, but having a non greenfield image of the area would help to better align thing as GPS isn't exactly perfect. I really need to reassemble my RTK setup and use my own base station as well as the nearby CORS station for error correction during post processing.
-
Well, that's the disproven Al Gore model
Remember when Al and all his alarmist pals were pointing at Katrina and saying that global warming was driving an increase in the number and severity of hurricaines and thus caused Katrina? Remember when they blamed Katrina on Bush and the "big oil" [companies], (which was purely coincidental with their political oppositon to Bush, of course) then backed-off on Katrina and said it would cause a growing number of Katrina-like events and liberal politicians and policies were needed to save the planet?
yeah, well:
"Facts are stubborn things; and whatever may be our wishes, our inclinations, or the dictates of our passion, they cannot alter the state of facts and evidence." - John Adams, founding father and second President of the USA
"The prospect of domination of the nation's scholars by Federal employment, project allocation, and the power of money is ever present and is gravely to be regarded. Yet in holding scientific discovery in respect, as we should, we must also be alert to the equal and opposite danger that public policy could itself become the captive of a scientific-technological elite." - President Dwight D. Eisenhower (in his farewell addrress, right after warning about a "military-industrial complex")
-
Re:Desperate lies?
>> But you know: enough individual weather data points are climate.
No, they add up to a total picture of the overall climate. You can't cherry pick some data points and ignore others.
>> the way historical temperatures have been artificially adjusted downwards.
You're misunderstanding the adjustments. When measuring stations are replaced the offset between the old and new data is taken into account by offsetting the old data to align to the new, rather than the other way around. The trends are checked and aligned, since it makes sense that instrumentation changes would be the cause of a step change rather than actual weather having a step change at the same time as the station being changed. In any case the absolute value of the reference point just doesn't matter. It's the change (slope, trend, etc.) that matters.
Question: In Europe the spring and early summer were cool, but how does the average over the period compare to the reference period of 1951 to 1980 in the GISS citation?
Another report is here with a similar 0.5C positive anomoly for Europe: http://www.ncdc.noaa.gov/sotc/...
The point is, before you go accusing the agencies of falsifying results you need to first understand what they do and where the data comes from, then if you want to refute it you need to show the data and analysis that contradicts these reports. Can you cite contradictory data and analysis?
-
Re:Climate data has been available for a decade...
The code is available here. Papers here. NASA uses station data compiled by NOAA GHCN v3 (meteorological stations), ERSST v4 (ocean areas), and SCAR (Antarctic stations),
According to the Director of the NASA Goddard Institute for Space Studies "Anyone can download it, run it for themselves and get the answer before we update our website every month."
I find it fucking hilarious that these jackasses are asking for the raw data when it's already available and has been available for years.
Next time some joker whines about raw data the answer will be: "Have you fucking looked?"
-
Climate data has been available for a decade...
The code is available here. Papers here. NASA uses station data compiled by NOAA GHCN v3 (meteorological stations), ERSST v4 (ocean areas), and SCAR (Antarctic stations),
According to the Director of the NASA Goddard Institute for Space Studies "Anyone can download it, run it for themselves and get the answer before we update our website every month."
-
Re:Was this before or after adjustments?
Was this before or after adjusting the data?
The procedure is outlined here: https://www.ncdc.noaa.gov/oa/climate/research/ushcn/ushcn.html
The warming in the data is almost exclusively due to the adjustments supposedly to account for urban heat islands. However, without those adjustments, the temperatures are pretty flat.
It's bad news when you have to control for various factors in order to obtain an interesting result. It's also very arbitrary because the researcher can pick and choose which factors to account for and how to do so, in order to obtain the desired result.
These kinds of abuses lead to all sorts of nonsense conclusions like claiming vaccines cause autism. If the warming doesn't show up until you adjust for certain factors, you're doctoring the data.
So, I'd really like to know whether this is before or after the adjustments. The adjustments to the data create the mostly fictional warming.
Just how much longer are you going to keep up this pseudo skepticism? Basically you're calling scientists liars, or at best, morons. So let's here your interpretation, and let's hear who you've submitted it to, and how it has been received.
-
Was this before or after adjustments?
Was this before or after adjusting the data?
The procedure is outlined here: https://www.ncdc.noaa.gov/oa/climate/research/ushcn/ushcn.html
The warming in the data is almost exclusively due to the adjustments supposedly to account for urban heat islands. However, without those adjustments, the temperatures are pretty flat.
It's bad news when you have to control for various factors in order to obtain an interesting result. It's also very arbitrary because the researcher can pick and choose which factors to account for and how to do so, in order to obtain the desired result.
These kinds of abuses lead to all sorts of nonsense conclusions like claiming vaccines cause autism. If the warming doesn't show up until you adjust for certain factors, you're doctoring the data.
So, I'd really like to know whether this is before or after the adjustments. The adjustments to the data create the mostly fictional warming.
-
Re:Has nobody heard of El Nino ?
Know who you are citing. Skeptical Science is not trustworthy.
Be the background and education of the founder what they may, the point is the arguments made by OP are not supported by peer reviewed science. That is, the veracity of the studies and results which point to OP being wrong - are not dependent on the credentials of whoever founded the blog because he has had no part in said studies. He claimed UAH satellites show the stratosphere is not warming, and I pointed out that UAH itself has explicitly said this is not the case. here's the link to the paper itself.
So, if the articles quoted and mentioned which refute OPs claims are not accurate, I ask you and other to link to peer reviewed papers showing that to be the case, because pointing out that whoever started the blog isn't very good at math has absolutely no relevance to the veracity of the actual scientific papers mentioned.
-
Re:Stupid bet...
A much safer and more scientifically relevant bet would be that the average temperature of the entire 2010's will be at least a half degree Celsius higher than the average temperature of the 1910's.
We're only halfway through the 2010's, but the signs so far indicate that it would take an overwhelming global cooling over the next 3.5 years for this to be a losing bet.
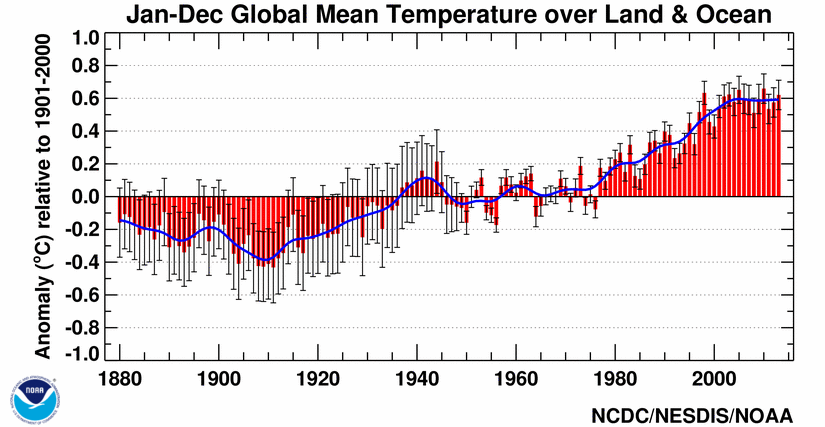
There are many graphs that one could choose from, but I'll just use this one from NOAA. The 1910s were all 0.2 - 0.3 celcius below the average for the 20th century. The 2010s (so far) have all been about 0.6 celcius higher. 2016 is looking to be a banner year.
So as it stands, the 2010s are already about 0.9 celcius higher than the 1910s, nearly double the half-a-degree mark. In order for one to lose this bet, the next few years would have to be below-average. Given the tremendous inertia of the global climate, I think it would take a modest nuclear winter, or a handful of Pinatubo-like volcanic eruptions, for this to happen. I'd happily take that bet.
Though, given that it's an election year, that nuclear winter is still a possibility. -
Re:Beacons?
Rather than wait until someone notices a large margin of error, why not install immobile beacons in key locations that constantly monitor their locations and report back any differences?
They do.
http://www.navipedia.net/index...
https://en.wikipedia.org/wiki/...
http://www.trimble.com/gps_tut...
https://www.ngs.noaa.gov/CORS/With regional to local corrections accuracy to 10cm is almost easy.
A number of auto GPS devices have an additional receiver for exactly this.Surveyors can gather high quality data with the assistance of a recording
stationary receiver (one or more) and post process measurements made
by the moving instrument.Follow the links to Augmentation https://en.wikipedia.org/wiki/...
Of interest three linked devices on the distal wings of aircraft allow some cool data...
-
GPS position accuracy
Precision GPS needs to be with respect to a set of base stations. Like the Continuously Operating Reference Station (CORS) https://www.ngs.noaa.gov/CORS.
There is no reason why the coordinate frame cannot be defined to move with the subcontinent.
The CONUS has portions that move in different directions so we both attach the coordinate frame to one of the plates, and do periodic readjustments
http://www.ngs.noaa.gov/web/surveys/NA2011/ -
Re:Is in *my* phone or not ?
Why do I have that feeling that you'd be one of those people who lament endlessly that government didn't tell them that a tornado was coming their way and they didn't get their house prepared...
There are many ways to get weather notices. A NOAA radio is a great way. http://www.nws.noaa.gov/nwr/co...
You can get the info direct from them using either an app or a radio like this one: http://www.northerntool.com/sh...
This is a superior method to telephones, which in emergencies are often not accessible. Smartphones are cool and all, but I wouldn't trust my life to one.
-
Re:Was this before or after
To be fair, the ticks could have tagged along on the animals just fine. And stagnant water on the deck or in storage could have harbored plenty of mosquito larvae.
What a global flood has to do with the meteor extinction event, I don't know. I know people like to inject off-topic jabs at religion every time dinosaurs are mentioned, but it's tired and not even funny here.
Oddly enough, the post that started this off topic foray is now marked +4 Funny.
As for relevance, a global flood would be another form of extinction event. Regardless, at one point most adherents thought of it as allegory until the relatively recent literal interpretation folks demanded that it was literal.
I suspect a possibility of the Mediterranean sea flooding event such as one that happened around 7600 years ago, with the concurrent attributions as a punishment from the Abrahamic deity. http://www.ncdc.noaa.gov/paleo...
Similar floods have been mentioned in the Epic of Gilgamesh, or perhaps Epic of Atrahasis https://en.wikipedia.org/wiki/...
And at the time, when the People of the middle east were not spread out over the entire world, it might have seemed like a flood that covered the entire world, or perhaps just grew in the telling.
But to answer your question of why people take those digs, it is because of just how preposterous the claims are for the literal Noachian flood.
And since this place claims to be science http://creationmuseum.org/ it is fair game. Especiallly skin they claim the science of humans and dinosaurs co-existing.
-
Re:I need the Weather
This website does not work in Firefox without the Flash Plugin.
http://www.ssd.noaa.gov/goes/east/carb/flash-rb.html
I use this website every day.
Any suggestions.Use the non-flash version?
http://www.goes.noaa.gov/dml/e...
Or ist that somehow not good enough? I can't compare; no Flash installed.
-
Even paleo reconstructions show spike at the end
We know that the proxies have much lower resolution than the actual measurements and are not comparable at all
Nonsense. Many paleo data sets have an annual resolution. There is only so far global mean surface temperature can stray in 1 year.
The reconstruction I used overlaps the instrumental record (with remarkable agreement) and shows (you guessed it) a sudden spike at the end!
-
Re:Hide the decline
You can start looking here. [noaa.gov]
Gee, yeah. "A recent study by NOAA found no evidence of mistakes by NOAA". Right. The NSA would totally exonerate themselves too, as would Enron.
Sorry, hon, if 89% of your data-collection stations aren't positioned right, your results are junk no matter, how you "adjust" them. Turning a turd into chicken salad has a better chance of succeeding.
There are lots of links to NOAA's methods and reasons
Sure, there are. And they may even be perfectly reasonable. The point was, they are themselves subject to reason — not as objective, straightforward, and indisputable as writing down values from thermometer would've been.
No one has destroyed any of the raw data
Funny, that's not, what the NY Times article says... It acknowledges the destruction (emphasis mine):
"Data storage availability in the 1980s meant that we were not able to keep the multiple sources for some sites, only the station series after adjustment for homogeneity issues. We, therefore, do not hold the original raw data but only the value-added (i.e. quality controlled and homogenized) data."
Funny, they could not spare one more tape for the originals and chose to use the space for the "value-added" data instead — even though reproducing the "value addition" would've been easy with a straightforward algorithm and the raw data, whereas going back to the originals is now impossible.
you will continue to gullibily believe the people who tell you those things
What "the people" told me — that 89% of weather stations were incorrectly positioned — is undeniably true. Police presenting evidence collected this sloppily would have their case thrown out from court, and rightly so. Yet, you wish me to believe you, that some algorithms can correct the sloppiness? Just how gullible do you think I am?
That said, my post you replied to was modded down one notch at about the same time your reply appeared — the pattern I've been noticing before... You would not have a collaborator here, would you? Someone helping you "fight denialists" to "save the planet"?
Anyway, still waiting for a list of successful climate predictions from you... You know the format...
-
Re:Hide the decline
Who is doing the weighting (adjusting) and how? What #define-s do they use in their code? Would they not stop "adjusting" before the results show the trend, which they sincerely believe must be there? See, what is "sold" to the public as objective recordings of scientific instruments are, in fact, results of "adjustments" by unknown programs using unspecified parameters...
How would you know? I'll bet you've never even tried looking for those "unknown programs" and "unspecified parameters".
You can start looking here. There are lots of links to NOAA's methods and reasons for adjusting temperatures and even a couple of graphs that compare adjusted to raw temperatures.
Or you can check out the BEST temperature record which is not funded by the government. This page describes how they process the data set and this page contains links to the code they use to process the data.
No one has destroyed any of the raw data. Some have deleted their copies of the data when they no longer need it.
But I seriously doubt you'll take the time to look into it for yourself and you will continue to gullibily believe the people who tell you those things. Unfortunately for you the real world will continue to respond to anthropogenic influences and if you live long enough you will find many of the things scientists are predicting will come to pass.
-
Re:"modern planes don't just break up mid flight"
Been there, done that.
There is even some company trying to make money by attaching their own weather stations to commercial planes. Too lazy to look it up.
-
Re:National Weather Service
No you don't. The NWS has a link on the radar pages that says "Standard Edition," which allows you to switch to an animated GIF. Also, those radar loops are truly awful and outdated. There seems to be some plan to eventually replace them with a new version of the software, though I haven't seen any progress in that direction in a long time. However, as with most meteorologists, I use the $10 Radarscope app, which is far superior and has far more products. There are definitely some things missing from Radarscope, but it has come a long way from its early versions, is a good product, and is far superior to the NWS site.
-
Re: Polar ice caps might all melt away too...
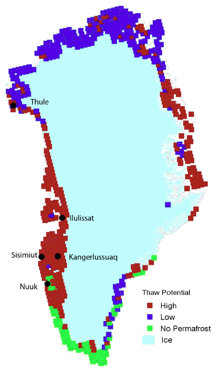
Sorry, but whoever told you that (you didn't cite a source) is incorrect. 238 Gt is indeed the average annual net loss of Greenland ice, April to April.
See under "Total Ice Mass" on NOAA's 2015 Greenland Ice Sheet Report, where it confirms my cited figure. There's also a nice pretty graph where you can see for yourself that the cumulative mass change is more than 3000 gigatonnes over 13 years. I'm sure you can do the math from there.
-
Re: Polar ice caps might all melt away too...
Sorry, but whoever told you that (you didn't cite a source) is incorrect. 238 Gt is indeed the average annual net loss of Greenland ice, April to April.
See under "Total Ice Mass" on NOAA's 2015 Greenland Ice Sheet Report, where it confirms my cited figure. There's also a nice pretty graph where you can see for yourself that the cumulative mass change is more than 3000 gigatonnes over 13 years. I'm sure you can do the math from there.
-
Re:Good
I've never encountered a situation where someone offering a good or service for sale has subtracted my freedom
Your freedom personally? I'm sure I can find someone on the darkwebs that can arrange a "contract" for that.
On a more serious side there are plenty of products that cause harm to people other than the purchaser through pollution.
-
Re:I see the petro-boys are out in force...
Why don't you do some digging before you start making unfounded speculations about what they're doing. They're not scared to reveal the methods they're using because they already do that. Climate science is one of the most transparent sciences out there.
Here's a FAQ page from NOAA that talks about the adjustments and has links to actual published papers that explain why and how the adjustments were made:
Monitoring Global and U.S. Temperatures at NOAA's National Centers for Environmental Information
Or you could try Berkeley Earth. They are independent of the normal funding process. If you click on the Data link then under the Transparency heading you find links to their raw data and their analysis code as well as links to their published papers.
Now really understanding those papers is probably something beyond your capabilities but they're out there.
-
Re: Good news
Which graph [wikipedia.org], has no peaks?
This one: http://www.esrl.noaa.gov/gmd/w... I do want to clarify my earlier statement. Obviously, CO2 has varied in a lot in the past, but looking at your Vostok graph, it has been relatively slow moving for the last half million years, never crossing 300 ppm. Since the industrial age, we've crossed 300 ppm, quickly followed by breaking the 400 ppm level, even though volcanic activity isn't remarkable.
-
Re:Still Not Buying
So you don't care about a decade long series of heat waves that caused the dust bowl. Which resulted is massive repeated crop failures that then resulted in the Great Depression. If your "models" conveniently ignore all data prior to 1960 so that they don't have to explain an actual disaster what credit should be given to predicting worse events in the future? As for your referenced "data". I didn't say there wasn't more CO2, and the chart from the Mauna Loa Observatory is cute. How about the Optical Depth data that shows the SO2 light reflection that is relevant to what I claimed, and to what the article claims to have found. Or how about the GHCN dataset which if you dive in and pull out the Precipitation, and Evaporation you have some interesting problem with Global Warming. One 'Claim' from Global Warming is the increase in heat increases evaporation, increasing humidity, thus increasing rain and Precipitation. The problem is you get this nice little graph that I'm sure you're going to ignore because all these lovely scientists cant possibly be wrong. It doesn't even matter to you that NASA predicted that cycle 24 would be particularly bad. If my analysis is correct, which it is, and nasa's prediction was correct, which it was, then there is a serious problem. It means that the Pan Evaporation mesurments were sensitive enough to pick up a nasty level of solar activity, but not sensitive enough to pick up your phantom global warming since 1950 when the US Geologic Survey fine tuned the measurement process because they needed to know how much evaporated off of lake mead that the prior data was so variant it was unusable. If I'm right, which I am, then that means Global warming from 1950 to 2010 is nothing compared to what the CME's have been doing to us. And this all brought to you by the Sun's northern field deciding to take some time off. So yea your 25% increase in overall CO2 since 1960 is pretty meaningless in the scope of the overall data because if it was It should have moved the evaporation long before 2010.
-
Re:Still Not Buying
then look at this data please http://www.esrl.noaa.gov/gmd/c... . That's clearly not volcanic.
and this data https://en.wikipedia.org/wiki/... . Something IS happening over the scale of decades.
I don't care about AN extreme heat event in the 1930's. I do care if there are extreme heat events in 2035-38, 2045-46, 2048-50, 2053-57.... -
Re:If Sarah Palin had any less brain activity
By the way, NOAA has published their March temperatures. This is the one you were looking for previously but ended up confusing the 2014 report for the current one. I'm afraid it doesn't do much to bolster your side of our bet:
"The combined average temperature over global land and ocean surfaces for March 2016 was the highest for this month in the 1880–2016 record, at 1.22C (2.20F) above the 20th century average of 12.7C (54.9F). This surpassed the previous record set in 2015 by 0.32C / (0.58F), and marks the highest monthly temperature departure among all 1,635 months on record, surpassing the previous all-time record set just last month."
-
Re: Semantics
Karmashock said:
"1. The world is warming."
Correct. However, on the same basis that 'the science is never decided' he should be saying 'current evidence and best interpretation is that the world is warming'. This is 'semantics' after all.
"2. The seas are rising."
Correct. And same comment as above.
"3. The climate is changing."
Correct. As above.
"4. The rate of sea level rise over the last 200 years has remained pretty consistent which argues against human activity having any impact on sea level increases."
Incorrect. See http://oceanservice.noaa.gov/f.... On the best science (see above) there is no evidence that sea levels rose from 0AD to 1900. Since 1990 best science shows sea levels rising 0.04 to 0.1 inches per year, more accurate satellite data shows sea levels rising
"5. Linking global temperature to human activity is very difficult. We have evidence of the temps going up and down over millions of years. And the current temps are not inconsistent with what they might have been with no humans at all."
Incorrect. This is the same argument used to say that we don't know that smoking causes lung cancer. It plays on the 'correlation is not causation' argument to say we don't know things we do know. Richard Muller, being unconvinced of the climate change arguments, set up his own non-profit institute (BEST) and did his own statistical study of the temperature record. He showed that the world is indeed warming and that on best science it can only be accounted for by increased CO2 in the atmosphere. He eliminated volcanoes and solar activity.
"6. I don't think there is anything magical about CO2 that makes it more inclined to cause problems in our atmosphere than anything else. I have looked at the light spectrum absorption patterns and compared them to other common gases in our atmosphere and nearly everything in that spectrum is overlapped by other spectrums of more common gases such as water vapor. As such, I question the relevance of CO2 in this discussion at the current concentrations of the gas."
Incorrect. This is worse than incorrect, it is irrelevant as stated. It does not matter what someone thinks, science is based on evidence, prediction and explanation. The absorption argument is a long standing piece of pseudo-science that has been debunked many times. It is indeed true that water vapour is a very significant greenhouse gas. But radiative transfer theory, exceptionally well verified by experiment, is excellent at explaining all the known facts about the greenhouse effect. Water vapour exists in the lower atmosphere and almost not at all in the upper atmosphere. CO2 however, rises through the lower atmosphere to have an increasing presence in the upper atmosphere as human activity increases its emission. The height at which atmospheric radiation dominates convection determines the amount of radiation emitted by the planet. We now know that increasing CO2 concentration raises this point reducing radiation and causing the greenhouse effect. Best scince now agrees that doubling CO2 concentration in the atmosphere causes about 3.7 watts per square metre of extra radiation across the surface of the earth. There is no concensus on the amount of feedback present that reacts to this extra radiative driving but all the science is pointing to the sensitivity being higher than conjectured. This sensitivity, not the greenhouse effect, is the final last refuge of skeptics who maintain scientific credibility and it is fast dissapearing.
"7. The lab experiments that showed that CO2 was a green house gas are misleading in several particulars. First, any gas is a green house gas. Hydrogen can be a greenhouse gas. Helium can be a greenhouse gas... and so on. The experiments also did not account for water vapor in the chamber. The air was desiccated. I'd love to see the difference in energy absorption of two gas samples... one that contains what we think our atmosphere -
Re:Semantics
At U.S. Climate Reference Network (USCRN), the second link on the page, Quality Controlled Datasets which contains the links for Monthly, Daily01, hourly02 and subhourly01 datasets, there is also links for FTP access; seemed pretty clear to me, sorry it was over your head, I'll leave the other for you to practice on.
-
Re: Look outside
-
Re: Look outside
-
Re:Millenials
Link to which the GHCN data from NOAA, or the source code and analysis that you can easily do for yourself.
-
Re:Semantics
-
Re: Look outside
Nope.
If you've got a point to make, try citing some genuine data.
Et tu, Brute? no mention of minimum or maximum temperatures, only the average of the "average", everybody should know an average of the averages is statistical bullshit;
Definitions for the data Preliminary Climate Data(Form F-6) define
Maximum temperature. This is the highest temperature (F) recorded for the calendar day.,
Minimum temperature. This is the lowest temperature (F) recorded for the calendar day,
Average temperature. The sum of the previous two columns, divided by 2, and rounded, gives the value for this column.
Understanding the Preliminary Monthly Climate Data (WS Form F-6)likewise no mention of adjustment methodologies, data gridding, or overall quality of the measurement; Hell they didn't even give confidence levels!
-
Re: Look outside
Nope.
If you've got a point to make, try citing some genuine data.