 Slashdot Mirror
Domain: skepticalscience.com
Stories and comments across the archive that link to skepticalscience.com.
Comments · 1,449
-
You're an idiot WindBourne, more came from USA
Individual carbon dioxide molecules have a short life time of around 5 years in the atmosphere. However, when they leave the atmosphere, they're simply swapping places with carbon dioxide in the ocean. The final amount of extra CO2 that remains in the atmosphere stays there on a time scale of centuries.
You're a bit thick so again, CO2 remains in the atmosphere a long time
This means that once in the atmosphere, carbon dioxide can continue to affect climate for thousands of years.
So it isn't just last years CO2 emissions that are warming Canada.
This is a much more appropriate timescale
If we extend our timeline back to 1750 and total up how much CO2 each country has emitted to date, we calculate each nation’s ‘cumulative emissions’.
If we fast-forward to the accumulated totals we see today, the US and Europe dominate in terms of cumulative emissions. China’s rapid growth in emissions over the last few decades now makes it the world’s second largest cumulative emitter, although it still comes in at less than 50% of the US total.
So in fact America is responsible for over twice as much CO2 as China.
But wait it gets better.The key drawback of measuring the total national emissions is that it takes no account of the nation's population size. China is currently the world’s largest emitter, but since it also has the largest population, all being equal we would expect this to be the case. To make a fair comparison of contributions, we have to therefore compare emissions in terms of CO2 emitted per person.
Let's just say, per person American's have been, and still are extremely bad.
Let's look here starting in 1950 to match the timescale in the summary and report. You can slide it yourself to see that the US is bright red on the map for every year and China barely breaks into the oranges. America's CO2 per person is over double China's even now. And don't forget you started at 16 tonnes when China was at less than 1.And all of that says nothing about how laughably inaccurate your 'climate modelling' is. Blaming China because of the wind patterns LOL. This is just you not even using the correct data.
You are a complete joke on this topic WindBourne. -
Re:where is all that CO2 over Canada coming from
Individual carbon dioxide molecules have a short life time of around 5 years in the atmosphere. However, when they leave the atmosphere, they're simply swapping places with carbon dioxide in the ocean. The final amount of extra CO2 that remains in the atmosphere stays there on a time scale of centuries.
You're a bit thick so again, CO2 remains in the atmosphere a long time
This means that once in the atmosphere, carbon dioxide can continue to affect climate for thousands of years.
So it isn't just last years CO2 emissions that are warming Canada.
This is a much more appropriate timescale
If we extend our timeline back to 1750 and total up how much CO2 each country has emitted to date, we calculate each nation’s ‘cumulative emissions’.
If we fast-forward to the accumulated totals we see today, the US and Europe dominate in terms of cumulative emissions. China’s rapid growth in emissions over the last few decades now makes it the world’s second largest cumulative emitter, although it still comes in at less than 50% of the US total.
So in fact America is responsible for over twice as much CO2 as China.
But wait it gets better.The key drawback of measuring the total national emissions is that it takes no account of the nation's population size. China is currently the world’s largest emitter, but since it also has the largest population, all being equal we would expect this to be the case. To make a fair comparison of contributions, we have to therefore compare emissions in terms of CO2 emitted per person.
Let's just say, per person American's have been, and still are extremely bad.
Let's look here starting in 1950 to match the timescale in the summary and report. You can slide it yourself to see that the US is bright red on the map for every year and China barely breaks into the oranges. America's CO2 per person is over double China's even now. And don't forget you started at 16 tonnes when China was at less than 1.And all of that says nothing about how laughably inaccurate your 'climate modelling' is. Blaming China because of the wind patterns LOL. This is just you not even using the correct data.
You are a complete joke on this topic WindBourne. -
You're an idiot WindBourne That's not how it works
Individual carbon dioxide molecules have a short life time of around 5 years in the atmosphere. However, when they leave the atmosphere, they're simply swapping places with carbon dioxide in the ocean. The final amount of extra CO2 that remains in the atmosphere stays there on a time scale of centuries.
You're a bit thick so again, CO2 remains in the atmosphere a long time
This means that once in the atmosphere, carbon dioxide can continue to affect climate for thousands of years.
So it isn't just last years CO2 emissions that are warming Canada.
This is a much more appropriate timescale
If we extend our timeline back to 1750 and total up how much CO2 each country has emitted to date, we calculate each nation’s ‘cumulative emissions’.
If we fast-forward to the accumulated totals we see today, the US and Europe dominate in terms of cumulative emissions. China’s rapid growth in emissions over the last few decades now makes it the world’s second largest cumulative emitter, although it still comes in at less than 50% of the US total.
So in fact America is responsible for over twice as much CO2 as China.
But wait it gets better.The key drawback of measuring the total national emissions is that it takes no account of the nation's population size. China is currently the world’s largest emitter, but since it also has the largest population, all being equal we would expect this to be the case. To make a fair comparison of contributions, we have to therefore compare emissions in terms of CO2 emitted per person.
Let's just say, per person American's have been, and still are extremely bad.
Let's look here starting in 1950 to match the timescale in the summary and report. You can slide it yourself to see that the US is bright red on the map for every year and China barely breaks into the oranges. America's CO2 per person is over double China's even now. And don't forget you started at 16 tonnes when China was at less than 1.And all of that says nothing about how laughably inaccurate your 'climate modelling' is. Blaming China because of the wind patterns LOL. This is just you not even using the correct data.
You are a complete joke on this topic WindBourne. -
Re:Course not!
the research could actually go towards helping prove that APGW is real, rather than just a theory.
I disagree with your choice of words, as "just a theory" makes it sound as if it's someone's hunch/idea/opinion/guess/hypothesis. A scientific theory is something very different, and presents both explanatory and predictive claims that have been tested and stood up to falsification attempts. A scientific theory can never be "proved," as those hard statements are reserved for mathematics and philosophy. Religious folk would muddy the waters with the same "just a theory" argument about the theories of evolution and heliocentricism, and it's very misleading.
It may also help identify better metrics so we can make an accurate prediction as well... since we know they have only failed in all of their models.
I must disagree here as well. Climate models tend to do pretty well at making predictions that are subsequently backed up by observations. See https://www.skepticalscience.c... for a primer on the topic, along with some illustrative videos.
-
Re:Well that 9 out of the last 0 apocalypses
Climate scientists have been very consistent that there will be some sea level rise, a big sea level rise is really bad, and that there's a lot of uncertainly about sea level rise, there might be a little or there might be a lot. It's just tough to model.
They haven't been very consistent. James Hansen, a very well respected climate scientist was predicting Manhattan would be under water.
That quote is wrong. I wouldn't quite call it a fake quote because the author was trying to be accurate, he just got a number wrong and forgot a critical piece of context.
Scientists are people, and sometimes they get carried away in the emotion of the moment, just like any other people. That's why we have reproducibility, to counter-act the effect of emotion. Reproducibility is the core of science.
On the topic of emotion, I've seen a lot of fake quotes on all sorts of subjects and I'm not sure I've ever fallen for one.
The reason is they're really easy to avoid.
Fake quotes are popular because they contradict the accepted persona of the person, for instance if a person is a Liberal the fake quote will be a Trump endorsement, a famous atheist will endorse religion, and if they're a climate scientist it will be an extreme prediction or admission of malfeasence.
But that also makes them really easy to spot, when you see a quote that's too good to be true all you need to do is check the sources and you'll figure out if it's real.
You got caught by that fake Hanson quote. Why is it?
Is your model of James Hansen and other climate scientists wrong, so you couldn't recognize a prediction they wouldn't give?
Or were you just too eager to use the quote that you didn't want to look too closely?
-
Re:Are you sure haven't already reached 1.5C?
This image charts global mean temperature vs. GHG forcing. You can see that forcing was still small, but already rising by 1900. Natural variability dominates the early part of the chart. That natural variability is largely cyclical though and nets to about 0C over the full period.
-
Re:Are you sure haven't already reached 1.5C?
You do realize there was a little Ice Age at the end of the 17th C. So you're comparing the trough of a wave with a crest.
The LIA had ended by the second half of the 18thC when the Berkley temperature analysis starts. So there is no trough included in this graph.
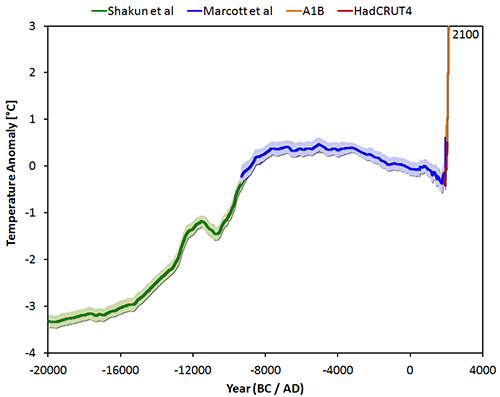
Here's a longer term view if you like. Notice the 6000-8000 year trend back into an ice age that was dramatically reversed during the industrial revolution.
-
Re:B..b..but...
The amount of fossil fuels burned 200 years ago was negligible. The warming trend in that era was likely caused by variations in solar radiation, heightened volcanic activity, and changes in ocean circulation.
The amount of non-fossil fuels burned 200 years ago was not negligible. The fuel for steam engines may have been renewable, but it was not renewed. The vegetation removed in cropland conversion wasn't all used as building materials either. Fossil fuel consumption was dwarfed by land use emissions until the second half of the 20th century, while the latter started adding appreciable CO2 to the atmosphere in the second half of the 19th century.
-
Re:And you're an idiot listening to denier echoes
You're wrong. The original quote was from the WWF, and they stated - with no factual basis - 2035. And the IPCC took it at face value, and admitted as much.
-
Re:Daily Bullshit
-
You are so right!
Here, the models have understated the problem. In reality, observed sea level is tracking at the upper range of the model projections.
Those stupid models are understating the problem! Totally worth ignoring!Now, I'm going to buy my 2018 leftover 500 cubic INCH (No unAmerican "liter" bullshit) V8 Pick-up truck and drive my all American Beef fed fat ass around! Global Warming is a hoax by the Chinese who want us to all be converted to Tofu eating Vegan Liberal fags who drive EVs to be charged by - get this - Chinese made solar panels!
-
Re:Cow news and selective hearing
Err, meat produces about 4 times as much CH4 as rice. Both need to be tacked source. What's the problem with feeding them a bit of seaweed, that's been done for centuries in seaside farms anyway!
-
Wrong - CO2 emissions from humans are the cause
Humans are indeed the cause of climate change. I'll just leave this right here.
Your proposed solution of just moving to higher ground or putting our houses on stilts is just not realistic. Temperature and sea levels are not the only things that will change. We will also see shifts in the location of weather. Habitable and arable land will shift and dwindle. Not all crops can simply be moved and cultivated elsewhere.
Recall what has happened in human history when a resource has become scarce: war.
-
Re:Bueno! Excellente'
It's a lie or at least bad math to say that accumulated cyclone energy has been trending downward for 30 years. It's rather flat overall for the last 30 years, and has decreased over the last 10 years due to natural variation:
https://www.skepticalscience.c...
I know the deniosphere loves to try to fit declining curves against this short-term spiky but long-term flat graph, but this technical number is not that important and the only one that doesn't show a clear upward trend. Hurricane frequency is steadily increasing:
https://phys.org/news/2013-03-...
Also hurricane intensity and power dissipation are sharply increasing:
https://www.skepticalscience.c...
These numbers are more practically relevant than accumulated cyclone energy, and you can see it where the rubber hits the road: in the clear upward trend in storm & flood damage costs, even against our improving preparedness:
https://phys.org/news/2017-11-...
Also while strong tornadoes are decreasing and tornado energy is flat, tornado count is steadily increasing:
-
Re:Background noise
Worse, better... these are usually compared against the averages. In reality, everything - temperature estimates, predictions, ocean levels - have pretty large error ranges. For the most part, actual measurements are falling within the error bars of the predictions.
-
Re: What is the correct temperature
Good description of the CO2 GHG effect. One molecule in 2500 can make a big difference. If folks want their mind blown they should consider that the ozone hole was caused by molecules with concentrations of a few in a trillion.
Just to support the IPCC predictions you mentioned:
https://www.skepticalscience.c...
They've actually been pretty quantitatively accurate since 1990 (in addition to qualitative).
-
Re:What is the correct temperature
STFU.
-
Re:The glaciers are a buffer
Here is some math:
https://www.skepticalscience.c...
The amount of surplus energy going into the ice is tiny.
-
Re:See old school Catholic Church
The IPCC is a political organization. They're therefore selling something. Therefore, they automatically get dismissed as political propaganda - and rightly so - by skeptics.
https://skepticalscience.com/ reads like political propaganda. E.g., this https://skepticalscience.com/a... is a straight up political advocacy blog post. Again, any mixing of politics into your source taints it.
We learn early to dismiss as lies any claims that a salesman or politician makes.
Seriously, read through http://talkorigins.org/origins... it's short. Note the tone. Read a link to two of the FAQ page - they're interesting. The most convincing stuff there, BTW, is where they say straight up that some examples of evolution commonly taught in high school are just wrong, and that's why they seem wrong - blame the dumbing down, not the actual science.
But, hey, that would be about actually persuading people, not about pride in tribal belonging, and there's little interest in that.
-
Re:See old school Catholic Church
There has been a huge amount of effort expended on trying to explain the science. That's essentially what the whole IPCC is about. Have you ever tried reading any of the IPCC reports? At a lower level there are web sites like Skeptical Science that essentially does for climate science what the talk.origins FAQ does for evolution. I think the problem is more that you just don't like the answers than that you're getting.
-
So what can you do to help?So, what can you do to help out? There are three major categories of how you can help, personal, political and charitable.
In terms of personal change, you can do a lot. You can eat less meat; meat consumption is a major driver of CO2 production and methane in the atmosphere https://skepticalscience.com/animal-agriculture-meat-global-warming.htm. You can also drive less, walk places or use public transit. If you need to buy a new car, try to buy a hybrid or an electric car. If you own a house, make sure it is well insulated; don't put the air conditioner on to any colder than you need to in the hot months, and don't heat it more than you need to during the winter. Consider buying solar panels for your house. All of these are things which not only help the environment, they save you money.
Politically, the primary thing you can do is either donate to or vote for candidates who support dealing with climate change. Much of Europe is doing the right things already regarding this (with the exception of Germany's really bad decision to turn off their nuclear plants). But both the US and Australia currently have governments who are substantially not helping matters. In the US, this means generally one should be voting for Democrats. While there are some Republicans who take climate change seriously like Christie Todd Whitman and Arnold Schwarzenegger they are a functional minority which has been pushed out of the party to a large extent.
The third thing you can do is directly donate to charitable causes which help with renewable energy or otherwise help with climate issues. Everybody Solar https://www.everybodysolar.org/ buys solar panels for non-profits like homeless shelters and science museums. The Solar Electric Light Fund https://www.self.org/ gets solar panels for parts of the developing world; this not only helps the very poorest in the world, it also helps make sure that when Africa's economy comes more online they do so in a way that doesn't immediately involve massive CO2 production. For wind power, I recommend the New England Wind Fund https://www.massenergy.org/the-wind-fund which builds wind in the North East of the US (which currently has very little wind power and can definitely use more). Finally, in terms of immediate effects of CO2 offset per a dollar spent, Cool Earth is by many measures the most efficient way to do so https://www.coolearth.org/. Remember, every little bit helps.
-
Re:1982 to 2016
In order to understand the apparent disparity between past temperature and levels of atmospheric CO2 we must appreciate that CO2 is not the only driver of climate. Other drivers of past climate change include variations in solar output, continental drift, orbital variations (known as Milankovitch cycles), volcanism, and ocean variability. Any conclusions that we draw from a perceived lack of correlation in the climate record between atmospheric CO2 and global temperatures must take into account these factors.
Let's look at the combined radiative forcing from CO2 and sun through the Phanerozoic and see how they line up with global temps. Pretty good match!
-
Re:Nice Scaremongering
It's blips in the noise.
The rate of global heat accumulation is equivalent to about 4 Hiroshima bomb detonations per second. That blip represents over 2.5 billion atomic bomb detonations worth of heat accumulating in the Earth's climate system since 1998, It's a lot of energy.
The wide range of projections arise because warming depends on how much we emit. We can decide to limit emissions and reduce warming. Or not. It's up to us.
-
Re: Techno Salvation
Of course it matters if you want to use it as the basis of your argument. Of course it does not mean that your conclusion can't possibly be correct, but it means that you can't infer that conclusion on the basis that you've presented. You're free to find something different.
If we had long term data with high temporal resolution like we do have for Earth then you could correlate both and look how both correspond to sun spot activity in a similar way. That would be some backup for a hypothesis that external factors play a much bigger role than anything we humans can affect here on Earth.
But with only two data points in 22 years, a presentation of such a complex function over time is practically useless. It's less useful than approximating the values of a sine wave between 0 and 2pi by a line through two distinct points. Sure, it can be fairly accurate around values for 0, and 2pi or pi alone, or maybe pi/2, and 3pi/2. But it will be mostly useless for anything else as an approximation.
I think the 2nd link got lost during copy and paste, because both links lead to the same picture. If I put 'sun spot activity climate' into duckduckgo.com the 4th hit is from scepticalscience.com and leads to this site here: https://skepticalscience.com/s... -
Re: Techno Salvation
It doesn't matter whether we have long term data for Mars, because the same for earth are completely ignored by the IPCC.
Clever guy who can deduct from this graph https://static.skepticalscienc... that CO2 causes global warming.
On the other hand, this graph https://static.skepticalscienc... would suggest much more strongly a correlation between sun spot activity and climate. -
Re:1982 to 2016
In this graph https://static.skepticalscienc... you can clearly see the correlation between temperature and CO2. It's clear that as CO2 goes up, temperature goes with it. Oh, wait...
While in this graph https://upload.wikimedia.org/w... you can clearly see that solar activity has nothing to do with global temperatures. Oh, wait...
Anyway, data proves that the hypothesis that CO2 leads to higher temperatures, because the IPCC says so. (Oh, wait...) -
Re: Techno Salvation
Apparently, NASA scientist, Lori Fenton looked at two different images of Mars taken 22 years apart (1977 and 1999), and determined that there appears to have been a temperature change of 0.65 degrees in between the two images. That appears to be the source of the global warming on Mars myth.
-
Re:Follow the lead of the USA
If you look at the graphs of atmospheric CO2 vs global temperature (whatever that may be) there is not much correlation
Let me guess, you've looked at carefully cherry-picked time windows...
Well actually I looked at the graph with a time window of a few million years, or was it hundreds of millions?
let alone causation.
Helllo? The 1800s called. It's Tyndall and Arrhenius on the line. They want some words with you about the thing called 'greenhouse effect' they discovered.
You forget to mention Fourier.
And yes, a greenhouse effect exists... in a greenhouse.
Greenhouses are those boxes with a transparent lid on top.
The earth's atmosphere has no lid somewhere in the middle. Convection rules up to 10 km height where it ceases to exist due to the low pressure (less than 0.1 bar).It really follows straightforwardly from basic physics.
I've never seen a reputable physics textbook, like Feynman, mentioning (and supporting and explaining) a greenhouse effect on earth's atmosphere.
On the contrary, thermodynamics (Feynman lectures, lecture 40), in the absence of convection, predicts a negative temperature gradient (with reference to height) caused by the difference in kinetic energy of the air's molecules. However, convection in the lower part (below 10 km) of the atmosphere makes the effect unmeasurable.Even coal industry shill Richard Lindzen called people who dispute that carbon dioxide is a greenhouse gas 'a bit nutty'.
I don't need a group of miners decide for me what is physics and what is not, thank you very much.
So let's see, a recently created account by the name of "slazy Rio" that contributed little of value to this community starts executing a Gish gallop of complete bullshit denialist talking points. Are you even trying to not look like a shill/troll ?
I really don't mind whether you consider me a shill, troll or what not. I'm just giving you my formed opinion. I'm not a 'climate denier'. Climate warms up. It always does after an ice age when the sun gets active sun spots again. But after a period, determined by the solar cycles, not the CO2 that we produce, it cools down again, and if you watch the solar activity recently (barely there is) you'd realise that we're heading toward a cool period again.
And, oh, by the way, did I already mention that human contribution to CO2 is undetectable?
Climatologist (99.7%? Yeah, right) Murray Lewis Salby pointed out this out in one of his lectures. If you look at the atmospheric CO2 graphs of the last century and correlate them with the anthropogenic CO2 emissions, you'll see that even in the 1920's-30's, where the global economy--and with that the carbon emissions--literally tanked, but the rate of rise of atmospheric CO2 didn't bulge. Also in the late 1900's, where emissions really took off, the rate of rise in atmospheric CO2 didn't bulge either.
This isn't really a confirmation of the AGW theory but can be explained with Henry's law, which edicts the vapor/liquid equilibrium of gases (CO2 is a gas) and liquids (like deep-sea water).
Due to our earth still coming out of the latest ice age, and the very slow, -
Re:Follow the lead of the USA
Oh wonderful, yet another post with a generous grab from the top-50 long-debunked climate myths. A bit like a Gish gallop by the looks of things, so I'm not going to give you a lot of my time. I'll just respond to a few of the more egregious talking points you bring up, and people can look up the rest at http://wikipedia.org/ and http://skepticalscience.com/
If you look at the graphs of atmospheric CO2 vs global temperature (whatever that may be) there is not much correlation
Let me guess, you've looked at carefully cherry-picked time windows in order to ignore the blatantly obvious fact that both are steadily going up.
Sure, there's no year-to-year correlation; the temperature data is so (inherently) noisy that only an idiot would expect to see that. But over a relevant time span, yes, yes, it's going up.let alone causation.
Helllo? The 1800s called. It's Tyndall and Arrhenius on the line. They want some words with you about the thing called 'greenhouse effect' they discovered. It really follows straightforwardly from basic physics.
Even coal industry shill Richard Lindzen called people who dispute that carbon dioxide is a greenhouse gas 'a bit nutty'.
So let's see, a recently created account by the name of "slazy Rio" that contributed little of value to this community starts executing a Gish gallop of complete bullshit denialist talking points. Are you even trying to not look like a shill/troll ? -
Re:Early Eocene
First you're claiming that "They treat this shit like a religion. They can cite verses and CO2 number etc. but cannot and will not accept that they could be wrong in any way."
But then you bring up: "In fact, 50 years ago (nothing on a global climate scale) scientists were worried about GLOBAL COOLING."
So are they wrong for not considering alternatives? Or wrong for considering alternatives?
And just for reference, although global cooling was considered by the scientific community there was no overall consensus about it. Some scientists brought up the possibility and newspapers blew it out of proportion because the idea of glaciers suddenly overtaking New York made good copy. Once some more scientists got involved and the hypothesis was checked the idea was abandoned. And look, since then temperatures have continued to rise instead of dropping.
Here's a reference.
"Does someone really need to compile a list of these similar predictions from the past 40 years and paste them in every subsequent prediction for people to understand?"
Sure, we can do that. Here you go!
Note that the first prediction was right on the nose, which is probably just a coincidence, given how little information they had to go on at the time. Of the eight other predictions five of them overestimated the amount of warming by 2016 by amounts ranging from 8% to 30%, while the other three _under_estimated the amount of warming, by amounts ranging from -14% to -28%.
Also note that two of the five that overestimated the amount of warming, in fact the two that were off by 30%, the largest amount, did so in part because they believed there would be more CO2 in the atmosphere now than there actually is. Why is there less CO2 than they predicted? Because although the amount of CO2 we release into the atmosphere is continuing to increase, the rate at which it increases has slowed down slightly. And part of the reason for that is because of the warnings of scientists like those writing these reports, so it's a little bit of a Y2K situation.
"You morons think energy companies are against this?"
We don't think, we know. Or at least we know they were in the past. It's well documented that the energy companies spent large amounts of money on lobbyists and PR trying to stave off any consequences for as long as possible. Sure, they're going to try to continue to make money now that they've (mostly) been forced to accept the truth, but they were much happier just continuing to collect money without having to pay for new infrastructure. (Building new infrastructure costs money. Those costs must be passed on to the consumer. Increased prices reduces demand. Basic economics.) Funnily enough, the rate at which the seem to be building new infrastructure seems to generally follow the rate at which renewable energy has become cheaper to produce than fossil energy. -
Re:And we still hear how global warming is a hoax
I say this because when I was a kid, the big thing was the coming ice age in our life times preached by the science of the times.
That's largely false. The press may have made a big deal out of it, but there was no scientific consensus for global cooling or a coming ice age.
-
Re:And we still hear how global warming is a hoax
What a load of crap.
There never was anything even close to a consensus among scientists about global cooling. I\m sick and tired hearing that argument being brought up time after time.
https://skepticalscience.com/7... -
Re: Ouargla, Algeria
Actually, "normal climate variability" or "a heat wave" explains it nicely.
That's very unspecific, and goes against climate scientists' overwhelming consensus, specifically that recent calculations concludes that the Earth is warming orders of magnitude faster than from natural forces. Neither "normal climate variability" nor "heat waves" seems to account for past data, nor is able to predict future trends better than AGW.
High daytime temps are NOT part of the catastrophic AGW prediction set, you know. The theory is that NIGHTTIME temps will increase, not daytime, so the overall average goes up.
And when they talk about "consistently higher" temps, they're literally talking about fractions of a degree in most cases.
I couldn't find a source that only night temperatures will increase -- what's yours? The closest I could find was this article explaining why night-time temperatures are warming faster than day-time temperatures. They're both still warming though.
By the way - there have been a few surveys of weather stations, and the vast majority of them have problems, mostly caused by either encroaching cities (the Urban Heat Island effect) or bad instrument siting. Very, very few stations have consistent records, with relatively untouched siting. The ones that do? Well, they don't show the AGW trend that the others do... and the response by AGW scientists is to adjust the ones that aren't showing the increase (AKA "throwing out the good data so the bad data looks better").
Try this site, for a bit of data that will shock you...
http://www.surfacestations.org/
You do not take into account how that data is used and verified. A quick search presents convincing skeptical arguments that these measurements are still reliable as a whole, as they show the same corroborating trends whether they're urban or rural, or lumped into random groups (which would emphasize any inaccuracies from placement of stations):
https://skepticalscience.com/s...
https://skepticalscience.com/B...
https://www.youtube.com/watch?... (5 min video -- UQx DENIAL101x 2.4.1.1v2 Building a robust temperature record) -
Re:That is utterly false
But you do know that people only exhale as much CO2 as the food they eat took from the atmosphere?
I don't tend to "know" things that are false.
CO2 exhalation is a result of a chemical process in our body, and has no relation whatsoever to the amount of whatever we consumed itself consuming CO2. I mean, how on earth to you square your insane belief system with someone on an all-meat diet, where a cow itself exhales CO2 and then we kill the cow and eat it and ourselves produce CO2 in turn? What about someone on an all-water diet for a week or two who continues to exhale CO2?
Talk about anti-science...
If that was true, and every one of the trillions of life forms on earth generated more CO2 by exhaling than it consumed indirectly by consuming other plants or life forms, life would have exhaled itself into extinction by climate change a long, long, long time ago.
All the carbon in our body comes either directly or indirectly from plants, which took it out of the air only recently
https://www.skepticalscience.c... -
Re:Alarmist much?
wrong, article is equivalent of saying 50 +/- 50 soldiers are coming.
The article says 1330 to 4110.
Why make up numbers when they're right there?
You should be able to tell that since 2720 is larger than 1390 that zero can not fall into the range of 2720 +/- 1390.
Since this is basic addition and subtraction, it's practically inconceivable that you screwed it up instead of simply choosing to lie to people. Of course, if you did screw it up, then you are so incompetent that you should think long and hard about whether you should post anything anywhere ever again. It might be for the best if you simply destroyed your keyboard, so you can prevent yourself from giving those nice Nigerian Princes all the money that you have left.
in other words, it is useless bullshit.
No as demonstrated above, you are useless bullshit.
credible studies show antarctic ice *growing*,
I'll believe NASA over *nature* alarmist hippies any day of the week
If you think Nature is run by "hippies" then you're both ignorant and delusional.
-
Re:Move along nothing to see here...Yes, 8-5 ka was a warm period (and the evidence is not definitive whether that period was warmer than today). The issue is the fast rate of change. See the Marcott wheelchair.
the rates of global warming from 1860-1880, 1910-1940 and 1975-1998 were identical
What Phil Jones said was, "Temperature data for the period 1860-1880 are more uncertain, because of sparser coverage, than for later periods in the 20th Century. The 1860-1880 period is also only 21 years in length. As for the two periods 1910-40 and 1975-1998 the warming rates are not statistically significantly different (see numbers below)."
The temperature record of the 19th century is not considered particularly precise among experts who study it, nor is a 20-year trend considered important by climate experts because ocean fluctuations lasting several years can affect the trend over such a short time.
But if we assume the early records are accurate, the temperature increase from 1910-1940 can be explained as a combination of (1) human greenhouse gas emissions, as we were indeed burning them before 1960, (2) volcanic activity much lower than average (stratospheric aerosols from volcanoes cause cooling, thus their absence causes warming), (3) increasing average solar irradiance in that time frame, and (4) internal variability, such as differences in ocean currents. -
Re: the solution is not a left vs right power stru
Correction: the peak insolation at the top of atmosphere (1361 W/m^2) has been known to trend by 0.6W/m^2 over periods of several decades, not the average insolation. See insolation graph.
-
Re:liberal judge
When you only ask one side to provide proof of something, that's bullshit.
Human-caused global warming has been predicted by scientists since Svante Arrhenius in 1896 (See this list of early global warming papers).
Many of these papers were produced during the global cooling trend before 1975. Climate scientists predicted global warming before it happened and now over 90% of climate scientists are in agreement on the subject. Numerous studies show humans as the cause of recent global warming. Yet you think mainstream scientists haven't made their case?Not only is CO2 a weak greenhouse gas
Until you add feedback mechanisms such as the increased absolute humidity that corresponds to increased temperatures (water vapor is a strong greenhouse gas). Then it has a much greater effect.
human production of it doesn't account for the majority of it.
Sort of. We started with 280 ppm in the atmosphere, now we're up to 410 ppm, so I guess humans are responsible for less than half!
However I assume you are referring to the myth that humans release less than 4% of all the CO2 that is "released" each year.
In a very twisted way, this is correct. A glass of water evaporating in a room with 90% humidity does not just "release" water molecules, it also absorbs them from the air. But if someone uses this fact to argue that water glasses will fill up in a humid room, there is something wrong with that, isn't there?
Similarly the ocean "releases" more CO2 every year than humans, but it absorbs more than it releases. Drawing attention to CO2 coming out of the ocean while completely ignoring the CO2 going into the ocean is highly misleading. The ocean's pH is dropping, why do you think that is?If you want to get into secondary factors, then plain ol' water vapor beats out CO2 by a country mile.
Humidity depends on environmental conditions. When temperatures increase, the water vapor concentration (absolute humidity aka vapor pressure) also increases.
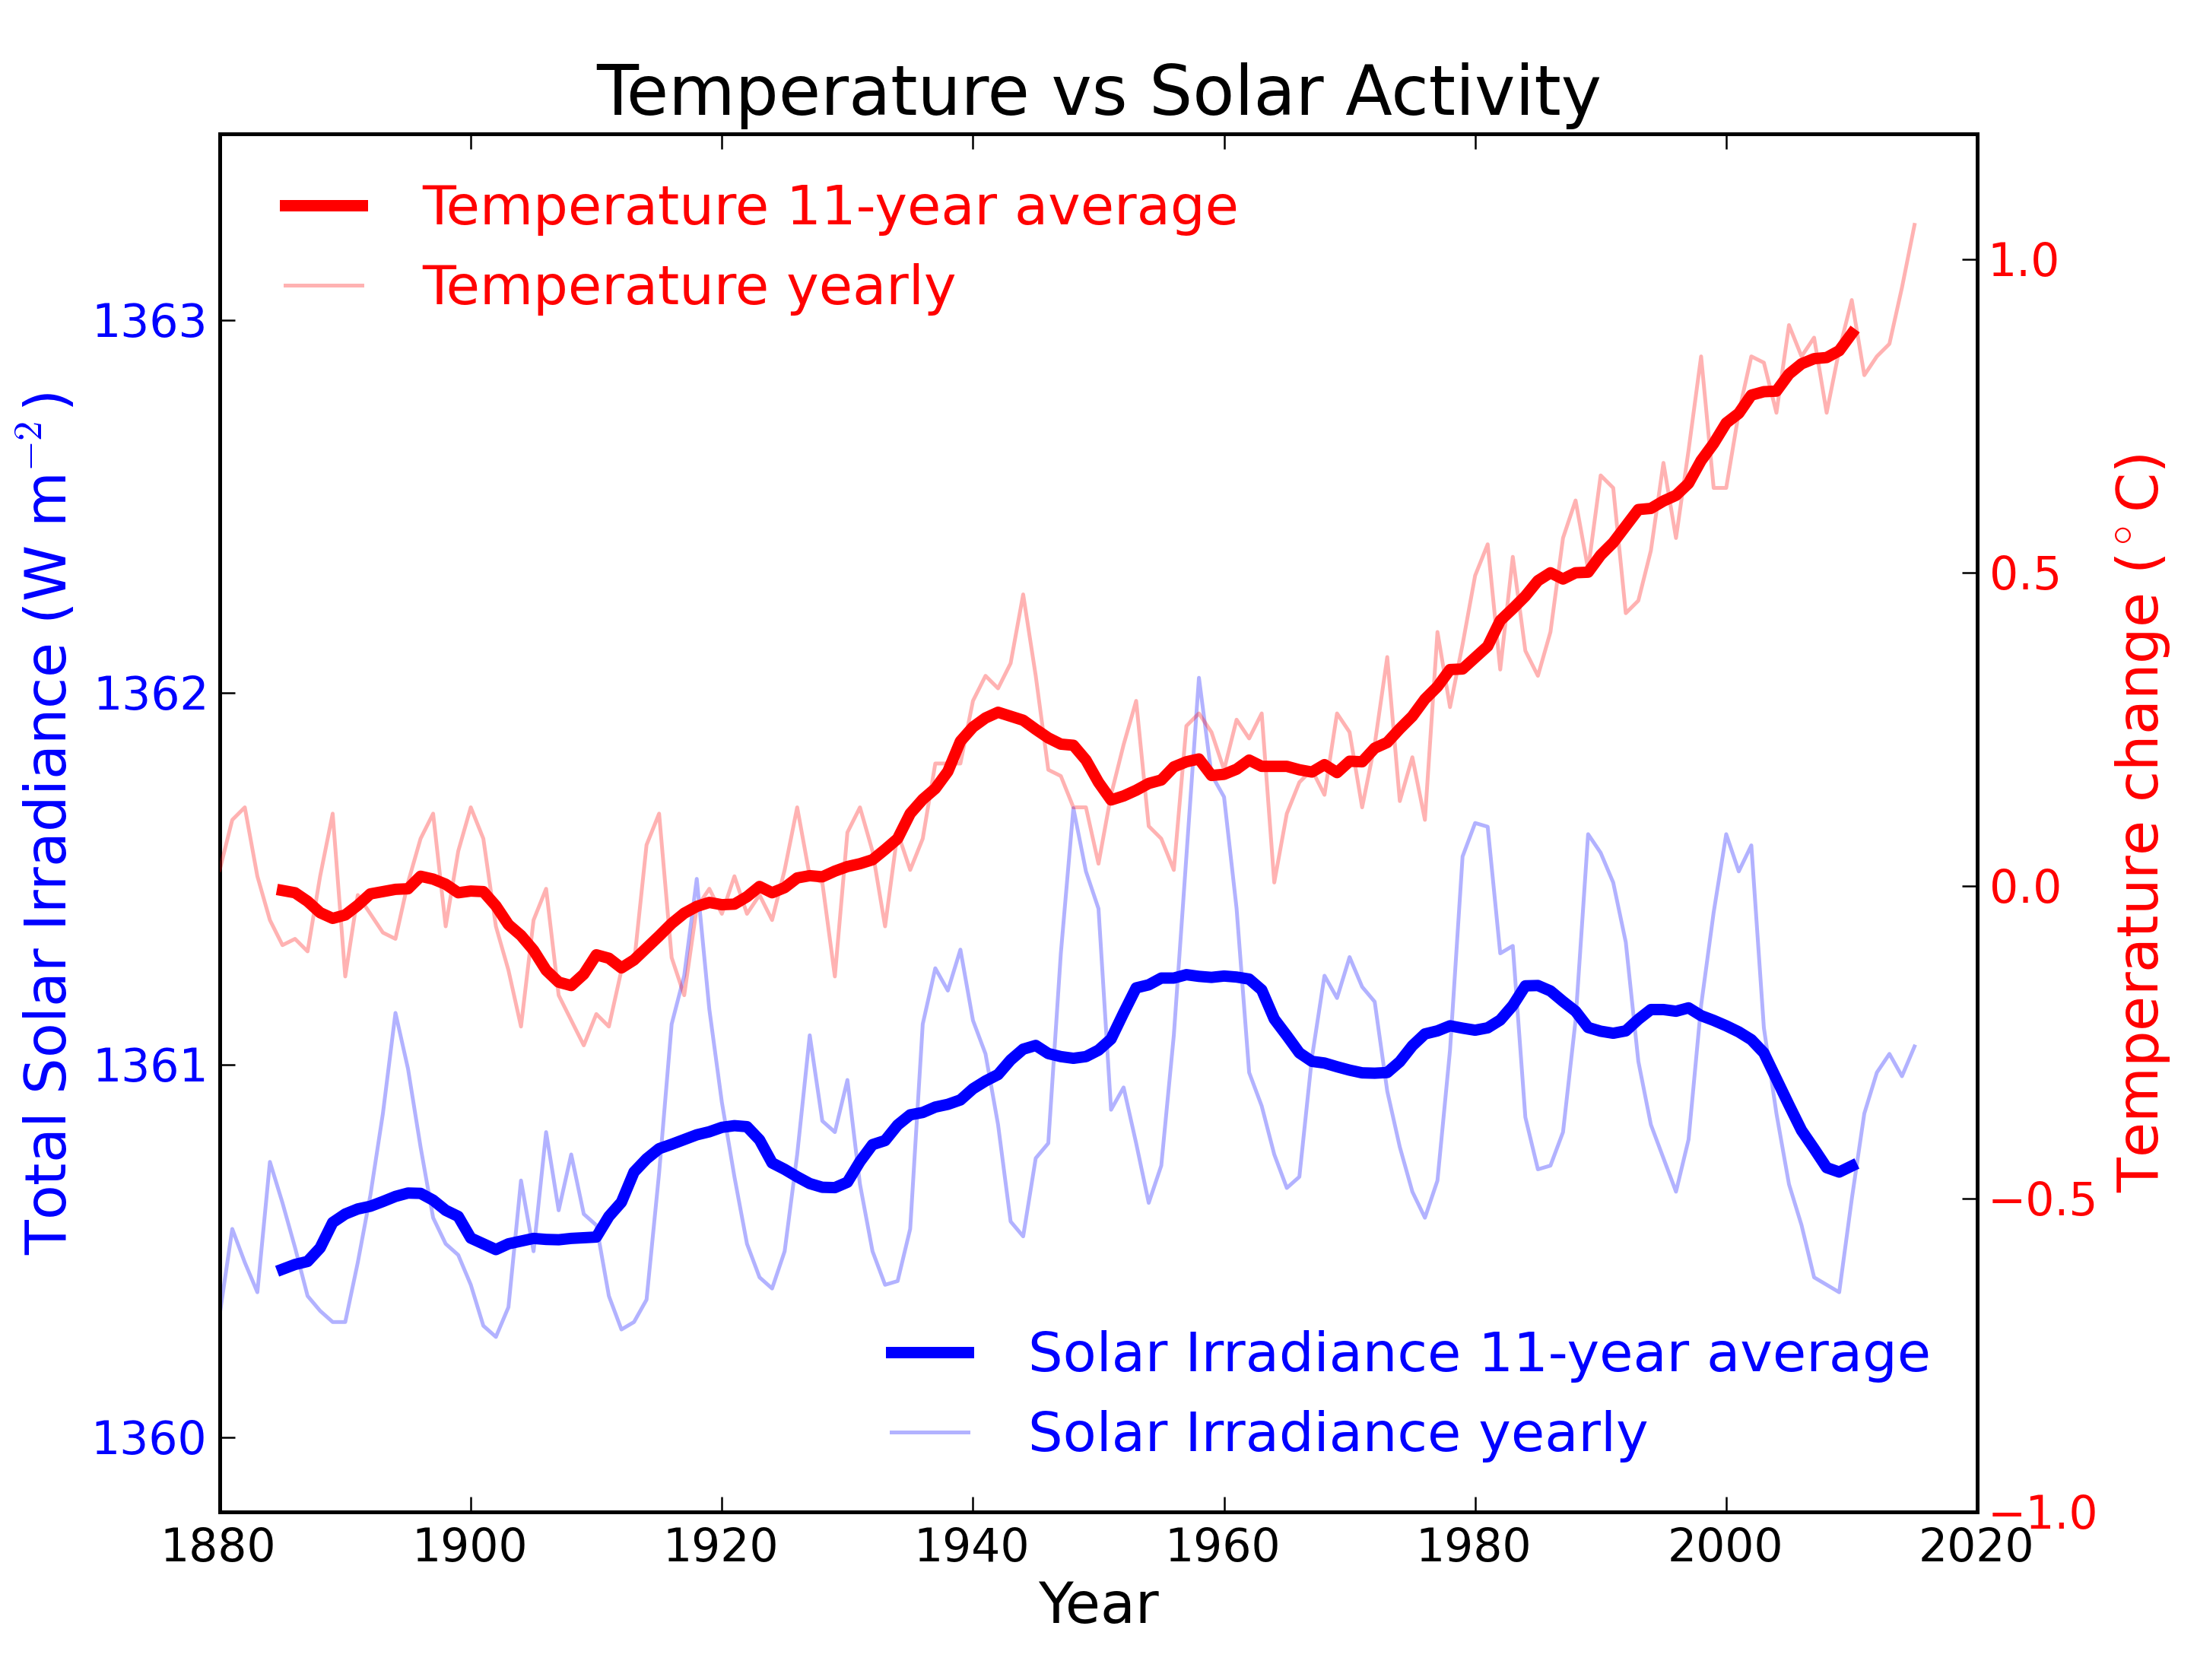
The primary cause of warming and cooling is the fucking sun, by far.
The 11-year average of solar irradiance has varied by only about 0.1% over the last century and solar output has decreased in recent decades.
-
Re:liberal judge
When you only ask one side to provide proof of something, that's bullshit.
Human-caused global warming has been predicted by scientists since Svante Arrhenius in 1896 (See this list of early global warming papers).
Many of these papers were produced during the global cooling trend before 1975. Climate scientists predicted global warming before it happened and now over 90% of climate scientists are in agreement on the subject. Numerous studies show humans as the cause of recent global warming. Yet you think mainstream scientists haven't made their case?Not only is CO2 a weak greenhouse gas
Until you add feedback mechanisms such as the increased absolute humidity that corresponds to increased temperatures (water vapor is a strong greenhouse gas). Then it has a much greater effect.
human production of it doesn't account for the majority of it.
Sort of. We started with 280 ppm in the atmosphere, now we're up to 410 ppm, so I guess humans are responsible for less than half!
However I assume you are referring to the myth that humans release less than 4% of all the CO2 that is "released" each year.
In a very twisted way, this is correct. A glass of water evaporating in a room with 90% humidity does not just "release" water molecules, it also absorbs them from the air. But if someone uses this fact to argue that water glasses will fill up in a humid room, there is something wrong with that, isn't there?
Similarly the ocean "releases" more CO2 every year than humans, but it absorbs more than it releases. Drawing attention to CO2 coming out of the ocean while completely ignoring the CO2 going into the ocean is highly misleading. The ocean's pH is dropping, why do you think that is?If you want to get into secondary factors, then plain ol' water vapor beats out CO2 by a country mile.
Humidity depends on environmental conditions. When temperatures increase, the water vapor concentration (absolute humidity aka vapor pressure) also increases.
The primary cause of warming and cooling is the fucking sun, by far.
The 11-year average of solar irradiance has varied by only about 0.1% over the last century and solar output has decreased in recent decades.
-
Re:liberal judge
Sorry, but almost everything you wrote is wrong.
When you only ask one side to provide proof of something, that's bullshit.
That's true, however...
When the one side making the absurd claims is the side that has not conducted any repeatable experiments on the matter, has not been able to accurately predict things, and keeps revising both their models and data points in order to fit their hypothesis, yet they're the "accepted" side, that's bullshit.
I absolute agree with you that Pruitt needs to produce some evidence to support his position. But, of course, in you thought you were attacking climate scientists. However, nothing you wrote actually applies to them. They provide the data, the methods, the models and the repeatable experiments for virtually everything they do. Curiously, however, your statements apply well to every single alternative theory that tries to explain the observed facts of climate change. None of them have been able to survive even casual scrutiny from interested reviewers.
But the most bullshit thing is not realizing the simple fact that carbon dioxide is absolutely not the primary cause of global warming.
Except, of course, that it actually is. It's the primary driver of global warming because of the volume and longevity of CO2 produced by human activity.
Not only is CO2 a weak greenhouse gas, human production of it doesn't account for the majority of it.
The majority of the total CO2 in the atmosphere? That's true, for now, since pre-industrial levels are estimated to have been lower than 290 ppm and we're currently around 411 ppm. However, human activity has produced all of the increase in CO2 since pre-industrial levels. We know that because natural factors have been acting as a CO2 sink and absorbing more CO2 than they release. CO2 is a relatively weak CO2 gas but again we produce a lot more of it and it last a very long time in the atmosphere so it's the primary driver of the change, and then it is amplified because a little bit of warming from CO2 increases the average amount of water in the air which drives further warming. It's similar to pennies, they might not be worth much individually, but a million pennies is worth a lot more than a dozen hundred dollar bills.
The primary cause of warming and cooling is the fucking sun, by far.
No, it's not. The sun has cooled slightly while the average temperature continues to rise, and that's a good thing because the earth would be warming even faster if the sun were actually warming. In any case, the effect of the sun's tiny variation in output is far smaller than the effects of the increase in the greenhouse effect.
If you want to get into secondary factors, then plain ol' water vapor beats out CO2 by a country mile.
Because water vapour content is driven by average temperature, it's considered an amplifier rather a primary cause of warming. It applies the effect of every other greenhouse gas, but it can not be increased or decreased independently and that's why CO2 is considered more important as a greenhouse gas than water vapour.
You've got a few things right, but you've failed to understand what those things actually mean.
-
Re:Move along nothing to see here...
The cooling during that period was very slight. It's pretty clear that it was caused by the increased particulates in the air at that time.
https://www.skepticalscience.c...
You are however correct about one thing, CO2 isn't our only big problem -
Re:Move along nothing to see here...