 Slashdot Mirror
Domain: berkeleyearth.org
Stories and comments across the archive that link to berkeleyearth.org.
Comments · 179
-
Re:Still waiting...
For some evidence of global warming. It's been decades now, and everything they've shown us as evidence has turned out not to be the case.
I wonder if in fifty years they'll be going on about global warming, even when it still isn't happening?
Here you go: http://berkeleyearth.org/globa..., now rejoice in the fact that your life long quest is over. Perhaps you can spend the rest of your life waiting for Trickle-down economics to start working?
-
Re:this has been a pretty brutal winter.
And a very, very critical analysis of all of those data and sources has already been done. Richard Muller was a climate denier. Here's how he proved the scientists wrong: http://berkeleyearth.org/about...
-
No. [Re:Data [Re:B..b..but...]]
Um, that is not temperature, that is see ice. Google "global average temperature", and use the NASA data (I believe).
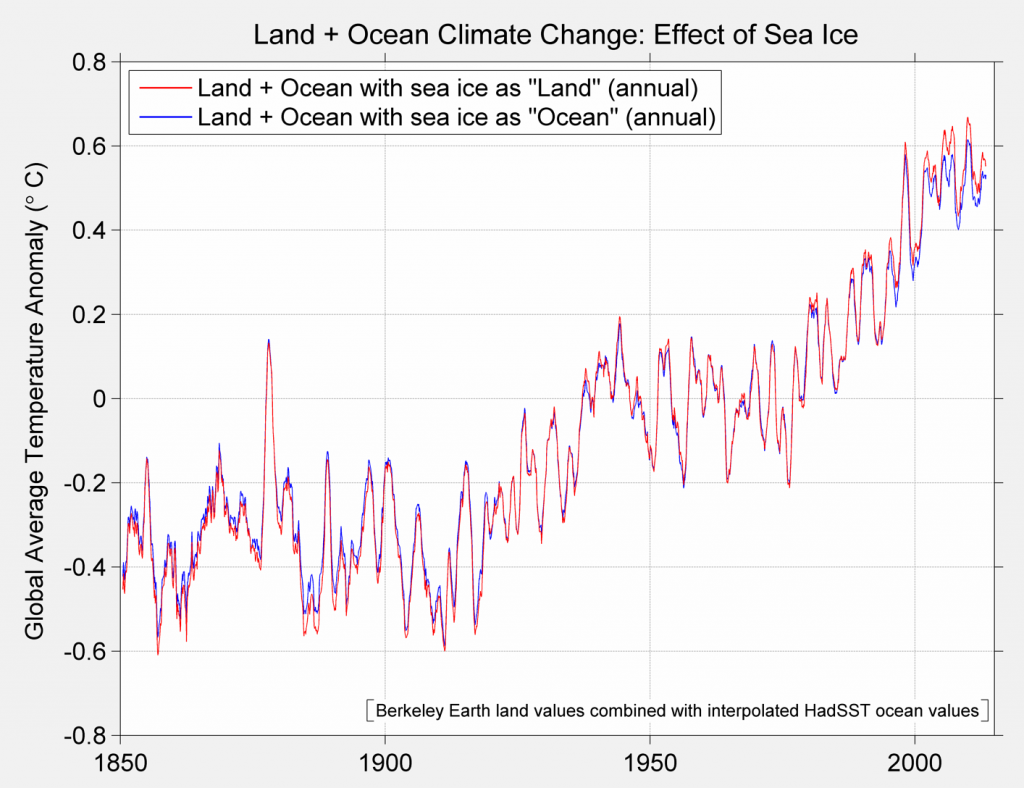
No, it's a graph of temperature. Read the axis label.
I happened to pick a temperature graph that shows two different methods of reconstructing past temperature, depending on whether the reconstruction puts sea ice in the "land" category or the "ocean" category, and showing that the TEMPERATURE result is the same. I picked that temperature graph, out of several choices, because it was the one that happened to a horizontal axis that covered the years in question.
I could have used a different one, this one for example: http://berkeleyearth.org/wp-co...
I'm pretty sure I gave a link to the source data in this thread somewhere.
That's an assertion that can be easily checked.
No, you did not.
-
Data [Re:B..b..but...]
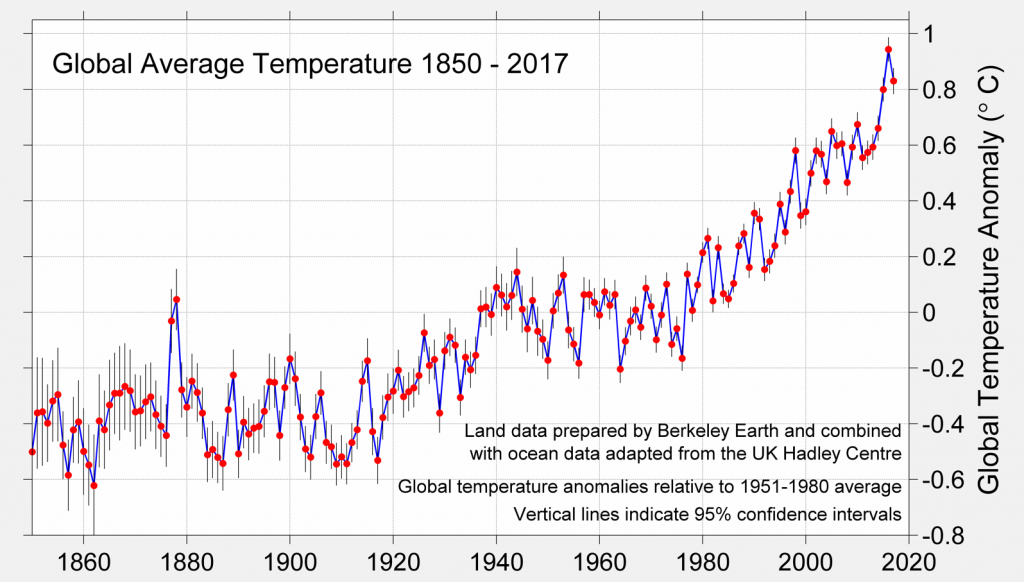
The global temperature appears to have had a positive slope for at least 200 years.
I notice you fail to give any source for your assertion.
Here is a graph of temperature data reconstructed back to 1850:
http://berkeleyearth.org/wp-content/uploads/2015/03/land-and-ocean-sea-ice-comparison-large-1024x788.pngThe slope has a marked increase after 1900.
-
Re:Remember, Remember, The 5th of November
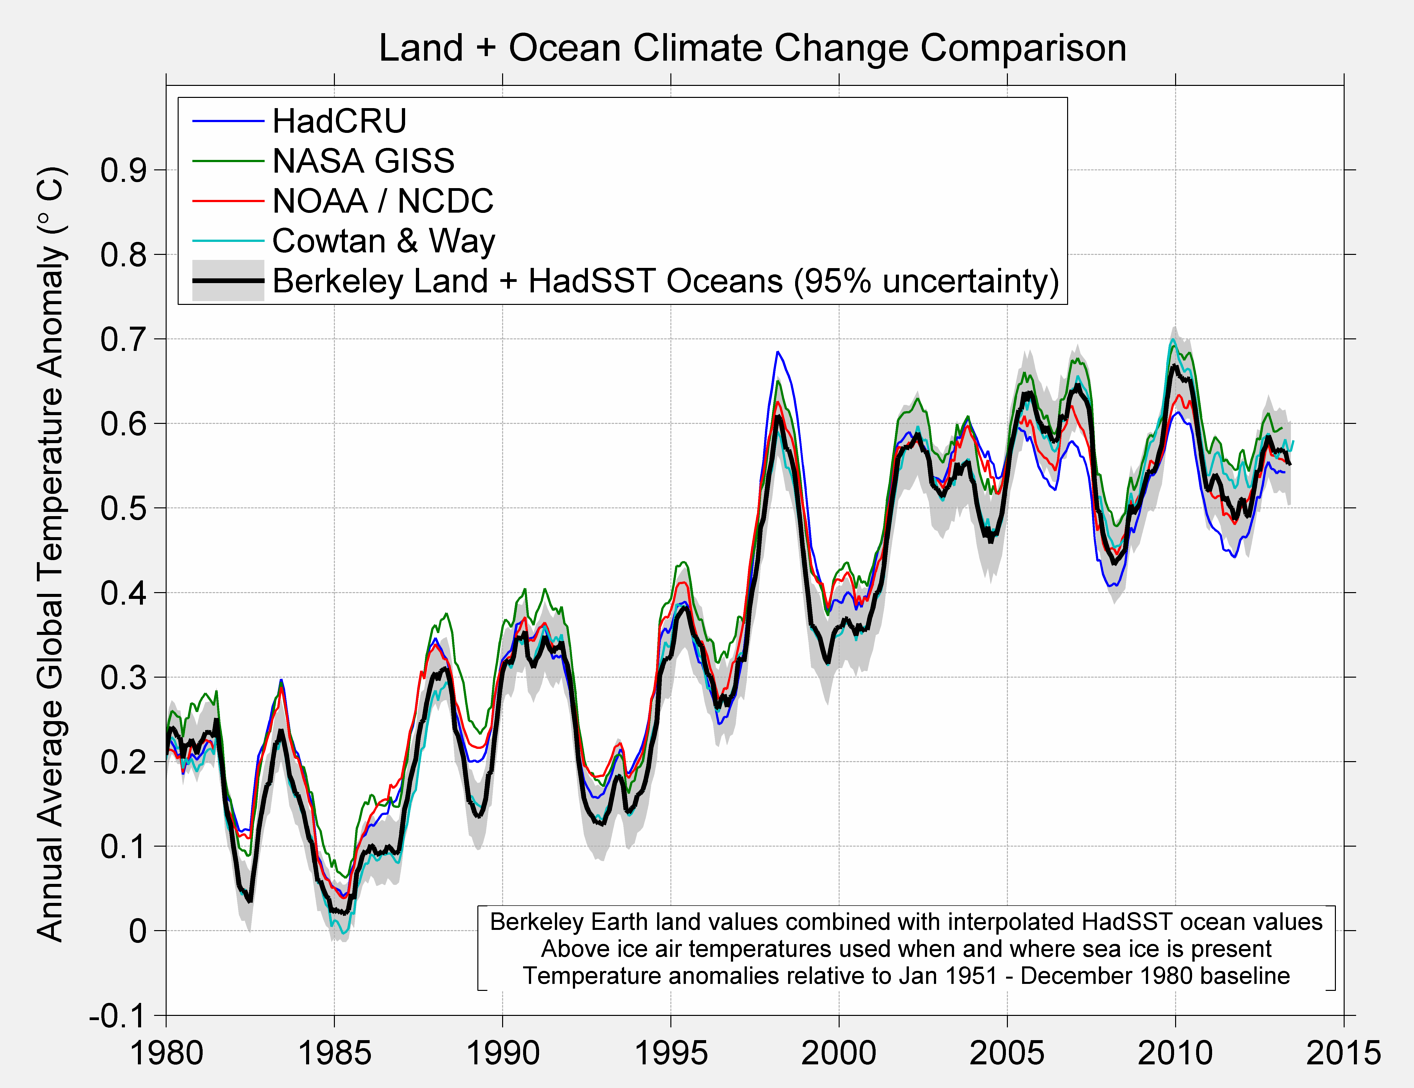
Their graphs only indicate a 95% uncertainty.
http://berkeleyearth.org/wp-co...
This definitely needs more study.
My guess is that it's a typo. Maybe they mean a 95% confidence level (i.e., two sigmas) for the grey band surrounding the Berkely data. It's hard to say just from the figure. You need the full context.
In any case, all of those data sources appear to agree with each other quite well.
-
References [Re:"deniers" only real scientists here
As I said: The data adjustment is discussed in great detail by the Berkeley project: http://berkeleyearth.org/understanding-adjustments-temperature-data/
and if that's too much detail, try the Guardian article: https://www.theguardian.com/environment/climate-consensus-97-per-cent/2016/feb/08/no-climate-conspiracy-noaa-temperature-adjustments-bring-data-closer-to-pristine
Or you can to to the GISS site: https://data.giss.nasa.gov/gistemp/faq/
-
Re:"deniers" only real scientists here
The data adjustment is discussed in a lot of detail by the Berkeley project: http://berkeleyearth.org/under...
If you want less detail and more of an overview, try the Guardian article: https://www.theguardian.com/en... -
Temp rise acellerating
The "warming" is actually more like
Not even close. Even over 50 years the trend is closer to 0.2/decade:
GISTEMP Least squares trend line; slope = 0.177 per decade over the last 50 years.
BEST Least squares trend line; slope = 0.178 per decade over the last 50 years.
But of course this has continued to accelerate so over the last couple decades you get:
GISTEMP Least squares trend line; slope = 0.21 per decade over the last 20 years.
BEST Least squares trend line; slope = 0.20 per decade over the last 20 years.
RSS Satellite data (which doesn't extend back 50 years) Least squares trend line; slope = 0.20 per decade over the last 20 years.
-
Re:See old school Catholic Church
No where in that story does it say the data was deleted after the 1980s. The CRU may be one of the leading temperature records but there are several others including the (originally) skeptic funded Berkeley Earth effort. They all pretty much agree with each other. You could throw out all of the CRU data and it wouldn't change a thing.
-
Re:don't even get the basics right
I took another look at the map the article is using. Apparently, it's a real time map, and the screen shot of the !Forbes article was taken at 16:00 UTC, which means Evening rush hour in Europe, while in the U.S., the day has just begun. If you look at the map right now (6:00 UTC), Europe looks fine (just Eastern Poland and Central Spain with moderate air quality, everything else good), while in the U.S., most of the East Coast, Appalachia and the Midwest has moderate and partly unsafe for special groups air quality, same in California and in some of the other large population centers. Only the more sparsely populated areas are fine.
-
Only read peer reviewed pubs [Re:history is here]
As I said in a previous post, I only accept data presented in peer-reviewed papers.
Really. That link I posted had a reference section with eight peer-reviewed publications; did you read them? Did you even look at the link?
Even some NASA data has not been reviewed.
Really. Let's start with GISS: 2018: https://pubs.giss.nasa.gov/yea...
2017: https://pubs.giss.nasa.gov/yea...
2016: https://pubs.giss.nasa.gov/yea...
2015: https://pubs.giss.nasa.gov/yea...That's just four years.
I wonder also how many of these scientists are climatologists and of the climatologists what percentage are dependant on government grants.
So, you won't read papers about climate that are written by climatologists. You are working very hard to avoid reading any data at all, I see. So, you must like the data from the Berkeley Earth project, which is independent: http://berkeleyearth.org/
-
Re:Many different groups analyzing the data
How can it be taken seriously when they are constantly changing the historical temperature data to match their hypothesis?
"They" are not "changing the historical temperature data to match their hypothesis". That is a made-up alternate-fact being promulgated by the deniers.
You are referring, I assume to the Goddard Institute for Space Studies historical temperature record. The analysis of the data is exhaustively documented , including a FAQ giving an overview for popular audiences that are too bored to read the actual documentation. And the original data set, and all of previous historical analyses, are available on the web, showing that the changes in analysis technique don't alter the conclusion that the climate is warming. Here, for example, are the graphs showing the results of every different correction to the analysis, dating back to 1981.
In any case, you do know that several other groups, such at BEST, also analyze historical climate data, and come out with rates of warming that are essentially the same. So your conspiracy theory that scientists are altering their data in order to hoax the public is going to be a conspiracy of hundreds, and probably thousands, of scientists in independent groups on three different continents.
What about the climate gate emails, what do you think of those?
-
Re:Data matches observations
well-verified models that have been vetted and analyzed
The models have consistently over-predicted temperatures.
to the contrary, the models have fit the data to well within confidence limits, and continue to do so.
(links [1] [2] [3] [4])False. They don't even fit the "adjusted" data very well.
This is the typical way deniers argue: I post a links to data, and the deniers simply deny. That's it, no data, no nothing. Whatever it is, just deny it.
That's why they're called deniers. If they had any actual information, they'd be skeptics, but the deniers don't even care about actual information. Whatever it is, they'll just deny it.
-
Data matches observations
well-verified models that have been vetted and analyzed
The models have consistently over-predicted temperatures.
to the contrary, the models have fit the data to well within confidence limits, and continue to do so.
Here's an article from Forbes about the very first Global Climate Model, Manabe and Wetherald 1967, looking back at how well their predictions from fifty years ago compared to data: https://www.forbes.com/sites/startswithabang/2017/03/15/the-first-climate-model-turns-50-and-predicted-global-warming-almost-perfectly/
And here are graphs, showing that the prediction from fifty years ago (red line) fits the data (blue line) almost exactly. https://climategraphs.wordpres...
Later models have refined Manabe and Wetherald 1967, incorporating other effects than simply carbon dioxide and water vapor, but haven't changed the answer. Here is the Berkeley Earth page comparing climate models used in the IPCC report against data: http://berkeleyearth.org/graph...
The problem with the deniers, on the other hand, is that they don't have a prediction. They don't have an alternative model, they don't have anything.
-
Many different groups analyzing the data
How can it be taken seriously when they are constantly changing the historical temperature data to match their hypothesis?
"They" are not "changing the historical temperature data to match their hypothesis". That is a made-up alternate-fact being promulgated by the deniers.
You are referring, I assume to the Goddard Institute for Space Studies historical temperature record. The analysis of the data is exhaustively documented , including a FAQ giving an overview for popular audiences that are too bored to read the actual documentation. And the original data set, and all of previous historical analyses, are available on the web, showing that the changes in analysis technique don't alter the conclusion that the climate is warming. Here, for example, are the graphs showing the results of every different correction to the analysis, dating back to 1981.
In any case, you do know that several other groups, such at BEST, also analyze historical climate data, and come out with rates of warming that are essentially the same. So your conspiracy theory that scientists are altering their data in order to hoax the public is going to be a conspiracy of hundreds, and probably thousands, of scientists in independent groups on three different continents.
-
Re: Ouargla, Algeria
That's not quite the case. He was on board with AGW, but then when Climategate hit he saw some shoddy science that gave him pause for concern.
I was initially hopeful when he started his project, but I became soured when it became a giant fund-raising effort as well as involving nepotism (his daughter).
Also, glancing at the paper, is there an explanation that explains the temperature rise from the 1750-1850 temperature average to the higher temps in 1850-1950? Is that from carbon dioxide? If not, what is the explanation?
What caused the Earth to warm and sea levels to rise about 400 feet in the last 10,000 years?
Something else to consider: the predicted rise in temperature due to the direct effects of carbon dioxide is modest. Most of the rise is from hypothesized cloud formation, which is uncertain.
You're arguing over semantics. He was skeptical in the years prior to completing the Berkeley Earth analysis and was not upon completion. He has stated this himself in numerous interviews. I personally know multiple colleagues of his so I feel quite confident in my assertion that he was skeptical about AGW and now is not.
I'm not sure that whether or not his daughter worked for him has anything to do with the empirical evidence concerning AGW.
Warming during the first half of the 20th century is likely due to a combination of natural climatic variability (namely solar irradiance and volcanism) and anthropogenic factors (burning of fossil fuels that began ramping up during the industrial revolution). Gradual warming since the dawn of the Holocene is pretty well understood as being a function of the Milankovitch cycles. Are you suggesting that because climate has changed due to natural variation in the past, it's therefore impossible that humans are causing a meaningful change in the planetary energy budget? I'm not really following your line of reasoning so just checking.
The models have generally under-estimated temperature rise rather than the reverse. Recent research suggests cloud feedback may be stronger than anticipated and in fact result in greater warming. It's also important to point out that the CH4 hydrate feedback in the East Siberian Arctic Shelf is not incorporated into models and will possibly exacerbate warming in ways that the models don't account for. So, while it's true that there is variability in processes, scientists (especially the IPCC synthetis) has tended to be demonstrably conservative in the RCP projections. Given that the 1.5C/2C RCP are already pushing the limits of what may be "safe" upper limits for human civilization, it probably makes sense to be pragmatic and take them seriously -- especially if there's even a 5% chance that warming may actually exceed those numbers given other feedbacks. -
Re: Ouargla, Algeria
Dr. Muller began the instrument record reconstruction project as a climate skeptic and as a result of his own research, changed his mind about AGW.
That's not quite the case. He was on board with AGW, but then when Climategate hit he saw some shoddy science that gave him pause for concern.
I was initially hopeful when he started his project, but I became soured when it became a giant fund-raising effort as well as involving nepotism (his daughter).
Also, glancing at the paper, is there an explanation that explains the temperature rise from the 1750-1850 temperature average to the higher temps in 1850-1950? Is that from carbon dioxide? If not, what is the explanation?
What caused the Earth to warm and sea levels to rise about 400 feet in the last 10,000 years?
Something else to consider: the predicted rise in temperature due to the direct effects of carbon dioxide is modest. Most of the rise is from hypothesized cloud formation, which is uncertain.
-
Re: Ouargla, Algeria
Actually, "normal climate variability" or "a heat wave" explains it nicely.
High daytime temps are NOT part of the catastrophic AGW prediction set, you know. The theory is that NIGHTTIME temps will increase, not daytime, so the overall average goes up.
And when they talk about "consistently higher" temps, they're literally talking about fractions of a degree in most cases.
By the way - there have been a few surveys of weather stations, and the vast majority of them have problems, mostly caused by either encroaching cities (the Urban Heat Island effect) or bad instrument siting. Very, very few stations have consistent records, with relatively untouched siting. The ones that do? Well, they don't show the AGW trend that the others do... and the response by AGW scientists is to adjust the ones that aren't showing the increase (AKA "throwing out the good data so the bad data looks better").
Try this site, for a bit of data that will shock you...
http://www.surfacestations.org/
This critique of weather stations used in the instrumental temp record is pretty tired at this point. Berkeley Earth already addressed the issue of station selection bias extensively and built a new record from a complete overhaul of the station selection methodology. Dr. Muller began the instrument record reconstruction project as a climate skeptic and as a result of his own research, changed his mind about AGW. Perhaps his paper will be enough evidence to change yours: http://static.berkeleyearth.or...
If you're trying to reject the theory of AGW, at a bare minimum you need to be providing a comprehensive general circulation model that can explain even half of present warming in the absence of forcing from anthropogenic gases. Especially given the amount of negative forcing from aerosols in the troposphere and the current level of solar irradiance. -
Re:Really awesome...
Ahh... the raw data, virginal and pure as the driven snow. Maybe your time would be better spent understanding why the modifications are made and the techniques used to do the modifications. Very little raw data comes without defects. Calibration issues, measurement bias and for large long term data sets changes in the methods used to collect the data as modern methods improve and other things all affect the quality of the data. These are things the scientists have to take into account when analyzing the data.
If you're concerned about the raw temperature data it's not that hard to get. You just have to be willing to take the time to seek it out. Here's the page for raw data from Berkeley Earth: Source files
Regarding your IPCC quote I think maybe long-term means something different to them than it does to you.
-
Lacking context in all sources...
A win is a win, and of course a drastic reduction in pollution for China is a great thing.
But all the sources sounds extremely one sided, like propaganda or something.
32% decrease OF WHAT?Because you know, there is a big difference between reducing 32% of normal pollution that's expected on any major urban center, and reducing 32% of a smog so dense and deadly that it looks like you are around a volcano that just erupted.
Yes, an improvement is still an improvement, but for those curious not about the reduction but about the current state, here's a more informative map:
http://berkeleyearth.org/air-q...So the thing is, yes, 32% reduction is awesome, but it's still nowhere near good enough. It's not even close even to major urban centers in the rest of the world.
To get to the same level of some other countries, China would probably need something more towards 70 or 80% reduction.And yes, I know that China's air polution problem is largely the fault of basically the entire global industrialized society - the polution is there because most major countries with the biggest economies in the world just shifted the entire industrial production, with all it's polution problems, straight to China, where we all knew regulation was lax, and welfare basically doesn't exist. So this isn't an attack against China.
But perhaps let's not celebrate too much when we still have such a long way to go...
I'm only saying this because perhaps some people don't realize how bad it really is there. It is not a joke when people say that kids, seniors and people with some health conditions could straight up die and suffocate in a normal hot day in some chinese cities without warning, while they could live pretty well in other parts of the world.
There were days when people walking around on big city streets there got home looking like they just emerged out of a coal mine - exposed skin brown or black with layers of particulate matter.
India is another country that will have to do a whole ton of work and invest a whole ton of money to get their pollution levels back to a tolerable state. And both countries needs help on this, because in the end it affects all of us. -
Re:Grab some popcorn
We can't accurately predict the weather for 5 days
Can't predict a coinflip either, yet we can predict very accurately the average result of 10,000 coinflips. Same with climate, which is a long-term aggregate of countless individual weather events. But sure, all those thousands of egghead climate scientists from all over the planet are obviously just making shit up, right? And apparently coordinating it all in a massive global conspiracy.
It's not a fact.
Then how do you explain the vast amount of peer-reviewed evidence supporting it that's cited in the IPCC reports? Gonna wave that all away?
There certainly is a huge monetary motivation to say it's NOT a fact.
Fixed that for you. And if you doubt me, let me know if you find any monetary motivation bigger than $33 trillion in stranded assets. Or perhaps just compare salaries.
Everything they do makes it LOOK like they are covering shit up.
According to whom? Certainly the studies cited in the IPCC reports are about as clear as it can get. Every scientific institution and meteorological department in the world endorses its conclusions - are all of them also covering this shit up, risking their reputations and sabotaging everything science stands for? Or perhaps other interests just want you to think so? There's certainly plenty of direct evidence for that.
You want data? Oh we deleted it.
You have an opinion we don't agree with?
Then provide evidence to back it up, or STFU. That's how science works.
The curves don't match what we said was going to happen ten years ago?
They look OK to me.
Don't get me started on having Al Gore as a spokeman
Haha, nobody elected Gore as any sort of spokesman other than himself, and certainly he has ZERO to do with the scientific case for AGW. That's like saying the entire Republican party are frauds because Trump is kind of a dick.
show me a solution that does NOT put us back into the dark ages
Well first off, the type of solution has NOTHING to do with the existence of the problem. Seriously, are you really going to deny the problem even exists just because you don't like someone's proposed solution to it? Is that rational?
Second, there are any number of proposed solutions. Pick some that you like. Nuclear is fine by me, if you can make an economic case for it (and certainly in some areas it makes a lot of sense). Solar and wind are obvious choices to be part of the energy mix, particularly in areas where there's lot of sun and/or wind. Geothermal, wave power, thorium - there are plenty of carbon-neutral energy sources to choose from.
And for intermittency, power companies already have to deal with that, since no power plant is perfect - e.g. coal plants are offline 40-60% of the time, so they have to be covered too. The answer is wide distribution and redundancy from a variety of sources ("the wind always blows somewhere") with some storage
-
Re: Climate change is not climate
We have about 50 years of good satellite data which shows warming, vs 150 years of ground based samples that don't.
The ground based samples are better quality. A satellite doesn't measure surface air temperature. Instead it measure the IR radiation coming from the surface, mixed in with the radiation coming from the entire column of air, and then has to perform complicated modelling to figure out what portion of the IR actually comes from the bottom layer.
And the 150 years of ground data clearly show warming. https://data.giss.nasa.gov/gis...
It doesn't help that East Anglia climatologists were caught cherry picking
They weren't. Here's a nice article explaining the temperature adjustments: https://skepticalscience.com/u...
Even without the adjustments, there's a very clear warming. A team of scientists from Berkeley had doubts about these adjustments, so they started with the raw data, and redid everything themselves. They ended up with almost the same graph.
Here's some more info: http://berkeleyearth.org/summa...
-
Re:Someone said once...
Real skeptics are willing to accept the evidence when it is presented to them. Witness the BEST project.
As for Feynman he may well have criticized climate scientists but he would have been even more critical of the "skeptics" because they bring no evidence to the table.
-
Re: Testable predictions
I wish you guys would stop with this "deleting raw data" thing. It hasn't happened. Here's some of it.
-
Re:The problem with climate science
>> my major complaint is that it is impossible to get correct information from anywhere
AC, I agree with you entirely. It's a real problem. I've found one person who speaks about this in an honest data driven way, that is willing to cut through the hype and hyperbole. His name is Dr. Richard Muller at http://berkeleyearth.org/
Here's why I find his arguments compelling.
1. He disassembles the "97% of scientists agree" argument as the BS it is.
2. He exposes and calls out legitimate and questionable data fiddling.
3. He calls out BS not-based-in-science predictions.
4. He calls out the politicking in the IPCC report.
5. He, and team, went back and redid analysis without data fiddling and came back with reasonable results.
6. He's willing to talk about what we don't know.His presentation "How to convert a climate skeptic" is absolutely worth watching. https://www.youtube.com/watch?...
The good bit starts about 6:00 in with the quote: 'The skeptic says "What about data selection bias?" You have to have an answer for that. You can't just say the data is overwhelming, because as it turns out the evidence is not overwhelming. I'll show you that.'
-
Re:ambitious math...
It seems more reasonable to assume that most of the people dying from air pollution are sick or elderly So keeping them alive would be a cost not a savings.
No, not really. You see, elderly people who're most at risk of dying due to the increased pollution are those with pre-existing respitory conditions that by themselves are already expensive to treat.. What do yu think is one of the driving factors of causing those people to have said conditions? Pollution. So by cutting down pollution, you reduce the amount of elderly people in need of care, thereby decreasing costs. And it's not as if only young people fall to these illnesses. They're at a heightened risk obviously, but inhaling pollutants does increase mortality risk in all age-groups.
Take London during the industrialization for example with its massive amounts of coal-smoke. There too, the vast majority of people outside factory and mine-workers that suffered and died of smog-induced illnesses were older people. By your logic it should have been fine to leave London covered in smog, because 'nah, it really just kills older folks they're going to die anyway'.
Or look at modern day Chinese megacities with pollution so bad, that in certain areas just going outside to breathe the air is equivalent to smoking 1-2 packs of cigarettes a day.. You think the chinese are interested in cutting down pollution en masse just because they wanna appear green, or because they've done that math and figured out that having an explosion of respitory illnesses will cost them a metric fuckton in lost years of employment as well as treatment costs?
-
Do you want people to ignor Global warming?
Because thats how you get people to ignore global warming.
Meanwhile we had a 1.5C increase in the last 250 years: http://berkeleyearth.org/data/ (I like those guys because of Richard Muller who is not afraid to change sides if the data contradicts his theory)
This here only talks about the recent findings:
http://berkeleyearth.org/berke... (2014-2015ish)They estimate that there could be another 1.5C increase within the next 50 years, so 7.8 is completely ridiculous as that would mean almost double that.
source on the 1.5C/50years: https://www.quora.com/Why-did-...
Alarmist news like those may be well intentioned in trying to wake people up to the real dangers of CC, but in the end they will just dull the senses of the public to the doom and gloom of it all. Worst, people tend to realize that occasionally they are being lied to or fed exaggerations and may even come to reject CC completely because of that.
-
Re:Good for Russia
The 5 hottest years on record have all been since 2010. 11 of the 12 hottest years have been since 2000.
Only if you accept adjusted temperature readings..
That would explain why some skeptics at Berkeley didn't accept them, made their own measurements and got the same results.
-
Re:The priesthood has spoken
-
Re:Perfectly foreseeable
Plenty of people are still denying that the climate is changing, and many more deny that humans have anything to do with it. We call these people "deniers" and not "skeptics" because real skeptics don't ignore all the evidence, when it's this overwhelmingly strong. The deniers refuse to consider any of it, and just spout the same old irrelevant nonsense like "the climate has always changed".
And if you're looking for groups that have strong reasons to con people out of their money - wouldn't you agree that fossil fuel industry executives have far more billions at stake than a bunch of middle-wage climatologists?
-
Re:I wish I could trust "academic experts".
AGW is not a proven condition in the real world. Selectively run experiments in isolated labs that claim AGW to be a real thing aren't legitimate for claims of open air,
A study from 2000 to 2010 measured the changing forcing of CO2 using spectrometers from the ground in the open air. Here is the abstract:
The climatic impact of CO2 and other greenhouse gases is usually quantified in terms of radiative forcing, calculated as the difference between estimates of the Earth’s radiation field from pre-industrial and present day concentrations of these gases. Radiative transfer models calculate that the increase in CO2 since 1750 corresponds to a global annual mean radiative forcing at the tropopause of 1.82 +/- 0.19 W/m^2. However, despite widespread scientific discussion and modelling of the climate impacts of well-mixed greenhouse gases, there is little direct observational evidence of the radiative impact of increasing atmospheric CO2. Here we present observationally based evidence of clear-sky CO2 surface radiative forcing that is directly attributable to the increase, between 2000 and 2010, of 22 parts per million atmospheric CO2. The time series of this forcing at the two locations—the Southern Great Plains and the North Slope of Alaska—are derived from Atmospheric Emitted Radiance Interferometer spectra together with ancillary measurements and thoroughly corroborated radiative transfer calculations. The time series both show statistically significant trends of 0.2 W/m^2 per decade (with respective uncertainties of +/- 0.06 W/m^2 per decade and +/- 0.07W/m^2 per decade) and have seasonal ranges of 0.1–0.2 W/m^2. This is approximately ten per cent of the trend in downwelling longwave radiation. These results confirm theoretical predictions of the atmospheric greenhouse effect due to anthropogenic emissions, and provide empirical evidence of how rising CO2 levels, mediated by temporal variations due to photosynthesis and respiration, are affecting the surface energy balance.
And here is the PDF of the whole paper for your edification: Observational determination of surface radiative forcing by CO2 from 2000 to 2010
The dishonest climate change scam's scientists and sheepish laymen alike have another problem to sort out: "NOAA’s GHCN systematically eliminated 75% of the world’s stations with a clear bias towards removing higher latitude, high altitude and rural locations, all of which had a tendency to be cooler. The thermometers in a sense marched towards the tropics, the sea and to airport tarmacs."
There's a temperature record from BEST. Maybe you've heard of them. They use every single temperature record they can get their hands on, that's over 39,000 temperature stations. They don't exclude anything with usable data. And yet their findings are substantially the same as NOAA's GHCN. Even if you did the opposite of what you accuse NOAA of doing you still wouldn't find much difference as long as you picked a statistically valid selection of stations.
-
Sunrise: east or west? Comparing prediction
Forget the real world. >Because real-world results don't matter. What did your MODEL that hasn't successfully predicted sunrise direction for the last 15 years say?
If you are snarking about climate models, in fact the climate models have been remarkably accurate over the last fifty years. Here's the Berkeley Earth comparison between models and measurements: http://static.berkeleyearth.or... (See also: https://www.skepticalscience.c... https://www.theguardian.com/en... )
And why have you been ignoring more accurate satellite-based measurements of the sunrise and selectively using only ground-based measurements that have been, errr, corrected from the original data?
You ARE aware that satellite measurements are heavily corrected, right? The satellites see a line-of-sight average of microwave emissions, and there is a rather long and controversial process to turn microwave emission intensity into middle troposphere temperatures. One researcher (John Christy) has a correction method that produces an output that says that global warming is real, but it's on the low end of the predicted values. http://www.realclimate.org/ind... Other researchers using the same data, however, come up with other answers.
The ground measurements, on the other hand, have had relatively minor corrections to account for changes of the type of thermometer, the corrections being well-documented, and (an important thing to note) the change due to corrections making no significant difference to the final conclusion.
-
Adjustments [Re:Revised headline]
You do know that all of the adjustments to data are documented, and the source code is public, right? https://data.giss.nasa.gov/gis...
You do know that all of the previous data is still archived, and you can look at it, right? https://data.giss.nasa.gov/gis...
You do know that the much-vaunted changes are small, and make no difference to the ultimate conclusion, right? http://berkeleyearth.org/under...
You do know that many different groups have looked at the data independently and gotten the same result, right? https://www.skepticalscience.c...
-
Re:observed phenomena
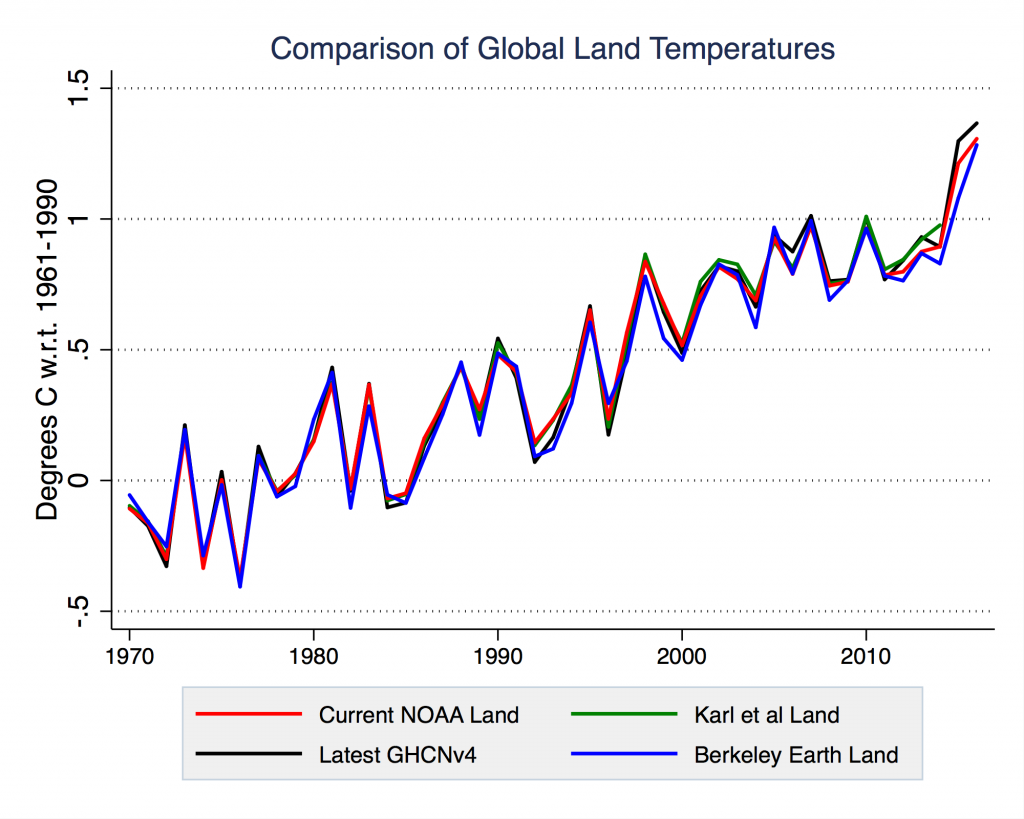
Name one study offering a credible alternative explanation for observed phenomena.
What observed phenomena?
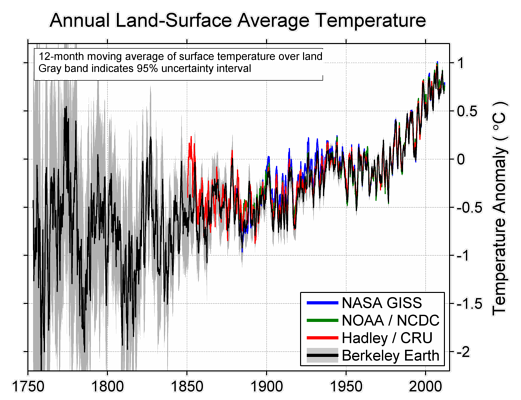
This, for a start: http://berkeleyearth.org/wp-co... . On the subject of replication, note that this image graphs results from four different research groups.
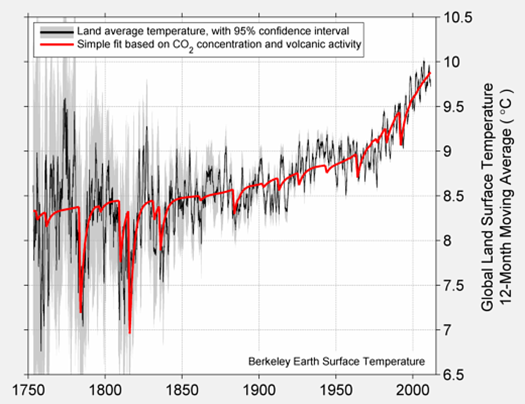
Here is the fit of theory to experiment:
http://berkeleyearth.org/wp-co...on behalf of all skeptics, i'll just say "the fit of that graph is not good enough to convince me!"
The challenge was to put forth a credible alternate explanation.
-
Re:observed phenomena
Name one study offering a credible alternative explanation for observed phenomena.
What observed phenomena?
This, for a start: http://berkeleyearth.org/wp-co... . On the subject of replication, note that this image graphs results from four different research groups.
Here is the fit of theory to experiment: http://berkeleyearth.org/wp-co...
on behalf of all skeptics, i'll just say "the fit of that graph is not good enough to convince me!"
-
observed phenomena
Name one study offering a credible alternative explanation for observed phenomena.
What observed phenomena?
This, for a start: http://berkeleyearth.org/wp-co... . On the subject of replication, note that this image graphs results from four different research groups.
Here is the fit of theory to experiment:
http://berkeleyearth.org/wp-co... -
Re:Nuclear ?
When present in high levels, e.g. after a strong volcanic eruption such as Mount Pinatubo, sulfur produces a cooling effect, by reflecting sunlight, and by modifying clouds as they fall out of the stratosphere. This cooling
This graph (red line) shows the estimated impact of CO2 + volcanoes on global mean surface temperature.
-
Re:Start the clock
Only invisible if you are one eyed and blind.
... or a climate scientist?
Elizabeth Muller, Executive Director of Berkeley Earth, said, “We have compelling scientific evidence that global warming is real and human caused, but much of what is reported as ‘climate change’ is exaggerated. Headlines that claim storms, droughts, floods, and temperature variability are increasing, are not based on normal scientific standards. We are likely to know better in the upcoming decades, but for now, the results that are most solidly established are that the temperature is increasing and that the increase is caused by human greenhouse emissions. It is certainly true that the impacts of global warming are still too subtle for most people to notice in their everyday lives.”
-
Data is here
Show the raw temperature measurements NASA! We don't want to see those "corrected" data sets from James Hansen et al. anymore.
All of the data is available on the GISS site, which I assume you haven't bothered to look at: https://www.giss.nasa.gov/
The site includes the source code for the analysis and a discussion of what all the data corrections are, why they were done, and what the data looks like before and after corrections.
You might want to start with the FAQ on how the data analysis is done, here: https://data.giss.nasa.gov/gis...If you don't like the way NASA does the data analysis, there's an independent analysis from Berkeley Earth Surface Temperature project, here: http://berkeleyearth.org/
-
Re:This is why most people are skeptical
"Keep in mind that these data are subject to large adjustments"
http://berkeleyearth.org/under... [berkeleyearth.org]
This page doesn't seem to indicate that the adjustments are large. Can you quantify "large" and "small" adjustments?
Instruments have been upgraded from mercury thermometers to digital sensors. The "scientists" claim that this introduces a cooling bias and adjust temperature upward.
Is there a reason to doubt their conclusions? What is this reason? Explain and demonstrate with observations.
The time of day in which observations are made has changed. The "scientists" claim that this change also introduces a cooling bias, so another upward revision is made.
Is there a reason to doubt their conclusions? What is this reason? Explain and demonstrate with observations.
"Urbanization" (basically heat from pavement) creates a warming bias, etc. etc.
So you are saying that urbanisation does not create heat islanding? Why not? Explain and demonstrate with observations.
There are also certain "quality control" adjustments.
And what is the net effect of these quality control adjustments? Are you saying they are not required? Why not? Explain and demonstrate with observations.
"If you plot the quality controlled data prior to the adjustments, the temperature record is mostly flat."
See figure #5 at the above URL
Figure 5 is not a temperature record. How does it demonstrate that the temperature record is mostly flat.?
What does mostly mean?
What happened to the energy incursion predicted by Arrhenius et al? Did the energy just disappear?
-
Re:This is why most people are skeptical
Agreed that it's up to the person making the assertions to provide the evidence. I'm not going through the entire list, but the massaging of the data is real.
"Keep in mind that these data are subject to large adjustments"
http://berkeleyearth.org/under...
Instruments have been upgraded from mercury thermometers to digital sensors. The "scientists" claim that this introduces a cooling bias and adjust temperature upward. The time of day in which observations are made has changed. The "scientists" claim that this change also introduces a cooling bias, so another upward revision is made.
"Urbanization" (basically heat from pavement) creates a warming bias, etc. etc.
There are also certain "quality control" adjustments."If you plot the quality controlled data prior to the adjustments, the temperature record is mostly flat."
See figure #5 at the above URL
The adjustments in and of themselves are not proof of some grand conspiracy, but questioning the methodology used to massage the data is fair game for the skeptics.
-
Re:Not even a debate
Perhaps the analysis of the Berkeley Earth http://berkeleyearth.org/ project will be more to your liking?
They did a complete re-examination of all available datasets and looked at more data than any other single project to date.
This included taking raw data, not just analyzed data sets that had already been sanitized as that seems to be a particular sticking point for skeptics.Their conclusions are at http://berkeleyearth.org/summa...