 Slashdot Mirror
Domain: noaa.gov
Stories and comments across the archive that link to noaa.gov.
Comments · 2,602
-
Re:Ah don't worry...
Actually, NOAA has been having a "war on lightning" for some time now. And they can filter money into their buddies' pockets - do you think that S.A.M.E radios are free? Does it cost nothing to build a storm shelter?
Deaths due to lightning, annually: 24,000.
(As NOAA will tell you - if you can hear thunder, you could get zapped - get your ass inside and stay in until 30 minutes past the last thunderclap. Thank you.)
Deaths due to terrorism: varies wildly. Pick an arbitrary year, like 2010, and your "more" is a factor of 3, approximately. Some years, it's only a factor of 2. Given all the deaths this year in Iraq, I suspect that the figures will be large.
-
Re:confluence of effects
Yep. A "derecho" : http://www.spc.noaa.gov/misc/AbtDerechos/derechofacts.htm
It's a weather phenomenon.
-
Re:It's briefly touched upon in TFA
http://www.ngdc.noaa.gov/dmsp/interest/wilma.html
By the ocean is where the people live...
-
Re:Not too bad?
Well, for one, in the US alone, more than half the population lives in a coastal area.
Even if just 10 percent are directly affected, that's still a large number of people.
In the US, can you imagine all the lawsuits and politics about how to move people, does the government have the right to do it, does the government have the obligation to do it, and who is going to pay for it?
For countries like Indonesia that are mostly islands, or in countries or areas that are largely below sea level, this could result in a major loss of housing and usable land.
Anything that changes ocean patterns could affect shipping and fishing, both of which would be major blows to the global and regional economies. If we lose major fish populations, that will increase food prices, and if shipping becomes riskier, that will affect the price of virtually everything.
It's a lot more than avoiding getting wet.
-
Solution in search of a problem
The downsides to the concept, as I see them:
1. It would require a very large and dynamic database, and that database would require updating almost every minute, as transmitters change "signatures", are switched on or off, or are interfered with by atmospheric phenomena. The storage and computational power required to do so would keep a midrange desktop machine busy almost 100% of the time.
2. Significant events that disrupt the power grid, such as the derecho in the eastern US over the weekend, would render the system useless within the affected area.
3. Propagation conditions would affect such a system even more than GPS is affected. One big CME would knock out at least half the transmitters the concept relies on, if not more.
-
Droughts happen
The west is on fire because droughts happen. This Exxon CEO ought to tell this to the people in CO that have lost their homes. http://www1.ncdc.noaa.gov/pub/data/cmb/images/fire/2012/05/total_dm_120529.png
-
Re:It has nothing to do with global warming
Sea level rise has been directly measured by satellite since 1992. The data's pretty solid. I'm tempted to add something sarcastic, but I guess the right thing to do is de-escalate. Measurements are measurements, throwing around unwarranted accusations of bias IMHO does nothing but help our society's decay into superstitious tribalism. I kind of like the scientific era and would like it to last.
-
sea level change at New York from 1856 to 2006
Data point: Mean sea level at various harbors has been tracked since the mid 1800s. Sea level rise at New York since 1856 has been quite linear at +2.66 mm/yr (0.91 feet per hundred years).
Link:
http://co-ops.nos.noaa.gov/sltrends/sltrends_station.shtml?stnid=8518750%20The%20Battery,%20NY -
Re:Vocab Nazi strikes again!
Please turn in your Vocab Nazi card at the nearest Nazi Card Collection Center.
Lanai is located east of the International Date Line, at 20.833333 N, -156.933333 W. The name "typhoon" is reserved for a tropical cyclone in the Northwest Pacific Ocean (i.e. west of the International Date Line). See http://www.aoml.noaa.gov/hrd/tcfaq/A1.html for more details.
-
Anti-science: Winning heats and confusing mindsScientists are not immune to confusion but they're generally more willing than most to own it.
The way the measure temps is laughable
I suggest that what you are doing is trying to understand the issue by reading people like Anthony Watts and their manafactured contraversies are confusing you. Here's a link to a very simple NASA experiment you can do yourself, it anhilates the ashpalt and concrete argument, Watts' recation to that debunking was to start issuing false DCMA take downs to hide it. Watts is just wrong and refuses to aknowledge it for political/financial reasons, however the database that Watts has is the best available survey of the current state of US wether stations, so he has contributed something positive. Unfortunately there is a lot of potential for error in his own survey so it's unlinkely it would be very useful as a way of measuring improvement (or otherwise) of the infrastructure.
This is not to say that the urban heat island effect is a fantasy, it's just that climate scientists discovered it decades ago because it's fucking obvious!!!! In fact the MET reseach center that was at the center of the climategate beat-up and accused of "tampering with the raw data" has spent over two decades maticuosly transcribing the raw data set (multiple times with different transcribers to cross-check) and looking for precisely these kinds of anomolies. Unlike Watts and his army of amature photographers they are world renowned experts in sources of observational error wrt to weather staions and they back that up by frequently publishing in top tier journals such as Nature and Science. It's extremely tedious work and is replicated by an independent team using different statistical methods at NASA. These are the two main historical temprature sets, the enourmous amount of work that goes into verifying them is why the rest of the scientific community trust and applaud them.I am fed up with these idiot scientists
The cure for that is to get your information from the horse's mouth
I blame scientists for this
Which is exactly what the anti-scientists who manafacture these 'contrversies' want you to do, they paint scientists as both complete morons, omnipotent conspirators or grant leeches hoping you will buy one or the other demonization and join their army of useful idiots. The 50 or so stink-tanks in the US who generate most of these climate myths, they have powerfull supporters in congress such as senator Inhofe. They use the exact same play book that was used for decades to deny that smoking causes cancer, it's the same play book creationists use. Why is it the same play book? - Because some of these stink-tanks such as the heritage foundation are paid to do it by the three different groups of deniers. Winning heats and confusing minds, it's how these stink-tanks earn a living.
Now as for the supposed claim (didn't RTFA) that AGW has caused Moose populations to drop dramatically, if the orginal work was published in a peer-reviewed journal I'm inclinded to think the journalist added that bit of confusion all by himself. A hard core cynic might even think it was inserted to distract from the real cause of the Moose decline but it's much more likely that the journalist was just manafacturing his own little contraversy to grab eyeballs and/or appease sponsers. If you want good investigative journalisim that gets to the bottom of these 'climate contraversies' I highly recommend Peter Sinclair's youtube series climate crock of the week. -
Re:Somewhat welcome news
and even the NH ice coverage is within a fingernail's width of the thirty year mean.
When (no matter what) the sea level isn't going to suddenly jump ten centimeters in a decade (where at most 1-2 cm is a lot more likely)
the measured bond albedo of the Earth has increased by 7% over the last fifteen years,
Mistaking cycles for linear trends
which corresponds to a roughly 2 C temperature drop due to reduced net insolation "off the top" as it were.
Total lack of data for that statement. I'm willing to check out any support you have, but just as a warning, a 2 C change due to change in bond albedo is basically impossible just based on the temperature data we have.
looking out the window at the water in Beaufort NC, where the tidal levels haven't significantly changed for years).
Yes, because eye-balling a waterline trumps actual measurements taken over the course of decades, and where significant seems to mean something completely different to you than to oceanographers - or anyone working with oceans.
Yes, you've indeed admirably proven your position with sources that are peer-reviewed, based on multiple and independent data sets, and you have demonstrated a strong understanding of basic physics, scientific principles and research methodology.
-
Re:How is plankton a good carbon sink?
More warming means less ice, which should mean more sunlight and more plankton growth, hence more carbon tied up.
There's not much evidence of this effect dominating increase due to accelerating fossil fuel use and land use change.
-
Re:An English translation, for us non-sociologists
-
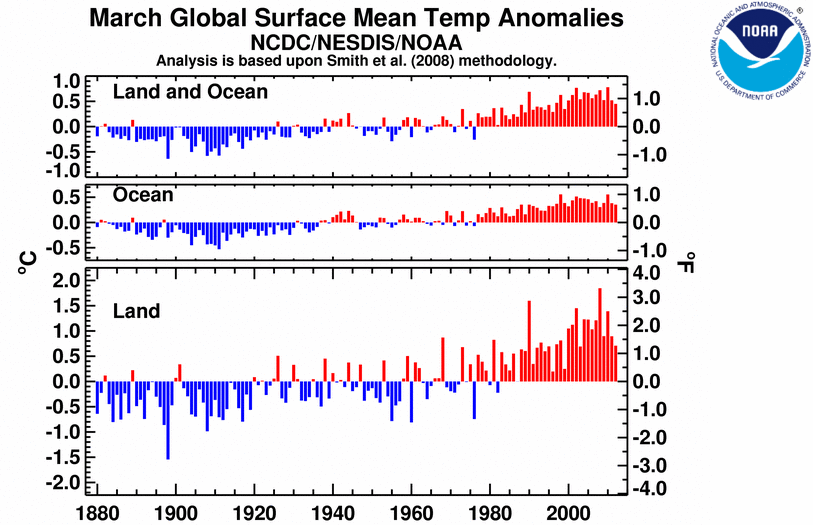
Re:kids are worried ...From NOAA
Averaging the global land and ocean as a whole, the combined land and ocean surface temperature during March 2012 was 0.46C (0.83F) above the 20th century average of 12.7C (54.9F), resulting in the coolest March temperature since 1999 and ranking as the 16th warmest March since records began in 1880.
(emphasis mine)
Only relevant to the past decade and a single reading does not make a trend but this seems to indicate (very short term) cooling. As does this graph: March Global Surface Temp Mean Anomalies.
Not saying there is no global warming and man has no effect whatsoever... what I'm saying is there are variants in the trend that are powerful enough to reverse whatever warming may be happening, if only for the short term. We need to understand climate and how it works as a whole, rather than simply saying "carbon will destroy the earth". -
Re:Chicken Little, again
you can clearly see a gradual increase in the number of both hurricanes and tropical storms over the last hundred years
Due to humans seeing more of the world, humans expanding settlements over larger parts of the world and thus reporting of storms has increased. Not the actual number of storms.
A NOAA-led team of scientists has found that the apparent increase in the number of tropical storms and hurricanes since the late 19th and early 20th centuries is likely attributable to improvements in observational tools and analysis techniques that better detect short-lived storms.
http://www.noaanews.noaa.gov/stories2009/20090811_tropical.html
it doesn't take a rocket scientist to correlate increased number of storms with increased damage, even if the individual storms aren't becoming more damaging, which I'll admit is a question still under some debate.
Now what do we say about correlation and causation?
A team of scientists have found that the economic damages from hurricanes have increased in the U.S. over time due to greater population, infrastructure, and wealth on the U.S. coastlines, and not to any spike in the number or intensity of hurricanes.
http://www.noaanews.noaa.gov/stories2008/20080222_hurricane.html
-
"Hide the decline"
If the trees and temps don't jive now, then why is it valid to say they jived a thousand years ago?
If you throw out the enitire TR proxy the results are virtually the same as only throwing out the divergent part. This in itself strongly suggests the "good" part of the proxy does indeed correlate well with the average of the other proxies wich in turn correlate with instrumental records and/or isotopic 'clocks'. As you say the TR proxy diverges from the instrumental record after the 1950's, and it's unknown why this is so, but it doesn't change the reconstruction in any meaningful way.
You should always consult the primary source, especially when the subject is AGW. If you haven't read the hockey stick paper and it's 2005(?) follow up, then do so, they list the proxies and discuss the tree ring problem. Proxy data sets can be found at Nasa's paleoclimate data repository. I think you'll find there are more than a "few samples" in the 3377 TR data sets they have on their books. Yes, data SETS, not data points.
Speaking of sources, you may want to try running your bullshit detector over the primary source that led you into this well known cul-de-sc of irrelevant trivia. -
Re:Time frame
Ahem, excuse my maths, the annual variation at Mauna Loa is nearer 1% than 10%.
Here's a nice animation from NOAA showing global CO2 distribution and putting recent changes in the context of the last million years or so. It takes a few minutes to watch, but worth seeing to the end, in my opinion.
-
Solar Cycle Maximum
http://www.swpc.noaa.gov/SolarCycle/
Hmmm.
Matches periodicity, not intensity.
Of course if it's the subatomic particle stream
causing cloud seeding, then sunspot number
may be moot in lieu of intensity.-AI
-
Re:Most of the Rest of the Planet, However....
Do you have data to back this claim up? It is true that Europe had a cold snap http://en.wikipedia.org/wiki/2012_European_cold_wave where some countries, including France and Italy reported record low temperatures. But even given that, global temperature average on both land and air for February http://www.ncdc.noaa.gov/sotc/global/2012/2/were slightly above average and were very high for March http://www.ncdc.noaa.gov/sotc/global/2012/3 Since February was the height of the cold snap in Europe, and the global temperatures were still high, I'm not sure where you are getting your estimate.
-
Anti global warming target practice
Reports like this are like a tin can on a fence for anti global warming people. At the time I write this, I see dozens of posts saying "and now all the global warming people will take this as proof", and not one global warming person taking it as proof.
For the record, this is not proof of global warming. It is a very extreme regional climate event of the type that climate change theory predicts will become common, but you can't attribute individual events to the long-term trend.
For the record, this means jack diddly in terms of global temperature change, the contiguous US is too small to matter. The past 3 months did not set a global record. However, it has been pretty warm: global temperature this year so far is in the top 25%... just like every other year this century.
-
Hey Blueseed, ever gone out off CA in the winter?
For that matter, has your concept artist? That artwork is an absolute load of crap fantasy about what it's like out there. The weather can and will absolutely suck in the winter. And the summers may be nice(r), but you're not talking "lounging on the deck in your swimsuit". Seriously, what are you going to do if a storm blows up and it's 30's seas? Go into port while you close down all work? Watch your work force all call in sea sick?
Here's a summary of Dec/Jan conditions from a NOAA buoy close to the proposed location...
Average wind speed, 10 knots, with peak wind gusts up to 50 (and beyond) at times, which can create 25-30 foot seas. Trust me, 25-30 foot seas suck. You're not doing nothing but point the boat into the waves and riding it out. Average air temperature is about 53 degrees, with the water about the same, so forget swim calls. Maybe go out on deck for a big of an invigorating walk, but then it's back into the ship's interior. Even right now in Spring/Summer, it's blowing 15 knots and the air temperature is 51 degrees.
This is from http://www.ndbc.noaa.gov/station_page.php?station=46012
-
Re:I hate these articles and this subject.
All that you ask for there has been done. Here are some of relevant links:
http://eesc.columbia.edu/courses/ees/climate/labs/radiation2/index.html
http://sos.noaa.gov/datasets/Atmosphere/ceres.html
http://en.wikipedia.org/wiki/Earth's_radiation_balance -
Re:Last bastion
Inaccurate unscientific ramblings, sound bites and clichés do not support your argument. That not only goes for hkmwbz but also Soulskill (the author of this topic who so brazenly declares the science is all but settled), JD, Shavano and Blueg3 below. Global Warming / Climate Change is NOT scientific fact, it is THEORY presently being developed and there is still much to learn. Blind supporters of global warming make outrageous claims and forget that all of this is THEORY which must be backed up with evidence. There are no 'denialists' - that is not even a word! You offer NO LINKS to scientific studies to back up your outrageous claims, so I will.
Urban Heat Islands are definitely real, especially in rapidly growing countries like China. See this paper published by the Journal of Geophysical Research:
http://wattsupwiththat.com/2011/07/28/new-paper-uhi-alive-and-well-in-china/
So hkmwbz you are certifiably wrong there. Then you persist with your clichés
there's a huge amount of evidence that the warming is caused by humans.
Really? Show us your evidence. Where are your links? What is definitely an undisputed scientific fact is how little scientists know and how much they are still learning today.
Then we have JD (below) making ridiculous statements like:
The current imbalanced rise in CO2 is much more troubling because studies show that plants do NOT like massive levels of CO2 unless they come combined with massive levels of O2.
JD what makes you think CO2 is presently imbalanced? Where is the evidence for your statement? Do you actually know what the present percentage of CO2 in our atmosphere is??? It presently is around 0.039445%. Do you have any idea how the increase in CO2 has increased during the last 50 years? It has increased from 0.032 to 0.0395, or by approximately 25%. Here is the data:
http://www.esrl.noaa.gov/gmd/ccgg/trends/
Look at that graph. Its a fairly straight line over a period of 50 years. Fairly straight line despite the dramatic jump in CO2 emissions since the mid-1800's (PDF). Even though human population has more than doubled during the last 50 years! Even though the number of cars has increased 800% from 122 Million in 1960 to over 1 Billion today. And yet somehow our planet's climate just keeps on balancing things out and the rate of increase of CO2 is fairly constant. But wait, JD definitely said "imbalanced rise".
JD continues:
CO2 rises alone, without any other alteration to the environment, will cause plant growth to decline and is eventually toxic.
Really? Where is your scientific evidence? The reality is CO2 is a fertilizer to plants. Plants LOVE CO2, even without a corresponding rise in O2 (wrong again). Even in high concentrations CO2 continues to act as a fertilizer. Here are some links from climate change advocates which you seem to blindly trust:
http://www.nicholas.duke.edu/thegreengrok/fertilizationeffect
http://www.good.is/post/rick-santorum-thinks-carbon-dioxide-isn-t-harmful-to-plants-tell-that-to-a-plant/ -
Re:Can some one help me with these questions
I hope you are being serious, because those are actually important questions and strike at the core of the science (not the politics) of Global Warming.
3/4 of the world is water how many consistent accurate readings do we have from the oceans before say 1950.
Sea surface temperature is a good global thermometer and was first systematically recorded during the Challenger Expedition from 1872-1876. Read "135 years of global ocean warming between the Challenger expedition and the Argo Programme" for more detail.
So we have sixty years of accurate readings world wide could there possibly be a 70 year trend that we are missing ?
The simple answer is: Yes, there could be a 70 year trend we are missing. The El Nino cycle was arguably only first described in detail in 1969, so it is possible there are other trends we do not know about.
The planet is 4 billion years old, the last ice age was 10,000 years ago I don't think the sample is large enough for us to make a good decision.
There are temperature paleo-proxies that can be used as thermometers for the deep past. Some examples include sediment cores, ice cores, corals, tree rings, and leaf remains which provide a variety of information about the climate based on stable isotopes and other indicators. Ice cores give us a continuous record going back hundreds of thousands of years, while other proxies give incomplete records from millions of years in the past. I encourage you to challenge the validity of these proxies and learn about stable isotope fractionation.
How much of the atmosphere is CO2... not 90 percent but less than one percent correct and what is the the human contribution to that only a small fraction.
The atmosphere contains about 820 Pg of carbon, approximately 0.04% by volume. Each year, the net flux of carbon to the atmosphere from fossil fuels and land use changes is estimated at approximately 4.1(±0.04) Pg -- only 0.5% increase per year.
We are not the cause.
While the Earth's atmosphere is mostly nitrogen, carbon dioxide has a disproportionately large effect on controlling temperature. To prove it to yourself, you can do a physical experiment with two soda bottles and some alka-seltzer. We are measurably the cause of a small net increase in atmospheric carbon dioxide (see above); however, if you want to be sceptical you should ask whether that short term increase will lead to a long term temperature change.
-
Re:SI unit
I think that the Minivan has joined Wales as effectively an SI unit. link
I see your mistake. You consulted the "List of Unusual Measurements." You should have consulted the "List of Unusual Measurements That Fall From The Sky." Hmm. Still not there, though.
-
Re:Squiggly lines?
They're called ship tracklines. They are the path of the ship that made the bathymetry (water depth) survey. Generally speaking, there is broad, low-resolution bathymetry from all the world's oceans. It is derived from satellite gravity measurements. On top of that there are "groundtruth" surveys conducted by ships with fathometers to measure the ocean depth. Inevitably, these differ by a slight amount from the lower-resolution data. Ship tracks will have a variety of geometries, but if you are trying to cover a specific area, a grid-like geometry is common. Put those more precise values into the lower-resolution grid and you get interesting-looking patterns that have nothing to do with the actual sea-floor bathymetry. They just represent the places the ship traveled.
-
Re:Before you buy Dr. Hansen's goldmine, check it
Weather is getting more severe
Not according to science.
The bar chart below indicates there has been little trend in the frequency of the strongest tornadoes over the past 55 years.
http://www.ncdc.noaa.gov/oa/climate/severeweather/tornadoes.html
Several studies show that the anomalous long-lasting Russian heat wave in summer 2010, linked to a long-persistent blocking high, appears as a result of natural atmospheric variability.
http://journals.ametsoc.org/doi/abs/10.1175/MWR-D-11-00249.1
The problem is actually one of age of man
-
Re:riddance
NOAA has actually migrated away from Java.........to Flash. (no, not kidding.) That's bureaucracy for you.
-
Re:Reminder
Oh wow, you're right. I remember reading initial reports expressing concern, but apparently NOAA has given the all clear. Never mind.
-
Re:Simple solution...
In a word, no. It is more the rule than the exception in physical processes for causality to be able to run in either direction, depending upon boundary conditions.
Really? So, we can heat a pot of water with fire, and also cause a fire with a heated pot of water?
Let's have an actual example.
The reason that they are not sure of the sign is that the evidence indicates that net cloud feedback is close to zero.
Hardly. They have no idea about the magnitude *or* the quantity.
And no, nobody has managed to come up with a model that creates the modern warming through cloud feedback and that is at all consistent with the known climate records.
Again, you're trying to take a failure of the GCMs you have so much faith in, and then assert that this failure must somehow represent an entire solution for the problem at hand? We know cloud feedback is real. We don't have any model that accurately deals with cloud feedback. How can we rely on a model that ignores reality?
every model that is consistent with the known climate record
Models are consistent with the known climate record because they've been curve fitted. Understand this isn't one of their strengths.
You can't tell much of anything from a graph in which the axes are unlabeled. Warming arising from "natural" sources can be distinguished because "natural" does not mean magic.
The graphs are the same period of time, and the same vertical scale, simply unlabeled as to the absolute value. You cannot discern from either of them which one is supposed to be "natural" as per your AGW hypothesis, and which one is supposed to be CO2 driven.
Given that such a similar period of 50 years exists within the climate record, before any proposed CO2 impact should have even existed, shows great weakness, don't you think?
For example, warming due to an increase in solar output predicts that the upper atmosphere will warm more than the lower (in fact, the upper atmosphere has cooled).
Funny you should mention that:
http://www.realclimate.org/?comments_popup=2019Note
“what would FALSIFY [linking CO2 to ‘warming’]?”Schmidt swings again:
”that the stratosphere is not cooling as expected (this is a cleaner test than the surface temperatures because there are less extraneous factors)”And it’s a miss! The stratosphere hasn’t been cooling in over a decade:
http://www.acd.ucar.edu/Research/Highlight/stratosphere.shtml
http://www1.ncdc.noaa.gov/pub/data/cmb/temp-and-precip/upper-air/uahncdc.ls
http://www.arl.noaa.gov/documents/JournalPDFs/RandelEtal.JGR2009.pdfLike many physical processes, it can run in either direction, depending upon circumstances
Ah, back to the pots of heated water than can create fires
-
Re:I was surprised for a minute
Hmmmmmmmm...who to trust?
On one hand I see that cpu6502 suspects that our current warming spike is entirely natural.
On the other hand I see that the U.S. National Academies and the science academies of Canada, France, Germany, Italy, Japan, Russian, the UK, Brazil, China, India, Mexico and South Africa, the National Oceanic and Atmospheric Administration, the American Association for the Advancement of Science, NASA, the American Physical Society, the American Geophysical Union, the American Chemical Society, the American Meteorological Society, the Geological Society of America, the European Academy of Sciences and Arts, the Australian Institute of Physics and the International Union of Geodesy and Geophysics think cpu6502 is wrong.
http://www8.nationalacademies.org/onpinews/newsitem.aspx?RecordID=05192010
http://www.nationalacademies.org/includes/G8+5energy-climate09.pdf
http://www.noaanews.noaa.gov/stories2010/20100728_stateoftheclimate.html
http://www.aaas.org/news/press_room/climate_change/mtg_200702/aaas_climate_statement.pdf
http://climate.nasa.gov/evidence/
http://www.ucsusa.org/assets/documents/ssi/american-physical-society.pdf
http://www.agu.org/sci_pol/positions/climate_change2008.shtml
http://portal.acs.org/portal/acs/corg/content?_nfpb=true&_pageLabel=PP_SUPERARTICLE&node_id=1907&use_sec=false&sec_url_var=region1
http://www.ametsoc.org/policy/2007climatechange.pdf
http://www.geosociety.org/positions/position10.htm
http://www.euro-acad.eu/downloads/memorandas/lets_be_honest_-_festplenum_03.03.07_-_final2.pdf
http://www.aip.org.au/scipolicy/Science%20Policy.pdf
http://www.iugg.org/resolutions/perugia07.pdf
http://planet3.org/2012/03/11/a-brief-guide-to-the-scientific-consensus-on-climate-change/ -
Re:I think musk lost his marbles
In the U.S. Navy, the only thing that forces a submarine to surface is strictly food, as the spaces aboard ship are too small for them to grow it. Six to nine month deployments where they stay underwater the whole time are even pretty common. In other words, your analogy is sort of flawed here. Yes, they can surface... but doing so compromises their mission and that is something they won't do.
In terms of gravity, spinning a spacecraft can do wonders. You want to keep the spin rate below about 1 RPM, but that merely implies the size of the vehicle or the length of the tether to the counter weight. That isn't being done on the ISS because.... it has been proposed as a possible module and was even one of the original module designs. It was cut for pure political reasons, not technical ones.
As for radiation, a tank of water does wonders to stop just about all hazardous radiation you would encounter in space. You might need to hunker down in some reserved spaces for a few days when a solar flare goes by, but it isn't impossible to cope with or to even predict when it happens. The Space Weather Prediction Center already exists to do forecasts for solar storms, where I'm pretty sure more resources would be put into trying to make more accurate predictions for manned spaceflight.
In terms of the vacuum of space, 30 m of water is the same pressure difference as going from sea level to space. On top of that, it is a whole lot easier to build something to keep pressure in (like a balloon) than to keep the pressure on the outside from crushing you. Spacesuits are more complicated because you want to bend that balloon to make it useful, but that is also a solved engineering problem based upon suits of armor fabricated at the time of Henry VIII of England.
As for extremes in temperature, it isn't that big of a deal either. Space is a very good insulator and the largest problem you have is simply getting rid of excess heat as you need to radiate it away as convection isn't an option. To keep a spacecraft from getting too hot one one side, rotating the vehicle is again key, something almost all satellites use even now much less manned vehicles.
I'm not saying that the issues you are complaining about are invalid, but it is something that there is experience and knowledge on how to accomplish them, where the largest factor in their use is simply getting them into space in the first place as launches to LEO have been so expensive in the past. When a liter of water costs $100k or sometimes more to put it into space, weird sorts of attitudes about what is important start to happen with spacecraft designs. Elon Musk is suggesting he might get that below $500 or perhaps even less with these reusable spacecraft, which is partly where the $500k per person round trip to Mars comes from.
-
Re:too late -- the flare already hit.
They've been doing it since AR#9999, which was in June 2002.
And it's NOAA's doing -- they have a number of different formats they use for distributing information, but they're all fixed-width ASCII files, and very few of them actually use the 5-digit forms. To the best of my knowledge, all of the 'space weather' related products use the 4-digit values, but it's most obvious on the SPE catalog, as that's over a longer period:
http://www.swpc.noaa.gov/ftpdir/latest/SRS.txt
http://www.swpc.noaa.gov/ftpdir/latest/SGAS.txt
http://www.swpc.noaa.gov/ftpdir/latest/dayobs.txt
http://www.swpc.noaa.gov/ftpdir/latest/dayevt.txt
http://www.swpc.noaa.gov/ftpdir/indices/SPE.txtBut if you look at the long-term products, they use 5 digit AR numbers:
ftp://ftp.ngdc.noaa.gov/STP/SOLAR_DATA/SOLAR_FLARES/FLARES_XRAY/2010/xray2010
ftp://ftp.ngdc.noaa.gov/STP/SOLAR_DATA/SOLAR_FLARES/FLARES_XRAY/docs/xray.fmt.revAlthough they occassionaly bounce back and forth, eg:
ftp://ftp.ngdc.noaa.gov/STP/SOLAR_DATA/SOLAR_FLARES/FLARES_HALPHA/Events/2010/f_event.10
(and for those who wonder why I know this
-
Re:Hey wait a sec
I wouldn't trust the fucking United Snakes government to tell me its raining outside.
I do regularly. They're quite accurate.
-
Link NOAA model of aurora activity and visibility
NOAA forecast model of aurora activity and visibility
http://helios.swpc.noaa.gov/ovation/
If the little red line is south of your location, you might see something (assuming northern hemisphere). So far no love for the lower 48.
-
Re:Denialism of natural climate change
I think you're making a pretty big assumption that he presumes the answer.
It's fairly straightforward.
1) The raw data didn't fit the curve they had.
2) Adjusting by 83 years made the curve fit.
3) In order to argue that the raw data was somehow improperly dated, he rhetorically asked, "why should there be such a drastic increase of CO2 and of CH4 (Fig. 5 a) in the middle of the 19th century?"
The answer he presumes is "there is no reason for such a drastic increase", thus justifying the arbitrary adjustment to fit the curve.
I realize that ice cores can not show the details of CO2 fluctuations on scales of less than about a century. Where is you evidence that there have been drastic fluctuations in CO2 levels that just happen to average 280 ppm on those time scales?
My evidence is the Mauna Loa data that is rejected in the data rejection step: http://www.esrl.noaa.gov/gmd/ccgg/about/co2_measurements.html
" However, that air is sometimes contaminated by CO2 emissions from the crater of Mauna Loa. "
Local CO2 levels can be drastically changed by wind patterns and other dynamic atmospheric conditions. Given that ice cores can't show details of CO2 fluctuations on scales of less than about a century, how is it *possibly* rational to adjust something by 83 years in order to calibrate it?
Under normal conditions the left hand will warm up zero or hardly at all because of the human body's heat regulation mechanisms. I don't understand the point you are trying to make. Conduction of heat plays little role in the heat energy dynamics of the Earth.
The point I'm trying to make is that just like the human body has complex heat regulation mechanisms that belie its mostly water content, the global atmosphere has complex heat regulation mechanisms that belie it's simple chemical composition. Further, I'd argue that conduction of heat (if that's the proper terminology for the mixing of temperatures in the oceans), drives large natural variations such as ENSO/PDO/ADO.
-
Re:An agenda
Well if you're a scientist you're getting the facts wrong or presenting them wrong. The atmospheric concentration of CO2 is not "~9%", it's distortions like yours that make this a difficult conversation to have. In fact the CO2 concentration of the Earth's Atmosphere is 393 parts per million!!!! That's 0.0393% not ~9%.
"The concentration of carbon dioxide (CO2) in Earth's atmosphere is approximately 392 ppm (parts per million) by volume as of 2011[1] and rose by 2.0 ppm/yr during 2000–2009. [1][2] The concentration with respect to pre-industrial concentration of 280 ppm has increased roughly exponentially with a growth rate of 2.2% per year in the last decades[2] Carbon dioxide is essential to photosynthesis in plants and other photoautotrophs, and is also a prominent greenhouse gas."
http://en.wikipedia.org/wiki/Carbon_dioxide_in_Earth's_atmosphereJanuary 2012 it was 0.393% as reported here: ftp://ftp.cmdl.noaa.gov/ccg/co2/trends/co2_mm_mlo.txt.
The rise in CO2 since the 1950's has not increased temperature as shown by the Girma Analysis (posted in other comments on this thread). CO2 does not do what is claimed by alarmists in the real actual atmosphere, no where close as the failed and now falsified IPCC climate models verses actual temperatures proves conclusively.
-
Re:What are the chances
Not according to the NOAA/Space Weather Prediction Center. Close, though. Solar flux has been terrible lately - 10m was wide open back in late October with flux values of 140 or higher. We're barely above 100 right now with a massive contest on for this weekend. Durn it!