 Slashdot Mirror
Domain: nsidc.org
Stories and comments across the archive that link to nsidc.org.
Comments · 236
-
Re:Seems he has more of a clue
References
IPCC Fourth Assessment Report, Summary for Policymakers, p. 5 (the 5th AR is published)
B.D. Santer et.al., “A search for human influences on the thermal structure of the atmosphere,” Nature vol 382, 4 July 1996, 39-46
Gabriele C. Hegerl, “Detecting Greenhouse-Gas-Induced Climate Change with an Optimal Fingerprint Method,” Journal of Climate, v. 9, October 1996, 2281-2306
V. Ramaswamy et.al., “Anthropogenic and Natural Influences in the Evolution of Lower Stratospheric Cooling,” Science 311 (24 February 2006), 1138-1141
B.D. Santer et.al., “Contributions of Anthropogenic and Natural Forcing to Recent Tropopause Height Changes,” Science vol. 301 (25 July 2003), 479-483.
In the 1860s, physicist John Tyndall recognized the Earth's natural greenhouse effect and suggested that slight changes in the atmospheric composition could bring about climatic variations. In 1896, a seminal paper by Swedish scientist Svante Arrhenius first speculated that changes in the levels of carbon dioxide in the atmosphere could substantially alter the surface temperature through the greenhouse effect.
National Research Council (NRC), 2006. Surface Temperature Reconstructions For the Last 2,000 Years. National Academy Press, Washington, DC.
Church, J. A. and N.J. White (2006), A 20th century acceleration in global sea level rise, Geophysical Research Letters, 33, L01602, doi:10.1029/2005GL024826.
The global sea level estimate described in this work can be downloaded from the CSIRO website.
http://www.ncdc.noaa.gov/oa/cl... anomalies/index.html
http://www.cru.uea.ac.uk/cru/d...
http://data.giss.nasa.gov/gist...
T.C. Peterson et.al., "State of the Climate in 2008," Special Supplement to the Bulletin of the American Meteorological Society, v. 90, no. 8, August 2009, pp. S17-S18.
I. Allison et.al., The Copenhagen Diagnosis: Updating the World on the Latest Climate Science, UNSW Climate Change Research Center, Sydney, Australia, 2009, p. 11
http://www.giss.nasa.gov/resea...
http://science.nasa.gov/headli... 01apr_deepsolarminimum.htm
Levitus, et al, "Global ocean heat content 1955–2008 in light of recently revealed instrumentation problems," Geophys. Res. Lett. 36, L07608 (2009).
L. Polyak, et.al., “History of Sea Ice in the Arctic,” in Past Climate Variability and Change in the Arctic and at High Latitudes, U.S. Geological Survey, Climate Change Science Program Synthesis and Assessment Product 1.2, January 2009, chapter 7
R. Kwok and D. A. Rothrock, “Decline in Arctic sea ice thickness from submarine and ICESAT records: 1958-2008,” Geophysical Research Letters, v. 36, paper no. L15501, 2009
http://nsidc.org/sotc/sea_ice....
National Snow and Ice Data Center
World Glacier Monitoring Service
-
Re:This is interesting....
disclosure: I'm posting A/C because I moderated in this thread.
There was also a great article on how the polar ice caps are refreezing at the fastest rate ever.
meanwhile, over on Ars, "Warm Arctic winter starts sea ice off at a record low. Temperatures up by 10C in some areas of the Arctic suppressed ice growth."
http://arstechnica.com/science/2015/03/warm-arctic-winter-starts-sea-ice-off-at-a-record-low/
The Ars article is based on actual observations and includes citations. Yours?
There are more plots of actual observations at the National Snow and Ice Data Center in Boulder, CO if you are interested in real numbers. Somehow I'm guessing you're not though, and will accept a source which equates a recent increase seasonal sea ice area cover in the antarctic due to increased winds pushing ice offshore thus exposing raw ocean to antarctic air temperatures, to loss of millennial ice shelf volume which is the thing which actually contributes to sea level rise. Sea ice is 3 to 6 feet thick and there since the last year or two. The ice shelves are hundreds of feet thick and there since 10000 years ago, but many are now collapsing. But if you only cherry pick the three year area metric everything is all cupcakes and roses again, right?
-
Re:Price Controls?
I'm going to do something very foolish and imagine that you actually believe what you're saying, that you're not just being a troll, and that you actually think the data supports your conclusions. And now I'm going to explain why you're wrong, indulging in the fantasy that you'll listen with an open mind and, once you realize your mistake, freely acknowledge it. Prove me right. Or wrong. Your choice.
Also, ignore the arctic ice that's been increasing for three years,
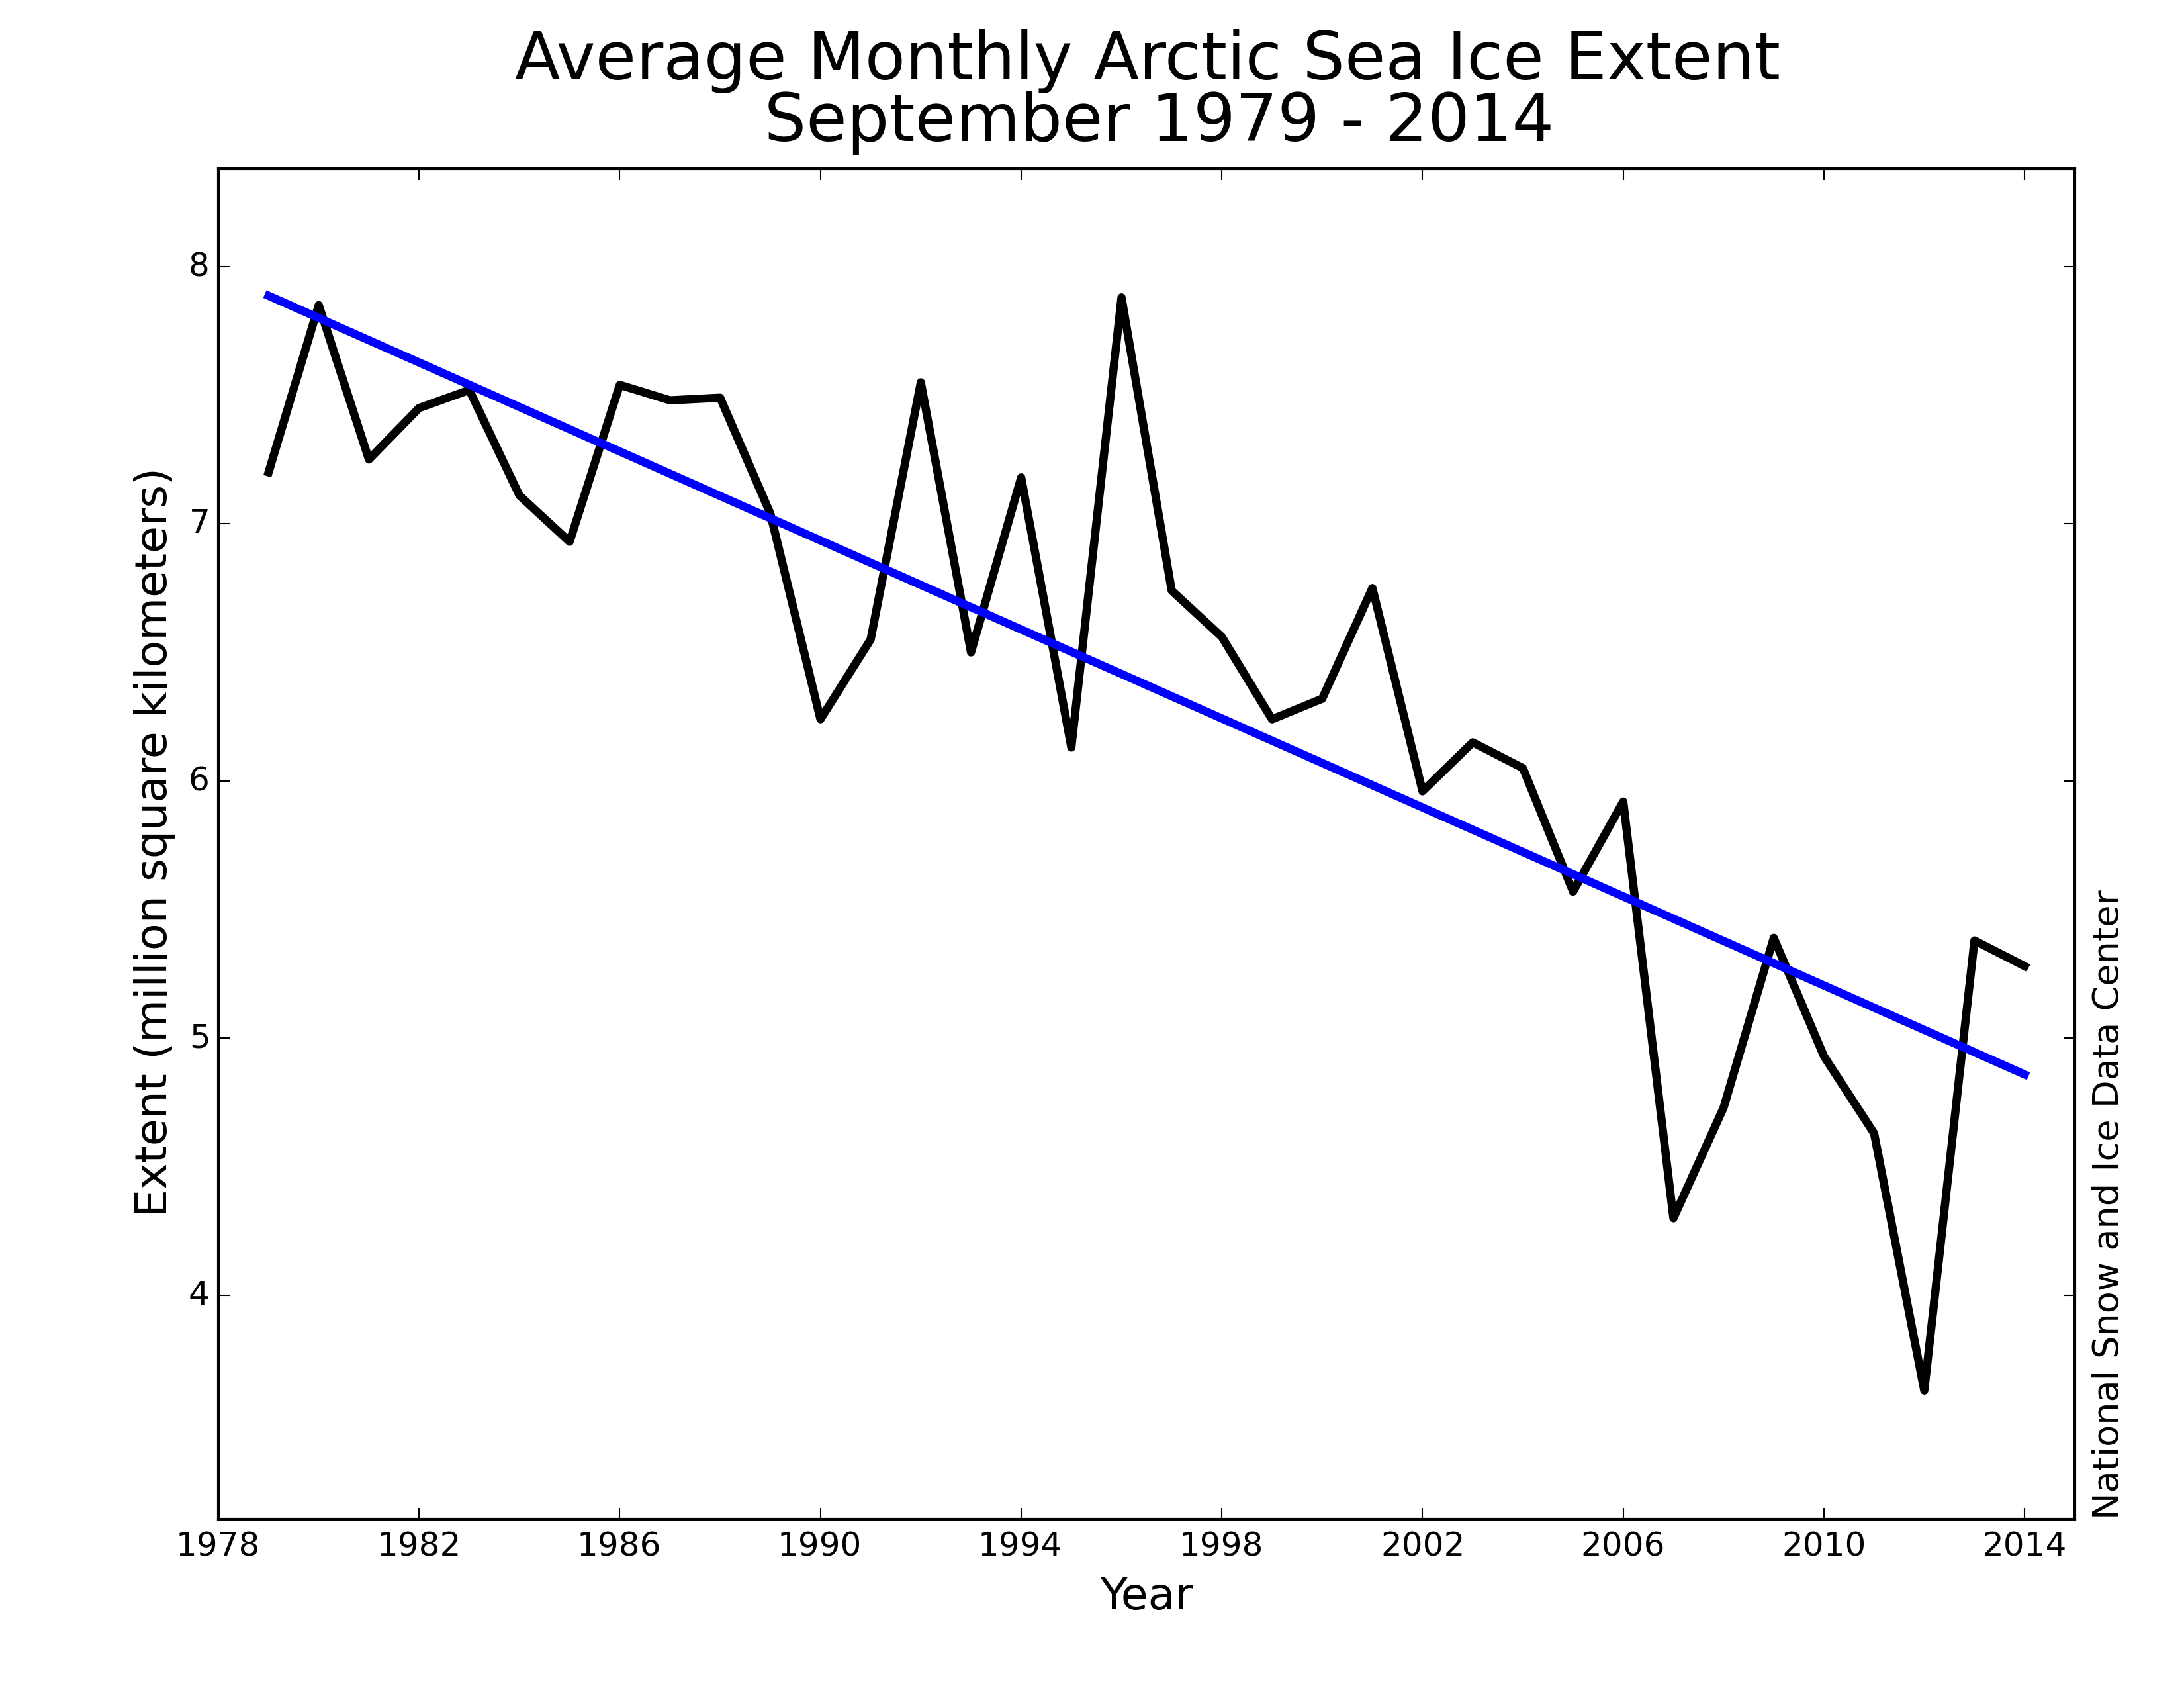
Three years? Three years is random noise. The climate consists of steady, long term trends with lots of short term fluctuations superimposed on top of them. Take artic ice, for example. It shrinks every summer and grows every winter. There are lots of factors that affect the summer minimum: wind patterns, ocean currents, etc. A few years ago, lots of factors converged to give an exceptionally low minimum. It hasn't matched that since; but it's come close, and has remained far below anything seen until just a decade ago.
Here's a graph showing sea ice for almost 40 years: http://nsidc.org/data/seaice_i.... Yes, it fluctuates up and down from year to year. But look at that and tell me it shows anything other than fluctuations around a steady decreasing trend that remains upbroken.
Let's look at something even more convincing: world wide temperatures. http://data.giss.nasa.gov/gist.... Look at those graphs, and then tell me they show anything other than short term fluctuations on a long term warming trending that has been in place for the last century.
Ignore Niagara falls that has frozen over two years in a row and ignore all the record cold around the country.
Wrong! There has not been record cold "around the country". Believe me, the whole western half of the country has been getting record heat, as has most of the planet. Here's a map showing it: http://www.ncdc.noaa.gov/sotc/.... Those are the difference between Jan. 2015 temperatures and historical (1981-2010) average temperatures. The red areas are hotter than average. The blue areas are colder than average. Yes, there's a small blue patch over the eastern US. But overall there's a lot more red than blue.
This is why scientists tend to prefer the term "climate change" to "global warming". Yes, the globe is warming up, but that doesn't mean everything is exactly the same, just uniformly warmer. Some times and places are a lot warmer. Others are only a little warmer. Others are actually cooler. Wind patterns are changing. Ocean currents are changing. Precipitation patterns are changing. Sea level is rising. Permafrost it melting. The climate is changing.
And if you want to know precisely how global warming is causing unusually cold weather in the eastern US, take a look at http://en.wikipedia.org/wiki/P....
Ignore the fact NAS falsified the CO2 hypothesis in 2010
Sorry, but that is just BS. You linking to a story about how fungi help to hold onto carbon and keep it out of the atmosphere, and somehow translated that into "NAS falsified the CO2 hypothesis". No. I don't know what you think that article actually meant, but I can assure you that isn't what it meant. (OK, I see you also linked to that Register piece that totally misrepresented the conclusions of that study. The Register is a notorious denialist website. Believe me, the scientists who actually did the work would not agree with the conclusions they're trying to draw from it.)
No one has "falsified the CO2 hypothesis". In fact, it was recently proven beyond a shadow of a doubt, by actually directly measuring the incoming and outgoing radiation, showing that the CO2 abso
-
Re:Droughts = Cold
Maybe its time to re-evaluate:
http://nsidc.org/arcticseaicen...
This winters arctic ice is trending towards a record low. Perhaps you should decouple drought = cooling in your mind or at the very least try to come up with some other justification besides "moisture is captured in ice caps". At the very least you got that part wrong.
-
Re:Whenever you want something other people have..
I don't know, if you sincerely don't understand my request, or are trying to weasel out without losing face (too much).
Here it is again: please, post pairs of links. The first link in each pair shall point to a quantifiable prediction, the second — to its materialization within 80% of the predicted quantity.
In particular I direct your attention to this graph of Arctic sea ice models vs. observations.
That chart references some predictions without links. The dramatic bold red line on it begins in 1950 — is that, when the first predictions were made? Where are they, can I read them?
But, Ok, let's stipulate the prediction really was made. Was it a scientific one — based on a decent scientific theory, or is it one of those "stalled clock" sort of thing, that happens to be correct twice a day? Two questions arise:
- If it were a solid theory linking Global warming to declines in sea ice, why did sea ice grow in Antarctica during the same period? Maybe, it did not grow at quite the same rate, but the overall ice-cover decline is certainly far less dramatic, than your chart shows.
- The second question is, can we trust the cited observations at all — or are they being "adjusted" to, infamously, "hide the decline"? Seems like the latter is the case — the American Thinker article linked to above is rather illuminating: the actual measurements measure area of ice-cover, but the scary charts plot the adjusted extent values, without explanation for the adjustments and their inconsistency. It does not have to be outright fraud — but such measurements are inherently imprecise. Observations are made by satellites and then need to be munged (for "quality control and homogenization") by computer algorithms. Programs, that change over the years (as do the #defines inside them) at the hands of people. People with agendas and the burning desire to convince.
So, after much back-and-forth, you were able to, sort of, cite one very questionable observation (that disappeared since then as the ice returned on both poles since 2012), that may or may not have been predicted... And you want the world to change its way of life based on that?
-
Re:A sense of scale
For the purposes of environmental remote sensing, there's no difference between cameras and antennas (radiometers); they just image different parts of the EM spectrum. We've had microwave "cameras" on climate and weather satellites since 1972
-
Re:Bias: but for them - not me!
Bottom line, it is simplistic and wrong to say that there has been no warming since 2000. In fact, it is very unlikely that this is true.
As far as a simple linear trend is concerned, it is unlikely that there has been no warming since the beginning of the century, based on GISS data. But it is not at all unlikely if you use any of the other data sets. (GISS is an outlier. Maybe it has to do with the +2degC of warming they are known to add via adjustments.)
As for sea ice, it's about average. http://arctic.atmos.uiuc.edu/c...
Antarctic sea ice was at record highs until just recently: http://nsidc.org/data/seaice_i...
And finally, the properties of CO2 do not change, but only a small portion of the predicted warming is due to CO2 directly. MOST of the predicted warming is due to "climate sensitivity" estimates, which are all over the map. Climate scientists claim that the climate reacts to the heating caused by CO2 by amplifying it 3 times. (The range is much wider. I've seen climate sensitivity estimates as low as 0.9C and as high as 7 or 8C.) However, there is little evidence to support high climate sensitivity estimates and the uncertainty in this area is vast. If the climate is not as sensitive to CO2 heating as scientists have assumed, then global warming is not a serious threat.
Regardless, like many other skeptics I actively support innovative nuclear designs and fusion projects, since fossil fuels are expensive, dirty and finite. If AGW proponents weren't allergic to the word "nuclear" then the AGW scare might serve a useful purpose. Unfortunately the pro-AGW crowd will likely continue to impede the only viable solution to their non-existent problem: nuclear.
-
Re:Global warming is bunk anyway.
really? because last I looked the ice sheets have been growing http://nsidc.org/arcticseaicen...
-
Re:IQ of congress
For instance, can you explain why the polar caps grew last year (both of them) during "global warming" (or Climate Change)?
I'm going to go out on a limb and guess that the polar caps will either grow or shrink (or both!) every single year, probably based largely on the local temperatures, amount of precipitation, etc. The real question would be how much they grew versus the average growth, and whether they are growing less than they used to. Saying that global warming doesn't exist because the polar caps grew last year is not evidence. What if the polar caps grow by an average of 10 feet every year, but last year they only grew 6 inches? They still grew, but that fact alone is not evidence that would contradict any of the claims regarding climate change.
For example, according to this data, it looks like the sea ice had below average growth for 2012 and 2014 between August and December, even though the rate is still close to 2 standard deviations from the average growth between 1981 and 2010. Farther down that page, it looks like the growth for all years after 2010 is below the average for 1981-2010, though still relatively close. This is the climate system of a planet we're talking about though, if you're expecting huge dramatic changes from one year to the next you're probably going to be disappointed unless we can get China to really accelerate all of those coal plants being built. Climate change looks like a long-term event, especially right around the times where our damaging effects on the planet are just beginning to overcome the planet's ability to regenerate. But don't worry, the more shit we add to the atmosphere year over year, the faster things will start to change once the planet isn't able to keep up.
Or Hurricanes lull in the Atlantic when the Global Warming Alarmists (like yourself) were spouting (especially after Sandy) all about how awful Global Warming was causing these horrible hurricanes?
If it's a true statement to say that climate change and higher temperatures in general will cause more powerful hurricanes, does that necessarily mean that every year there will be a large number of very powerful hurricanes?
I have doubts, serious doubts, mainly because all the horrible predictions made by all the popular spokespeople have not come true. The polar caps, the hurricanes, the extreme HOT weather just hasn't occurred the way "science" predicted it would.
Fear not my doubting friend, because scientific predictions are getting better and more accurate all the time. Here's a video which talks about the new OCO-2 satellite and how it will help us visualize what is going on in order to make more accurate predictions. Note how effective the planet is at reducing all of that CO2 in the atmosphere, it's actually very impressive. But what happens when our CO2 output starts to be more than the planet can handle, where every year begins with just a little more CO2 than the previous year? Good things aren't going to happen. So, where is that point? Have we already hit it? What if we have? How would we know? A couple CO2-monitoring satellites in space will probably be a good place to start answering those questions, so expect data from those starting next year.
That simulation is interesting to watch, but it's just a simulation of what happened in 2006. One major point where the simulation fails: at the beginning (1/1/2006) there is virtually no CO2 in the atmosphere, and you see it build up. At the end of the year (12/31/2006) there is quite a bit of CO2. I suspect that the fact that the simulation begins with very little CO2 is more for illustrative purposes of the simulation and does not actually imply that most years begin with little to no CO2. It actually looks like the opposite, winte
-
Re:None
Everyone knows the Weather Channel is very much biased. http://www.theonion.com/video/...
I see fit to answer an entertainer with entertainment.
There is at least one clear, totally weak lie in his letter : "The polar ice is increasing, not melting away".
Such statemnent is ridiculous given how easy it is to look at the picture, thus that guy deserves no respect nor wasting time with him.
http://nsidc.org/arcticseaicen... -
Re:Everyone should just say "interesting"
That plot shows the current year, and it doesn't tell you anything about the last 10 years. Here is a better graph of the long term trend: http://nsidc.org/arcticseaicen... As you can see, the trend is solidly down, with a bit more variance in the last couple of years (as the ice gets thinner, it makes sense that the area/extent has more variability)
-
Re:Everyone should just say "interesting"
Take for example this Plot from the NISDC: http://nsidc.org/data/seaice_i...
As I mentioned, it is low against the 30 year average, but far from a downward trend in the last 10 years.
-
Re:The problem with double standards.note these very recent incidents of large walrus herds and associated mortality events (2009, 2011 and 2014) have not coincided with the lowest levels of summer sea ice in the area, which occurred in 2007 and 2012.
Why would autumn haulout events coincide with minimum summer sea ice extent?
This year's sea ice north of Alaska was much further north than last year
If the scientists studying this haulout say that it's north of the continental shelf, and this caused the haulout on land, you're going to need some pretty good evidence that it is not north of the continental shelf.
Looking at overall minimum extents isn't going to cut the mustard.
Also, don't get your science from science-denial industry funded websites. They're full of misinformation. -
Re:2013 Antarctic sea ice hit 35-year record high
Usual selective reporting from the Daily Mail - claiming a 29% rebound from an all-time record low is somehow "proof" that global warming is overblown. The link is a year old too - this year is actually the sixth lowest in the satellite record.
Worth looking at an actual trend, rather than Daily Mail headlines.
-
Re:Less 'stuff' might not mean less ice
"is it possible that the ice has actually thickened and displaced more of the denser sea water?" -- not in this case. The geographic precision of these satellite gravity surveys and complementary ground and airborne surveys in the area constrain the loss of mass to ice over the land. In addition it is possible to estimate the change in ice mass on the land by other techniques and they are in agreement with the gravity. There is a good (but long) discussion of the recent observational techniques and results for the ice sheet mass balances in Greenland and Antarctica here: http://nsidc.org/cryosphere/so...
-
Re:It's getting hotter still!
Ice is also made by snow. Glaciers are formed by snow. The geological definition of an ice sheet, like the Antarctic ice sheets, is a continental glacier.
Here's a very straightforward summary from wiki: Ice enters the sheet through precipitation as snow. This snow is then compacted to form glacier ice which moves under gravity towards the coast. Most of it is carried to the coast by fast moving ice streams. The ice then passes into the ocean, often forming vast floating ice shelves. These shelves then melt or calve off to give icebergs that eventually melt. -
Re:It's getting hotter still!
Somehow a quite conservatively formulated claim (subjunctive mode, "some models, 75% chance, 5-7 years, during some month of the summer") magically morphed into the strong claim "Al Gore said in 5 years time the Arctic will be completely ice free".
And two years ago the summer arctic ice cover dropped to the lowest level ever recorded, only 1/3 of the average cover from 1981-2010, which is a divergence of more than three standard deviations, with all of the ice coverages since 2010 being far below that long term average.
It is pitiful how the existence of random variation superimposed over a very strong long term trend seems to succor the fantasies of denialists.
-
Re:It's getting hotter still!
Well given that 5 years ago Al Gore said in 5 years time the Arctic will be completely ice free and it's completely covered in ice still, I would say they have a point. Back to the drawing board with the models at least. If there is one. Which I doubt.
Why are you talking about the Arctic in an article about the Antarctic?
Furthermore why are you talking about Al Gore and models? Sure Gore is somewhat important in his role as an advocate, but Al Gore saying something wrong doesn't mean the models are wrong, it's means Al Gore is a politician who doesn't know the science. I'm not up to date on the models but I never got the impression that an ice free artic in this timeframe was the consensus of the scientists (sure, some thought it could happen, but that's not the same thing).
Btw, on that topic the Arctic ice is still shrinking.
-
Re:Science creates understanding of a real world.
Feel free to quote where I said the "arctic" was at record highs. Reading comprehension matters.
Thank you for pointing out that there is more ice in winter than in summer. You must think I am really dumb. I did a quick google search and posted what I found below. I wonder why you couldn't do one for yourself? Since anthropogenic global warming didn't start till the 70's, the notion that sea ice was even larger in extent prior to '45 only supports the fact that the world was already warming naturally. How exactly could an extra ~1/3 degree of warming melt all that ice anyways?
July 2014: "Antarctic sea ice extent increased rapidly through June and early July, and reached new daily record highs through most of this year." August 2014:"Antarctic sea ice remains at a daily record high, and 1.19 million square kilometers (459,000 square miles) above the 1981 to 2010 average." -
Re:Straight to the pointless debate
Good catch, I like their visualization tool here: http://extranet.nsidc.org/Nimb...
Unfortunately, I couldn't find any similar visualization for the arctic.
I think the take away from their work shows just how much natural variability there was, even during a regime of significantly less CO2:
“And the Antarctic blew us away,” he said. In 1964, sea ice extent in the Antarctic was the largest ever recorded, according to Nimbus image analysis. Two years later, there was a record low for sea ice in the Antarctic, and in 1969 Nimbus imagery, sea ice appears to have reached its maximum extent earliest on record."
1964 high -> 1966 low -> 2014 above average
Since we have no 60s data regarding volume, I suppose that's an open question, but for antarctic extent to grow from 1966-2014 in the face of ever increasing CO2, points to some significant natural variability that overwhelms whatever influence CO2 might have.
-
Re:unfair policy
Wrong.
If you look at the winter & spring periods, all the recent years had more ice than 2006 and yet they all finished much lower by the end of the summer melt.That means more heat in the system - and you should research just how much heat is needed to melt ice.
HINT: it's a LOThttp://nsidc.org/arcticseaicen...
This is only ice extent, which is probably the worst indicator of the decline in Arctic ice. Total ice area and volume are far better but more difficult to get accurate numbers.
-
Re:How is CO2 leading cause of warming?
Most of the heat is going into the oceans and causing the sea level to rise due to thermal expansion. Much of the rest of the heat is continuing to melt the ice caps in the Arctic and Antarctic.
-
Re:I live in Montana. I'm looking forward to it.
Why would the ice in the Arctic and Antarctica be melting if the earth is cooling?
-
Re:Weather is NOT climate
No, ice at both poles has been melting: Antarctic ice is melting and Arctic ice is melting. Sea level is rising mostly because of thermal expansion and also the previously mentioned melting. You can also just look at the instrumental temperature record. You can see the warming and its effects, right?
-
Re:It's about time
-
Re:Where does 7 feet of water come from?
It isn't. The GRACE study is invalid due to calibration issues.
When it comes to sea ice - it's at record levels:
-
Re:Where does 7 feet of water come from?
If you think about it a seven-foot rise in water is not very reasonable to predict - it has to come from somewhere and there is just not that much water locked up in ice anymore.
Really?! Are you even fucking trying anymore?
If all land ice melted, sea level would rise approximately 70 meters (230 feet) worldwide.
-
Re:The Science is settled!
From TFA (2007): "Gore said that Arctic ice could be gone entirely in 34 years, and he made it seem like a really precise prediction"
OK, it's been 6 or 7 years since then. Would you say the artic ice is substantially less, substantially more, or about the same from then?
Hint: data at http://nsidc.org/arcticseaicen...
Eyeballing the data, there's a ton of noise but there is a decent trend in there. And the data in the last 7 years doesn't look like it is violation of that trend, or the prediction voiced by Mr. Gore.
-
Re:The Science is settled!
The arctic is not yet ice-free, but it's getting there. If you would like to look at the raw data, I suggest Arctic Sea Ice News from the National Snow and Ice Data Center.
-
Re:Meanwhile, in reality world...
As a matter of fact I do have a theory! This is a bit clearer.
Basically you were right about the heat capacity of the water being important. It sounds like the slightly warmer air and upper ocean means the new sea ice is a lot saltier (cold drives the salt out). Normally salt gets squeezed out by the cold, it makes the water underneath extra salty, that cold salty water sinks and it replaced by new warmer water. This new warmer water accelerates the melting process.
When the air is slightly warmer the salt stays in the ice and the changeover doesn't occur to the same degree. Instead of warmer water to melt the ice all you have is warmer air.
-
There are two "Arctics"
The Arctic and the Antarctic.
It's a good thing that the amount of ice in the Antarctic is growing.
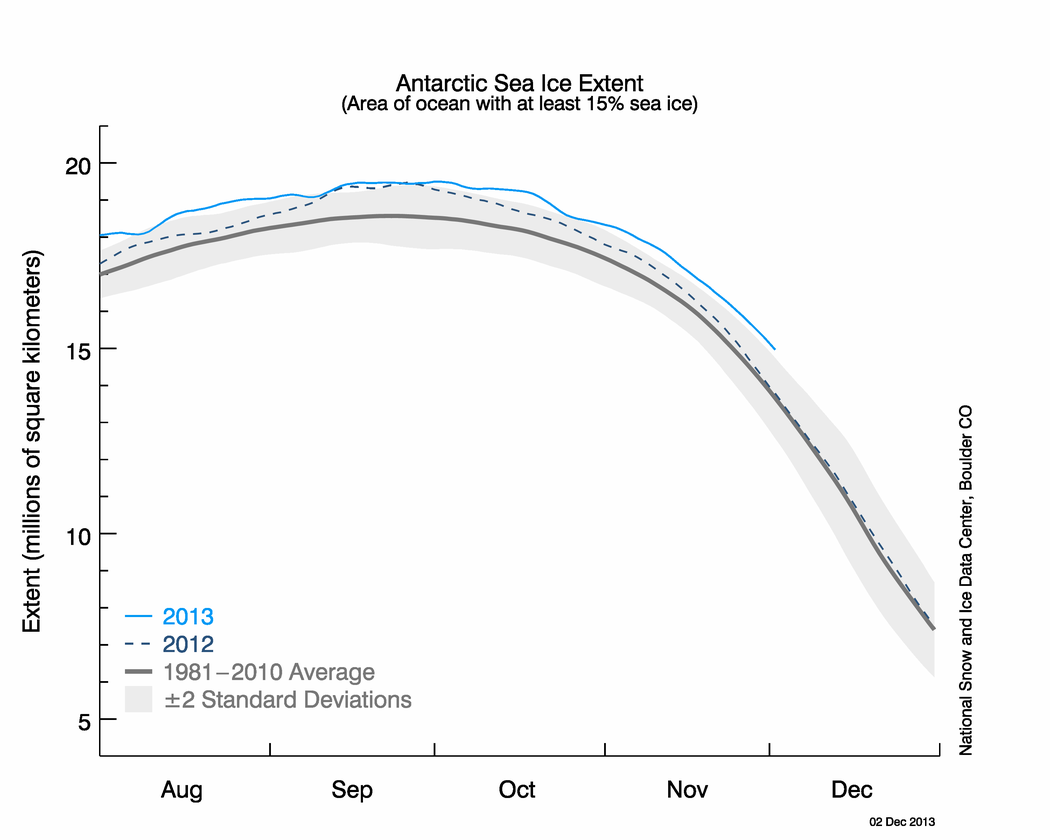
Antarctic sea ice extent continues to track very high in January, reaching the second-highest monthly extent in the 36-year satellite monitoring record. New monthly extent records were set for each month between August and November, and December was tied for the record (within the limits of the precision).
http://nsidc.org/arcticseaicen... -
Re:Maybe if the US stopped using fraudulent data
Now we just need to convince the Arctic ice, Antarctic ice, and Greenland ice sheet to stop their damn melting. Please do tell them about the fraudulent data they're using.
The further north you go the more liberal you get, the US north is more liberal than the US south, Canada is far more liberal than the US north, and Northern Europe is notoriously liberal.
The Arctic ice and Greenland ice sheet are so liberal they're gay married and are probably melting just to collect welfare and refreeze later with the free health care. The damn commies are further left than Sean Penn's dry cleaned underwear.
-
Re:Maybe if the US stopped using fraudulent data
Now we just need to convince the Arctic ice, Antarctic ice, and Greenland ice sheet to stop their damn melting. Please do tell them about the fraudulent data they're using.
-
Re:Which shows that people don't understand
It does. End of story.
Oh, you wanted a document? What about doing your own research, you lazy slacker?
http://nsidc.org/cryosphere/glaciers/questions/climate.html
http://climate.nasa.gov/evidence
http://www.geosociety.org/positions/position10.htm
(etc.. etc...)And you are conflaing two things: the aquifer situation is the western United States, which is very preoccupying, to say the least, and global warming, which is definitely not going to improve the situation of said aquifers.
-
Re:Pshaw... it's just weather!I don't know whether you're cherry-picking or just ignorant. From the National Snow & Ice Data Center:
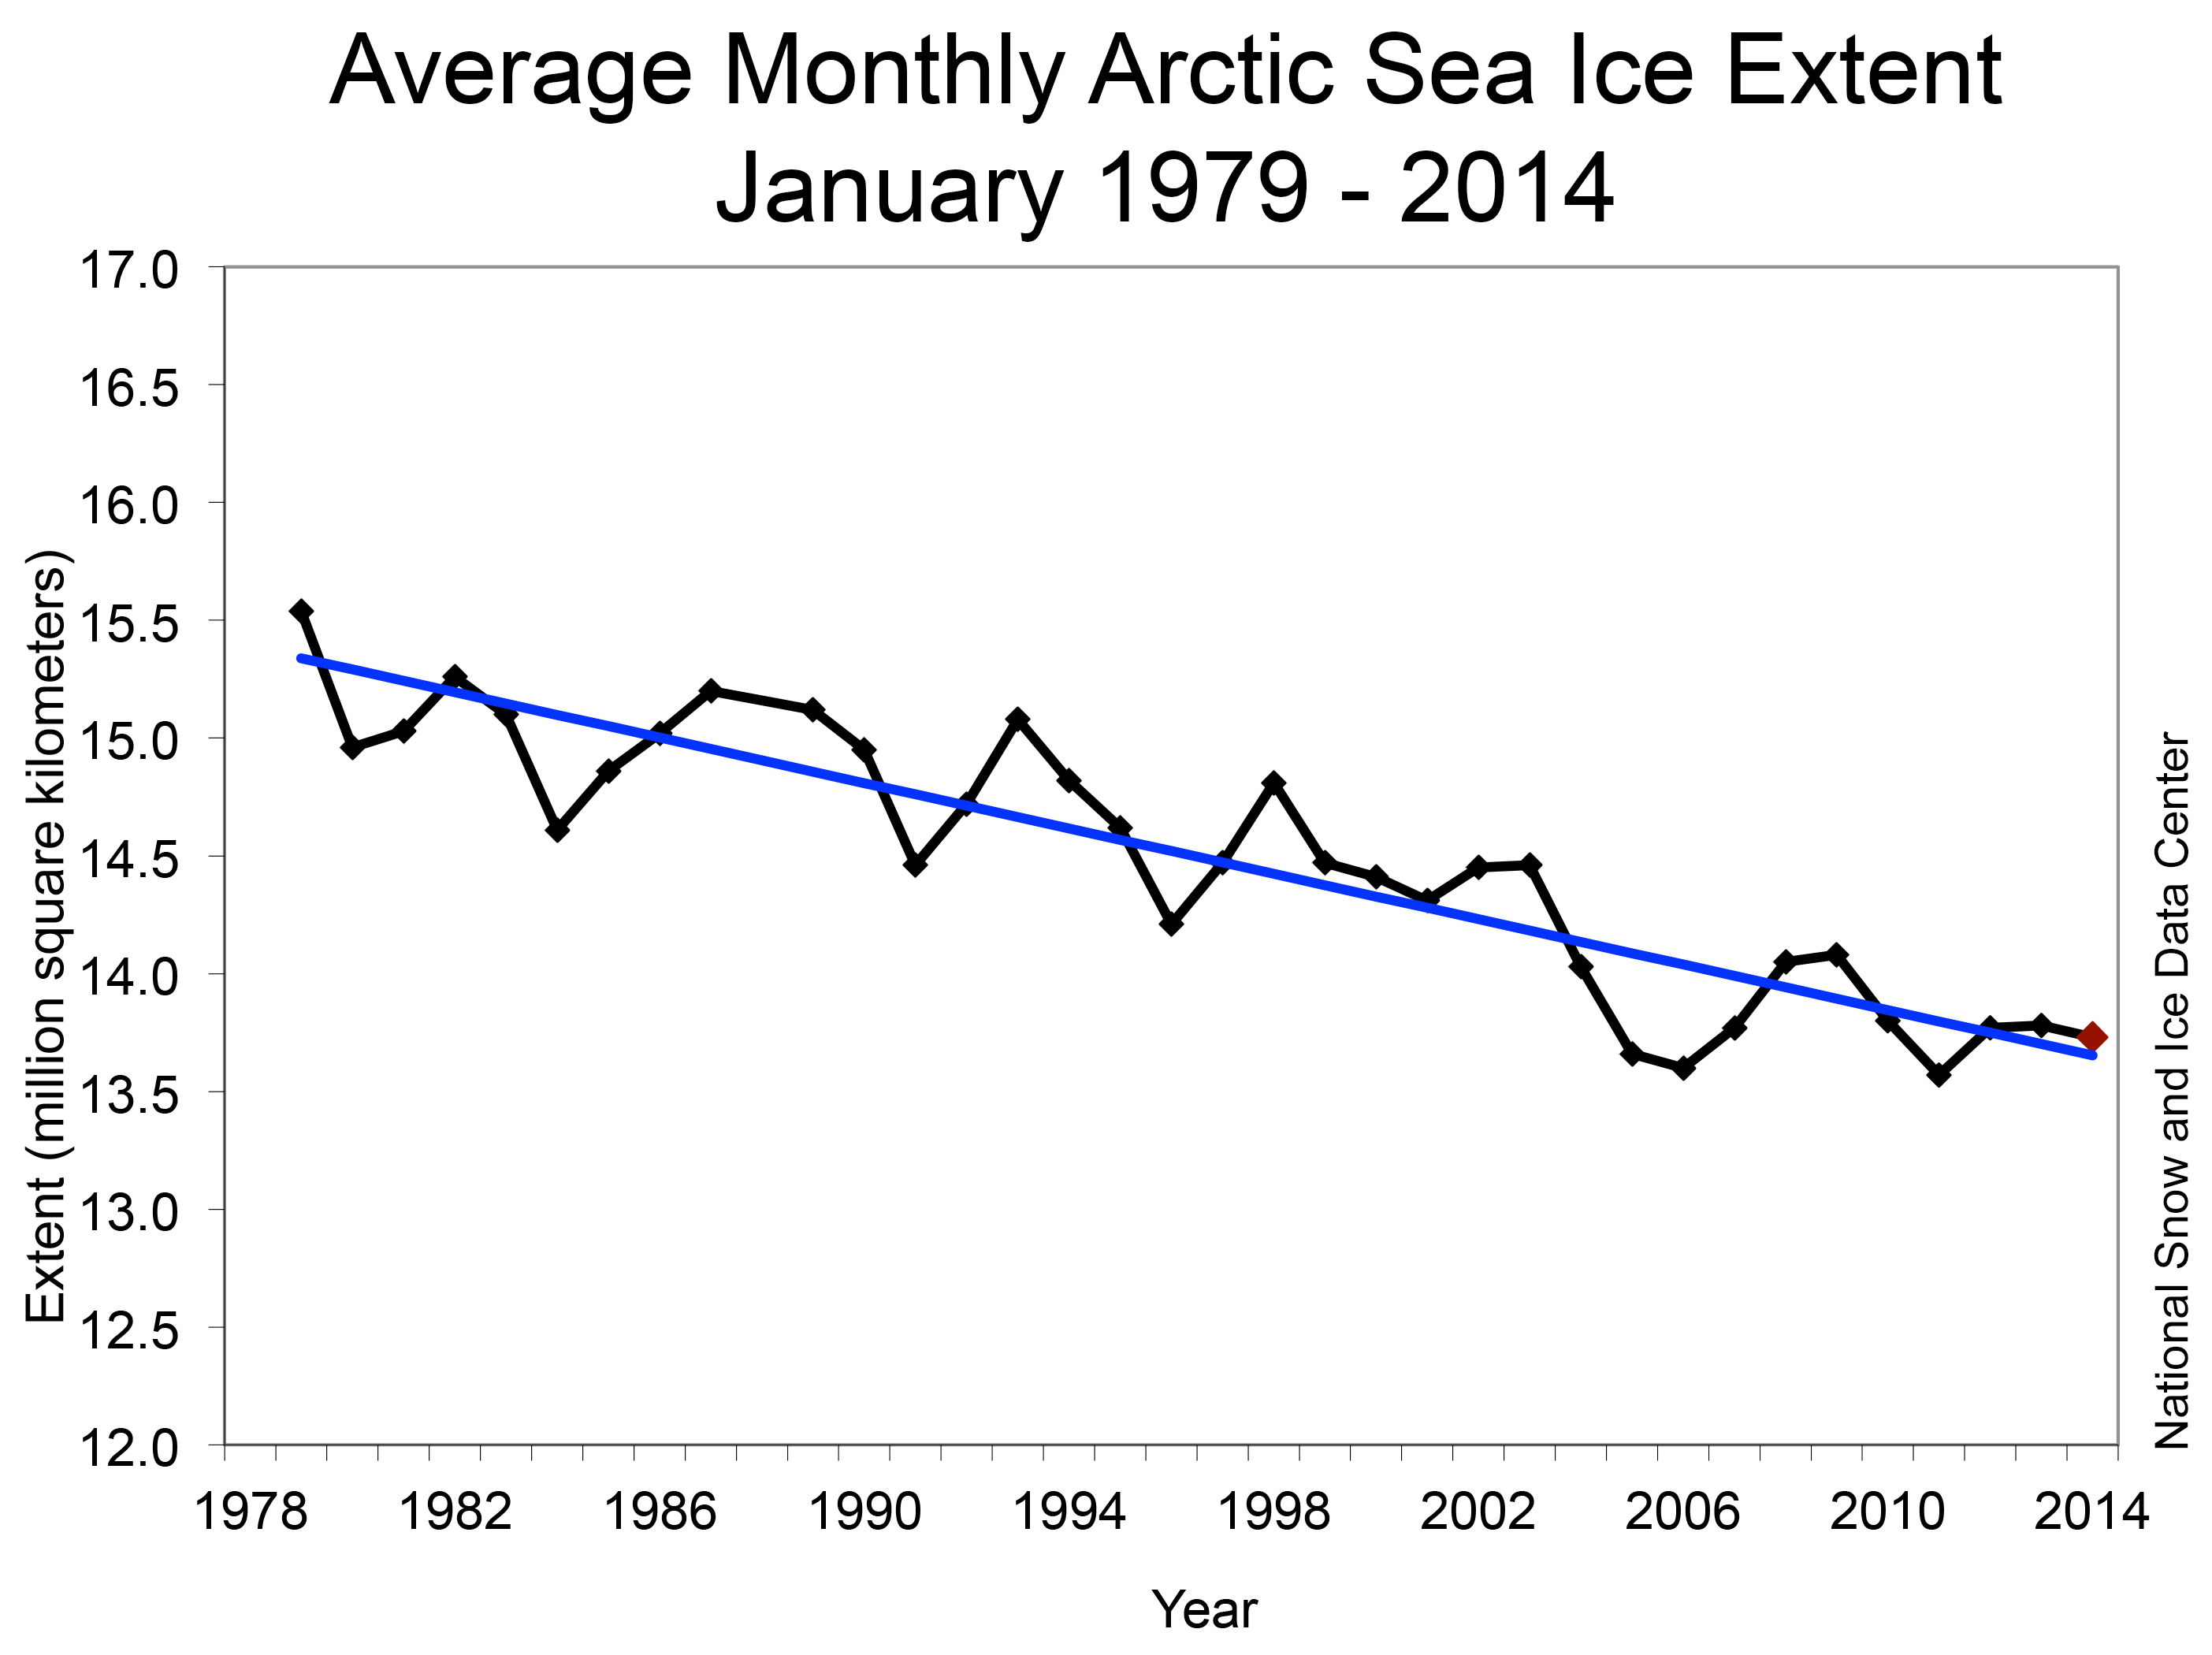
Arctic sea ice extent for December was 12.38 million square kilometers (4.78 million square miles). This is 700,000 square kilometers or 270,300 square miles below the 1981 to 2010 average, making it the 4th lowest December extent in the 36-year satellite data record.
-
Re:Cue the climate change deniers ...
No. Global warming is the observation that the mean temperature of the earth has increased over the past several decades, as shown in this graph. Only warming is proof of warming. We can also see effects of this warming, such as the Arctic ice and Antarctic ice melting.
-
Re:Unforeseen
NatGeo's article on this particular topic answers a lot of questions you won't find on general news sites: http://news.nationalgeographic.com/news/2014/01/140103-antarctica-ship-icebreakers-science-ice-trapped/
Their answer to your particular question, according to NatGeo, is this:
"The U.S. has two of the most powerful non-nuclear icebreakers in the world, the Polar Sea and the Polar Star. They can break over 6 feet [1.8 meters] of ice continuously at [a speed of] three knots. [One of Russia's largest nuclear-powered icebreakers, considered the strongest in the world, could break] probably upwards of ten feet [three meters]. [A ship that is merely "ice-capable"] would break 3 feet [0.9 meter] of ice or less at that speed."
And if you really get bored, here's an article about how sea ice is very different in the Antarctic compared to the Arctic: http://nsidc.org/cryosphere/seaice/characteristics/difference.html
Relevant from that article: "Because sea ice does not stay in the Antarctic as long as it does in the Arctic, it does not have the opportunity to grow as thick as sea ice in the Arctic. While thickness varies significantly within both regions, Antarctic ice is typically 1 to 2 meters (3 to 6 feet) thick, while most of the Arctic is covered by sea ice 2 to 3 meters (6 to 9 feet) thick. Some Arctic regions are covered with ice that is 4 to 5 meters (12 to 15 feet) thick."
I could have sworn Netflix had a documentary series that covered icebreakers in one episode, but I can't find it now - it may be one of those things that comes and goes in their catalog.
-
Re:Ironic
"It is the largest one-year increase in Arctic ice since satellite tracking began in 1978. "
That quote is a little short on information or taken out of context. I assume that it's talking about the Arctic sea ice minimum in September. Yes, that minimum in 2013 was considerably larger than it was in 2012. However, it's still the 6th lowest sea ice minimum in the record (since 1979) and well below the 1981-2010 average. Lately, in December of 2013 the sea ice extent is near a record low for the date so the larger 2013 minimum extent didn't really help much. The National Snow Ice Data Center has the graph.
-
Re:Just remember now... it's just weather?
Apparently these "climate scientists", their families and friends on this tour of Mawson’s camp site can't tell the difference between weather and climate. It appears they so believed in declining Antarctic ice they forgot to look at the weather and recent trends. There's an unprecedented amount of ice down there and these fools ignored that and went ahead and tried to complete their tour of a historic site. Exactly who are the idiots here?
-
Re:And the relation to global warming...
the ice just suddenly formed around the ship while it was traveling by a local reversal of global warming
The amount of sea ice in Antarctica is currently above normal, above where it was when we first started measuring it and the second highest on record.
Don't know about "suddenly".
http://nsidc.org/arcticseaicenews/files/2013/12/Figure4b.png
-
Re:Antarctica ... Ice
This may have something to do with the difference between the Artic and the Antarctic. Increased temperatures have two different effects: they cause ice to melt; but they also increase evaporation of surrounding seawater, which increases moisture content in the atmosphere, which increases snowfall and hence the accumulation of new ice.
For some reason (possibly because the Antarctic is on land, so it can't melt from underneath?), the first effect dominates for the Arctic, and the second effect dominates for the Antarctic. Take a look here (and search down to the plot under the text "Antarctic Sea Ice Extent"). The long-term trend, over the last three decades, is for Arctic ice to shrink and Antarctic ice to grow. This story, which relates to unusually thick ice in the Antarctic, is entirely consistent with this trend.
-
Two standard deviations more
The Antarctic Sea Ice Extent is currently more than two standard deviations greater than the 1981 to 2010 average according to the NSIDC.
http://nsidc.org/data/seaice_index/images/daily_images/S_stddev_timeseries.pngNot what one would expect in a warming climate. Or maybe it is
Antarctica Sea Ice Reaches Record High: Doesn't Refute Global Warming
http://guardianlv.com/2013/09/antarctic-sea-ice-at-record-high-doesnt-refute-global-warming/ -
Re:history?
See links below:
Charts from 1893 - 1956 -
Re:LMAO
It's below the long term average (by a million square km), and there are exactly two data points, so only a fool would consider that an upward trend. Also the years with lower ice extents are 2007, 2008, 2010, 2011 and 2012.
You're just seeing what you want to see and ignoring everything else.
-
6th highest minimum extent since 2002
"Recorded History" on arctic ice extent is pretty damn short. The National Snow and Ice Data Center (NSIDC) used to list something they called the '1979-2001' average and then showed that, based on that, the current ice extent was pathetically low. Lately, they have switched to showing the '1981-2010' average because the early years of satellite measurements have been found to be wildly inaccurate. Better quality data has only been available since 2002 and, based on that, 2013 is the 6th highest ice extent minimum on record.
-
Re:Why only the Northern Hemisphere?
I'm not sure where you got that graph, but it doesn't match the official statistics from the NSIDC. There is absolutely a statistically significant trend in Antarctic ice, both in minimums and maximums. In fact, the minimum trend is even more pronounced than the maximum trend. Now, had you argued that the ice melt in the Arctic far exceeds the gains in the Antarctic (by about 3 times) I'd agree with you but as-is you are very much overly minimizing the gains in the Antarctic. http://nsidc.org/arcticseaicenews/2012/10/poles-apart-a-record-breaking-summer-and-winter/
-
Re: Bullshit!
Yes.
Also, ditto on arctic sea ice volume, which is a more meaningful metric
-
Re:Basic Statistics Deception
It's business as usual in AGW-land. Yet another unforseen event? No worries, blame it on CO2 and add another complexity layer on the model.
I expect their models to start matching reality at about the same time as global climate control becomes reality.Hopefully they will stop predicting catastrophes all the time by then.
A temporary bounce back after an extremely rapid decline can hardly be called unexpected. Regression to the mean.
Which climate model predicted catastrophes all the time? None that I've heard of.
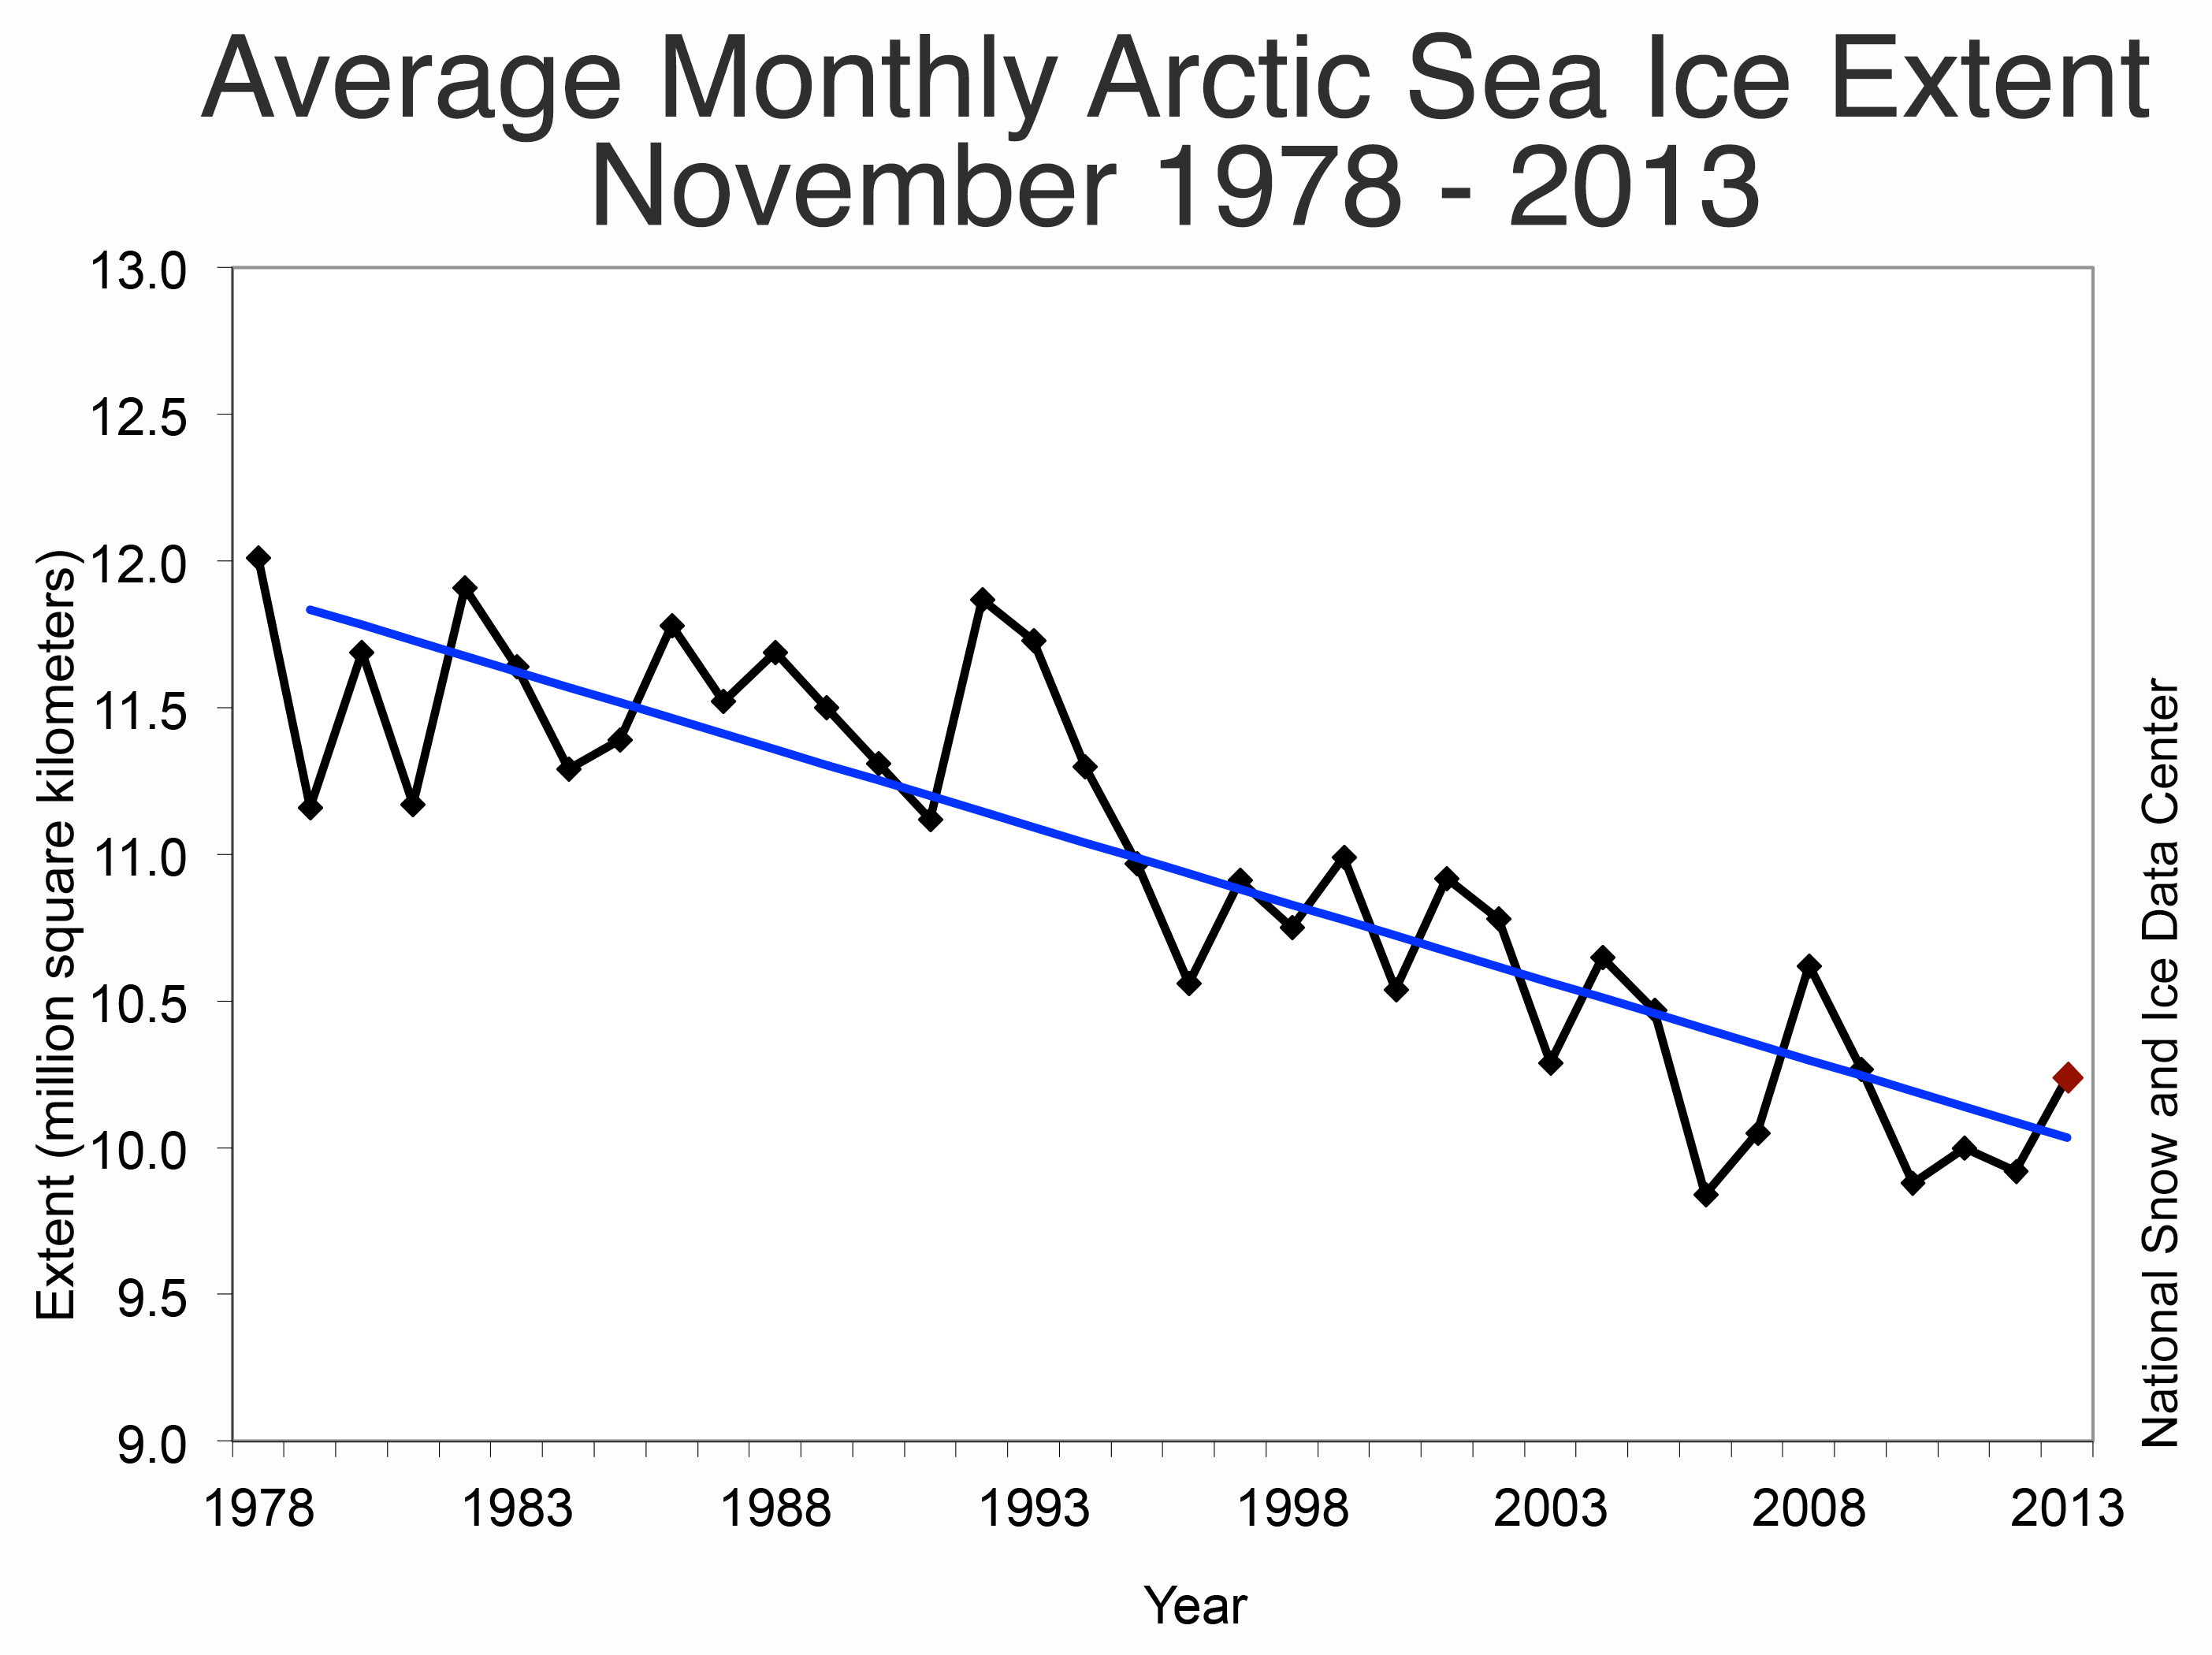
Follow the link http://nsidc.org/arcticseaicenews/ and scroll down to the chart that shows month of August ice extent 1979 to 2013. That really puts it into perspective. Also notice how they've made things look better than they are (not worse as conspiracy theorists would expect) by fitting a line instead of say a second or third order polynomial.
-
What unforseen event?
80% of climate scientists who were asked last year expected more ice this year than 2013. So this is hardly an unforseen event. The blog link mentioned in the summary explains why, but I'll repeat it since you didn't read it.
Arctic ice volume has a falling long-term trends, but on top of that there are short-term year-by-year changes. You effectively have a long-term signal with short-term noise on it. As you can see from this figure, the trend is about -0.065 million square kilometers per year, while the year-to-year variations are 0.5-1 million square kilometers. Hence, on a short timescale you can basically only see the yearly random variations. If you suddenly see a large jump, it is much more likely to be a short-term change than a long term one, and several years of observations are needed to see if the long-term behavior has changed or not.
The point now is that if you happen to get a particularly low value of the random yearly variations one year, you are likely to get a larger value the next year. Much like if you roll a die and get a 1, you are likely to get a larger value the next time you roll, simply because there are more values (2,3,4,5,6) that are larger than 1 than those that aren't (1). In general, extreme values are unlikely, and the chance of getting several of them in a row is much lower than getting one of them followed by less extreme values. This is called regression toward the mean.
So to summarize, this was expected, and predicted, and no models will have to be changed based on this observation.
%20?)