 Slashdot Mirror
Domain: nsidc.org
Stories and comments across the archive that link to nsidc.org.
Comments · 236
-
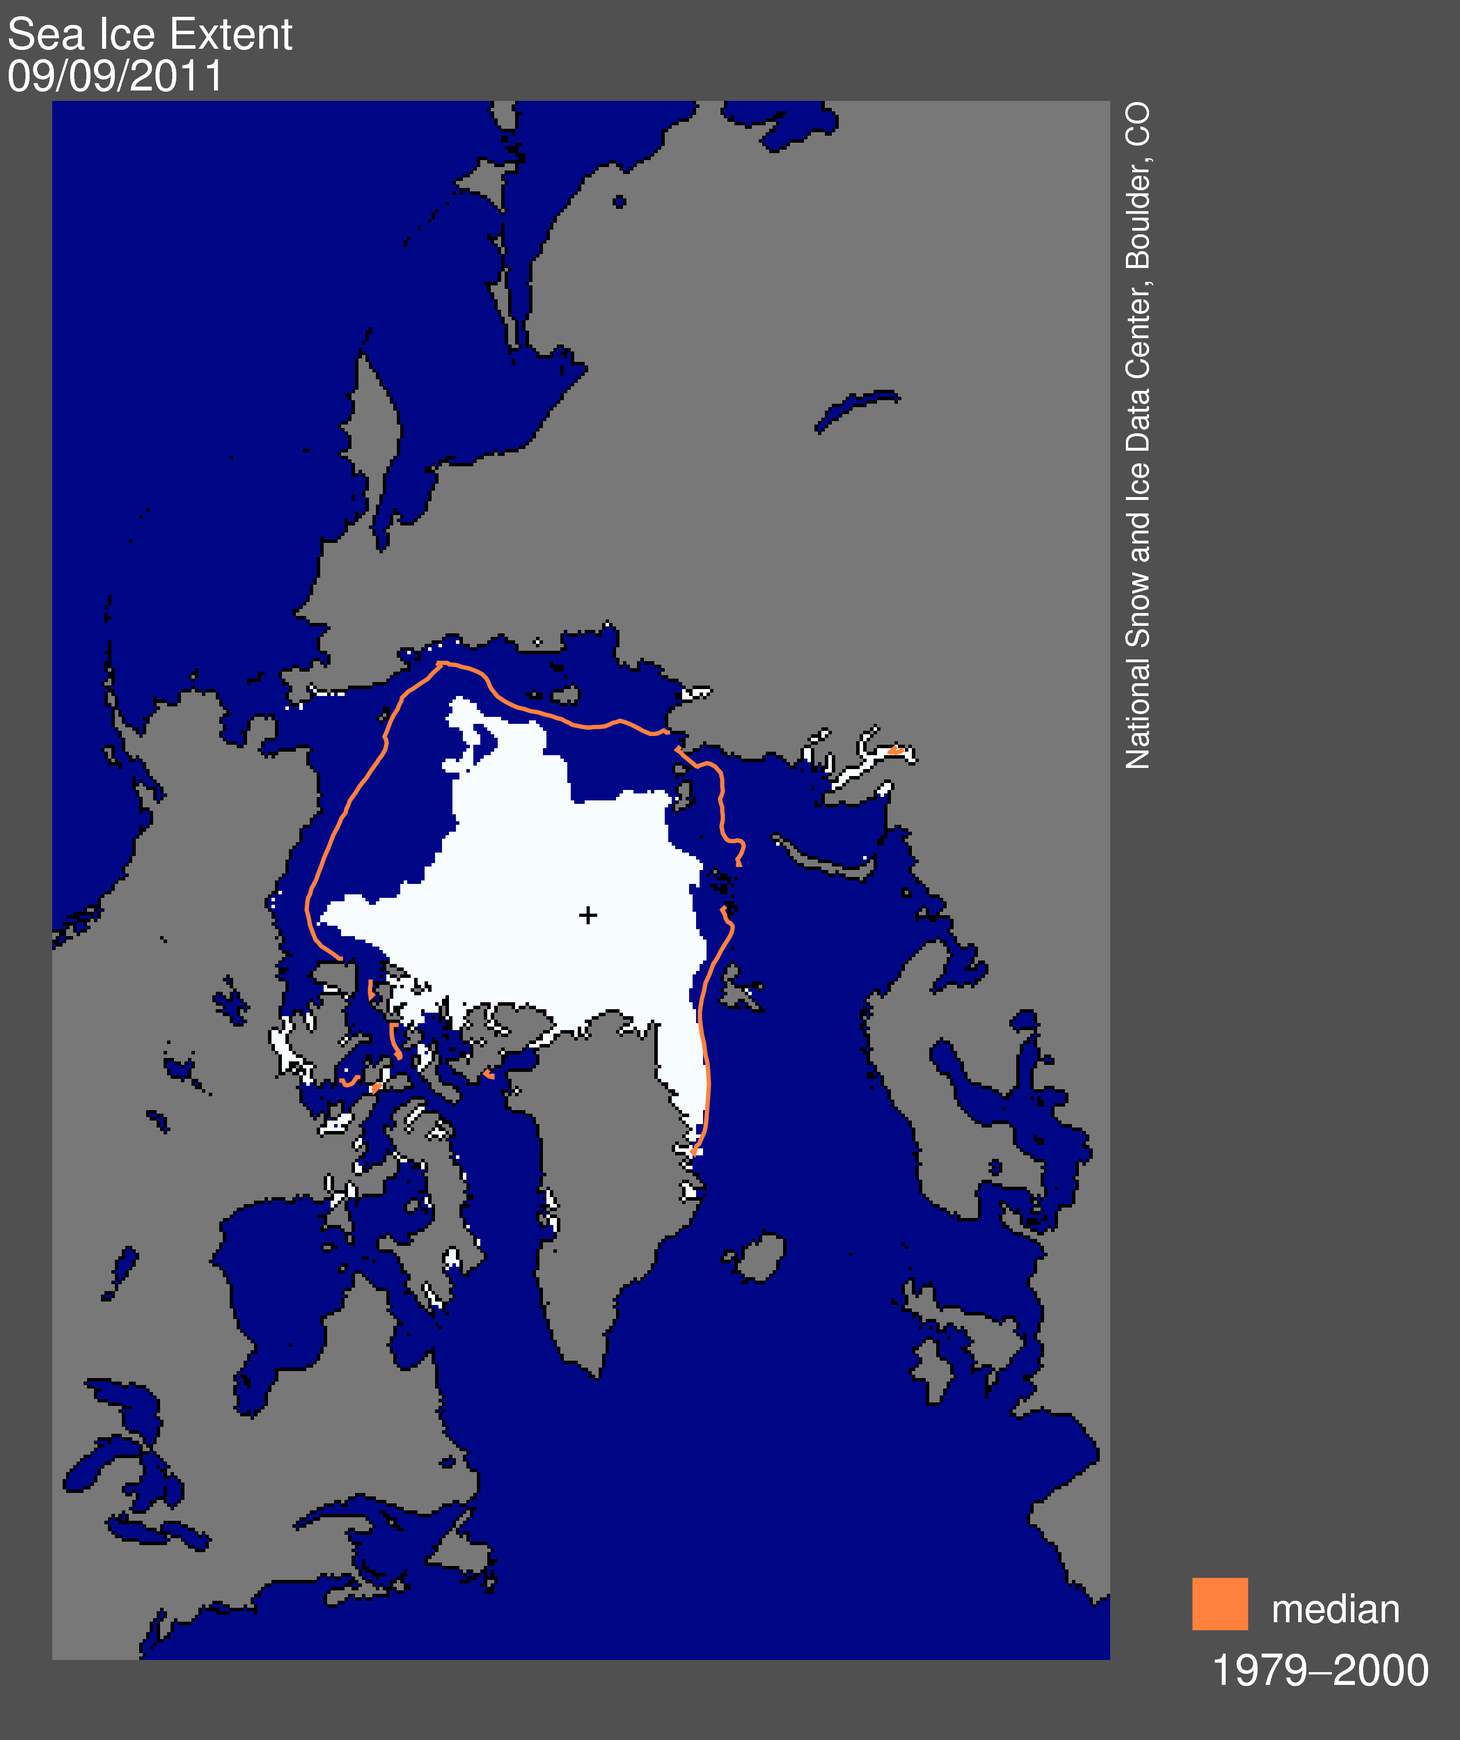
Pic says it all
http://nsidc.org/arcticseaicenews/files/2000/09/Figure31.png
Or see third chart on left if that link dies:
http://nsidc.org/arcticseaicenews/ -
Pic says it all
http://nsidc.org/arcticseaicenews/files/2000/09/Figure31.png
Or see third chart on left if that link dies:
http://nsidc.org/arcticseaicenews/ -
Re:Let's ignore the fact that arctic ice is normalArctice sea-ice extent might not be as helpful as you think:
Extent
Extent defines a region as either "ice-covered" or "not ice-covered." For each data cell, it is a binary term; either the cell has ice (usually a value of "1") or the cell has no ice (usually a value of "0"). A threshold determines this labeling. A typical threshold is 15 percent, meaning that if the data cell has greater than 15 percent ice concentration, the cell is labeled as "ice-covered." The Sea Ice Index products have a threshold of 15 percent. A threshold can also be as high as 30 percent.
Extent is sometimes described in terms of area (in square kilometers) covered by at least some ice (above the threshold). Extent is different from the total area in that if a given region has a percentage of ice concentration greater than the threshold, the entire region is considered "ice-covered." Total area tells how much of the region is actually covered by ice. Arctic- or antarctic-wide sea ice extent is always a larger number than area.From the National Snow & Ice Data Center.
If it only takes 15 percent coverage of an area for it to be considered "ice", then an arctic ice pack that is getting thinner and more spread out and thus melting faster could easly appear to be larger than it really is. After all the ice from square kilometer could be spread across 6 kilometers and though the same amount of ice is present in each scenario, the second would appear to have 6 times as much ice. Because of this problem, volume measurements tend to be more reliable and informative than sea ice extent. -
Re:Global warming
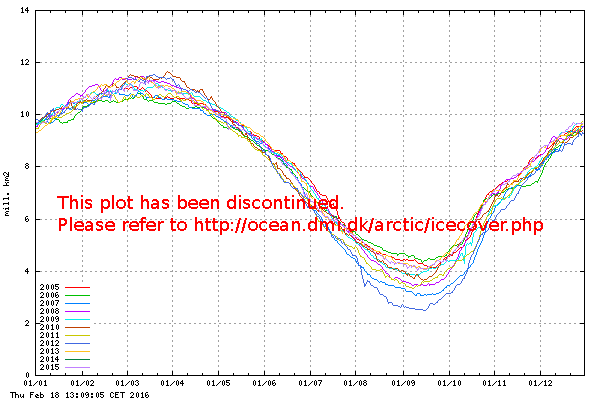
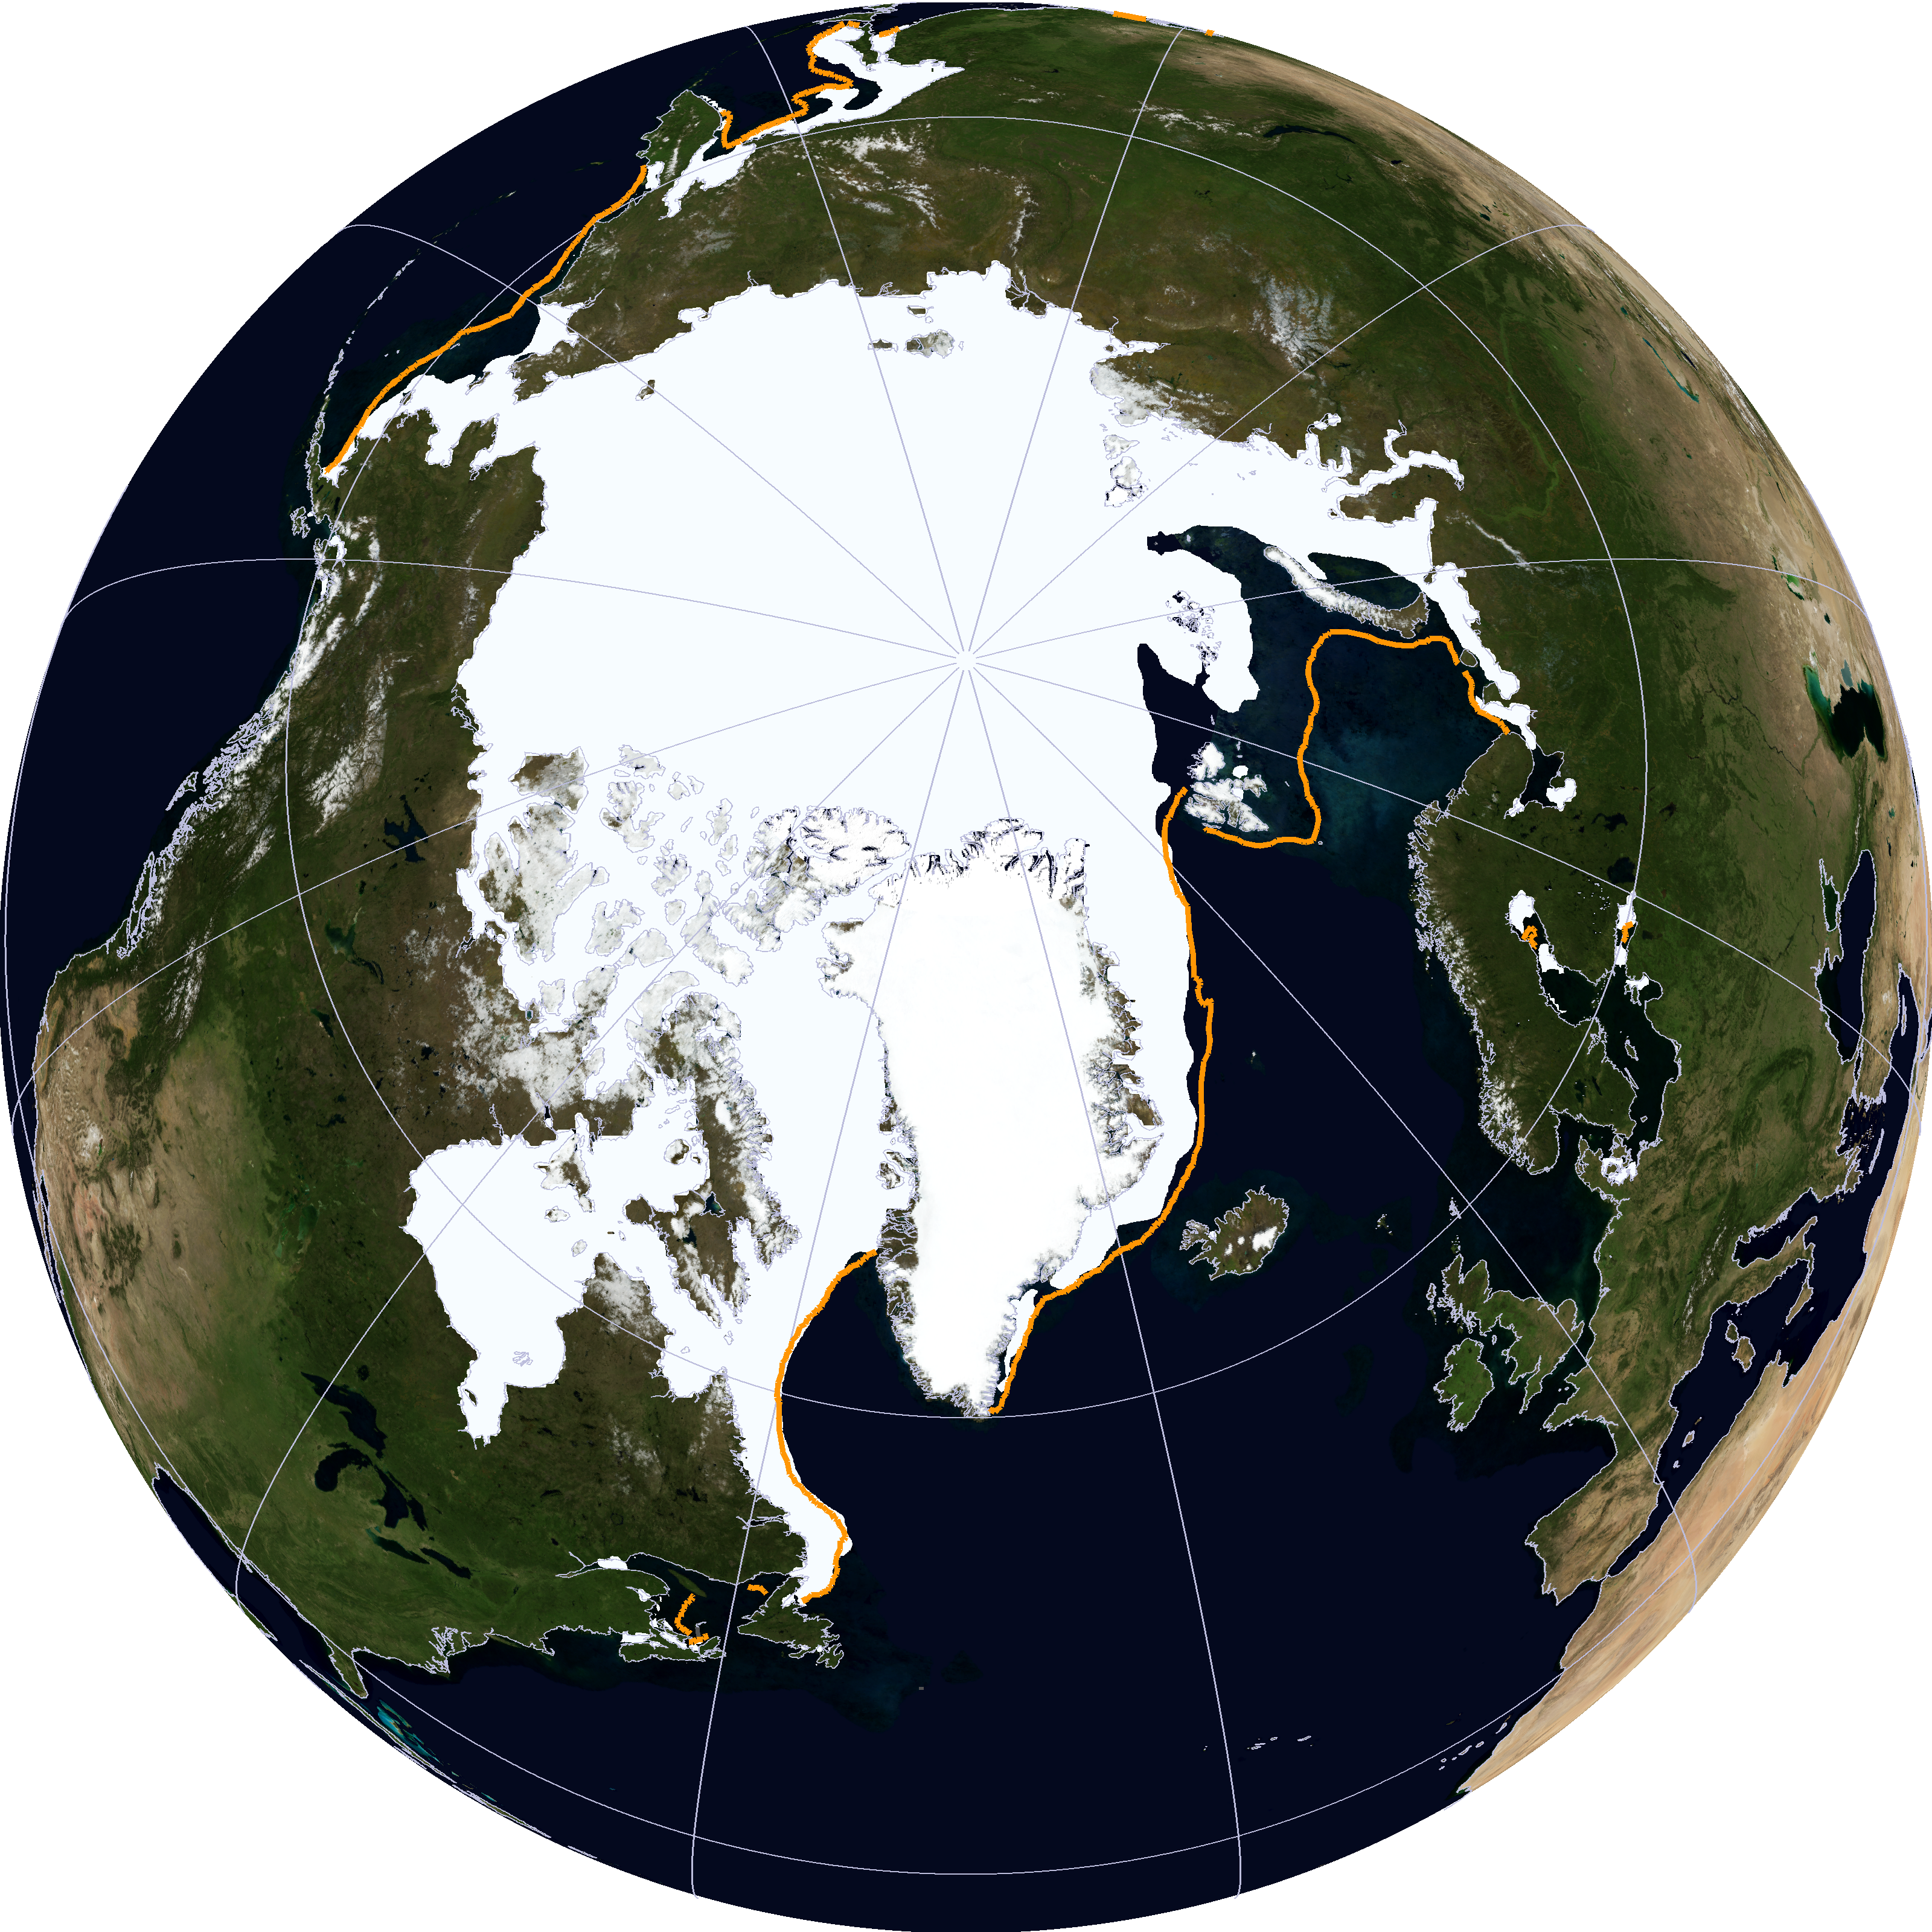
So the scientists are postulating that our spring is cold because the arctic Sea Ice is greatly diminished; then they publish a scary looking picture show lots of open water, but wait, that picture is from August 2012, going to the Danish Meterological Institute's site we see how bad it was infact august, september and november had dramatic reductions in Arctic sea-ice sea ice extend, yet it is now spring, a cold spring it seems, and what do we see, Arctic Sea-ice extent is at several time higher than it has been in the last 7 years, so what does it look like today well the National Snow and Ice Center says it looks like This!
So if a lack of Arctic ice cause cold spring weather, then I should be unpacking my bathing suit!
-
Re:No warming for past 12 years
12 years is a climatologically insignificant length of time in which natural variation can easily overwhelm the global warming signal. Things like the lower than normal solar cycle we are in right now and the series of La Nina years lately can have that effect. If the 1998 temperature record has not been broken by 2020 then you might have something there.
From the National Snow & Ice Data Center's Arctic Sea Ice News web site (March 6th update):
Average sea ice extent for February 2013 was 14.66 million square kilometers (5.66 million square miles). This is 980,000 square kilometers (378,000 square miles) below the 1979 to 2000 average for the month, and is the seventh-lowest February extent in the satellite record. Since 2004, the February average extent has remained below 15 million square kilometers (5.79 million square miles) every year except 2008. Prior to 2004, February average extent had never been less than 15 million square kilometers. Ice extent remains slightly below average everywhere except the Bering Sea.
Doesn't sound like Arctic ice is making a comeback to me.
The Antarctic sea ice maximum has increased somewhat but only about 1/4 as much as the Arctic sea ice minimum has declined. Since Antarctic sea ice melts completely away every year it doesn't stay above average ever but drops back to a average of 0 every year. Meanwhile the Antarctic ice sheet continues to lose ice.
-
Re:Press coverage
They aren't that stupid, they just choose to be! There was a
Based on what is readily available, linking the ice melt in the north to global warming is incorrect. This does not mean there is no global warming, I personally believe the earth is still warming from the mini-ice age that just ended http://en.wikipedia.org/wiki/Little_Ice_Age.
Below are reports on what is going on. Both state facts that can be shown to draw separate conclusions. The really interesting thing is we are past the 2nd standard deviation for antarctic ice growth, which is exceeding the amount of ice lost so we are in a net positive. Just try to explain this to the average Joe and watch them lose interest really fast! Use a car analogy and you still don't get anywhere. Once evidence is shown that seems to conflict most humans ignore it because understanding the complexity exceeds the effort to survive the next week.
Earth Loses Its 'Air Conditioner': Arctic Ice Cap Shrinks to Record Low Level
http://www.pbs.org/newshour/bb/science/july-dec12/icemelt_09-20.html
http://nsidc.org/news/press/2012_seaiceminimum.htmlPolar sea ice could set ANOTHER record this year
Exceptionally large amounts of it down south right now
http://www.theregister.co.uk/2012/09/21/arctic_antarctic_sea_ice_record/ -
Re:Press coverage
Except that Antarctic sea-ice is about as much above average as Arctic sea-ice is below average, they tend to run counter-cycle to each other; net change is probably nill.
-
Re:Wow.
William Ewing (Columbia Univ), back in the '50s, said that he had evidence of a 60-year freeze/thaw cycle for the Arctic Sea. Evaporation from an ice-free Arctic Sea fed snow falls on Siberia, Canada and Greenland resulting in glaciers sending floes into the Arctic Sea. As the Sea got covered up the evaporation slowed and so did the glaciers. Rinse and repeat.
Well, that would mean there should have been as little ice when he said that as there is now. http://nsidc.org/cryosphere/sotc/sea_ice.html
Satellite data from the SMMR and SSM/I instruments have been combined with earlier observations from ice charts and other sources to yield a time series of Arctic ice extent from the early 1900s onward. While the pre-satellite records are not as reliable, their trends are in good general agreement with the satellite record and indicate that Arctic sea ice extent has been declining since at least the early 1950s.
Next!
-
Re:What's really scary about this...
If by "THIS summer" you mean august 2012, then NO. source: http://nsidc.org/data/seaice_index/
-
NSIDC hasn't called the record yet
If you read response #4 of this update from Real Climate, you will see that the National Snow and Ice Data Centre hasn't called the record low yet (as of 26 Aug 2012 at 12:04 PM), since they use 5-day moving averages on their graphs. The graph referred to by the realclimate.org update and I think in the OP is based on daily data. The response is from Walt Meier of the NSIDC. I'll quote it here:
These are daily values, not the 5-day average, which is not quite at a record yet. Using a 5-day average removes some of the noise due to weather and other effects that cause small errors in the daily values. Thus the 5-day estimate is a more robust measure of sea ice changes. We will make an announcement on our web site when we have passed the current record: http://nsidc.org/arcticseaicenews/
Walt Meier
NSIDC
I think however that there are other data series that do agree that the record has been broken, even with 5-day averages. Here is my favourite data compilation for Arctic Sea Ice. It contains many different graphs from different sources. Taken together, the data paints a disturbing picture.
-
Re:Scientific review
And across the Arctic in the Barents and Kara Seas the ice levels have been extraordinarily low this year. Overall the level of ice in the Arctic has been slightly below average for this time of year. I have my doubts that "the longest it has ever been present." is accurate too.
-
Re:Scientific review
The Bering Strait had a record amount of ice still in the ocean well into April, the longest it has ever been present. If this ice was present in December, your argument may be valid. April is not winter, and the ice should not have been there.
And across the Arctic in the Barents and Kara Seas the ice levels have been extraordinarily low this year. Overall the level of ice in the Arctic has been slightly below average for this time of year. I have my doubts that "the longest it has ever been present." is accurate too.
Worth noting that theory of evolution was formed about 160 years ago, physics has been evolving for thousands of years, and tectonic plate theory is about 100 years old. Thirty years old for a scientific THEORY is nothing. And with people like you shooting down any critical review, of course there will be no peer review.
Fourier first noted that carbonic acid gas (CO2) absorbed infrared radiation in the 1820's. Tyndall quantified the effect in the 1850's. Arrhenius stated "if the quantity of carbonic acid increases in geometric progression, the augmentation of the temperature will increase nearly in arithmetic progression." in the 1890's. Ever since then we're just filling in the details.
-
Re:No Alaska
What you fail to mention is that while the Bering Sea ice has set records the Barents and Kara Seas above Europe have unusually low. So the overall ice extent has still been below normal. This page at Arctic Sea Ice News and Analysis explains it pretty well. The high extent of ice in the Bering Sea has as much to do with high winds pushing the existing ice south which opened up leads which subsequently freeze over as it does with cold temperatures.
-
Re:Er, Your Statement and His Don't Quite Mix
however, during that same time period, the sea ice in the Antarctic, you know, at the other end of the planet, has been increasing. uh oh.
First of all, it's important that people know what "sea ice" is and its not. It *is* frozen sea water, which in the Antarctic mostly melts in the summer. It is *not* the permanent Antarctic ice sheets, which originate in glaciers (land ice, not sea ice, even though it is on the sea). The ice sheets are losing about 40 gigtons of mass per year[5].
Second, the gain in sea ice in the Antarctic is tiny, and it is not the result of atmospheric temperature decreases. There has been an increase in Antarctic atmosphere temperatures [1], accompanied by a stronger winds blowing cold surface water to the northwest which produces the increase in winter sea ice extent [2]. In the lee of the Antarctic Peninsula, which blocks this surface movement, there has been a dramatic decrease in sea ice [3]. Another factor is that slightly warmer surface temperatures can actually lead to an increase in ice extent by reducing the salinity of water near the edge of ice-formation[6].
Overall, the changes in polar sea ice are consistent with models predicting CO2 induced global warming [2][4], and in any case land ice is a much better indication of antarctic temperature changes, and that has being lost; if the small sea ice increases we've been seeing were due to cooling, we would see an equilibrium or gain in land ice.
CITATIONS:
[1] http://www.nature.com/nature/journal/v457/n7228/abs/nature07669.html
[2] http://nsidc.org/arcticseaicenews/faq/#wintertimeantarctic
[3] http://nsidc.org/cryosphere/quickfacts/seaice.html
[4] http://www.sciencemag.org/content/278/5340/1104.short
[5] http://adsabs.harvard.edu/abs/2010EGUGA..12.6127I
[6] http://psc.apl.washington.edu/zhang/Pubs/Zhang_Antarctic_20-11-2515.pdf -
Re:Ocean gun?
Yes, wind has spread the ice cap and that makes it seem like the ice is spreading. It's important, when thinking of reports of ice extent, to remember that the systems that measure this divide the region being examined into grids. If 15% of the grid is ice covered, then the grid is marked as 100% ice covered. So when the wind blows the ice around, it can make it seem like there is more ice if all you look at is the extent - that's why people use ice extent when they want to lie about arctic ice.
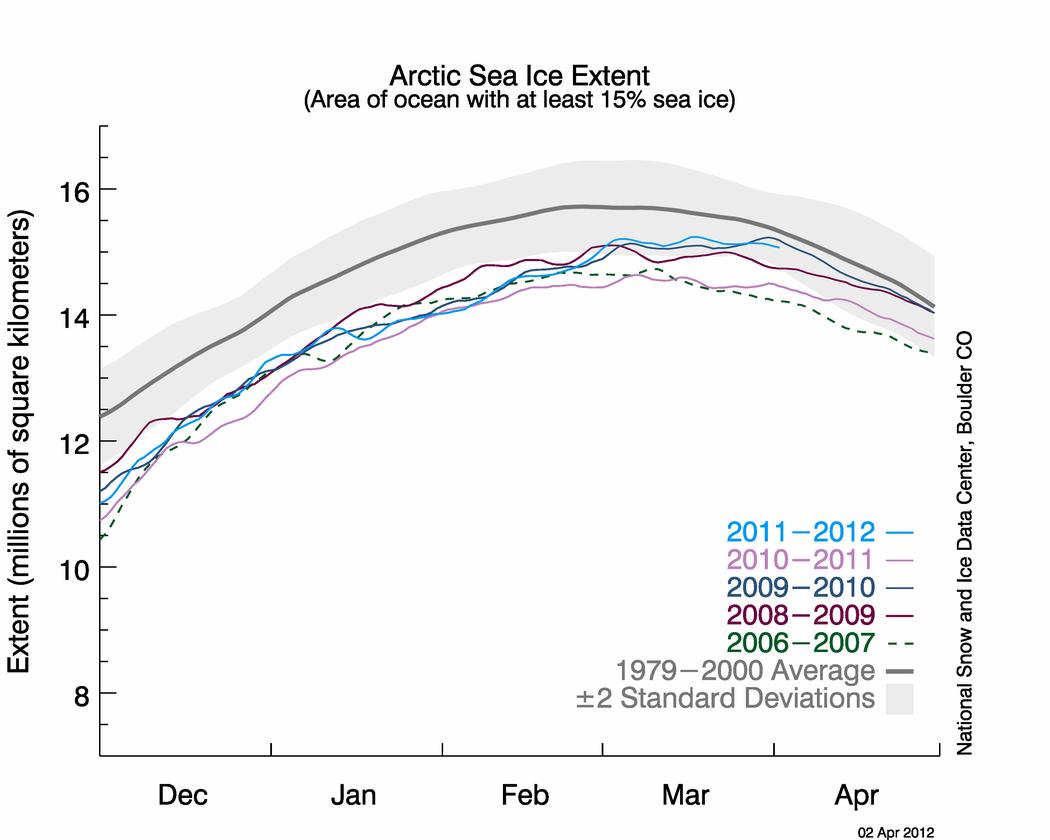
A more realistic way to look at ice is through the volume. The results from PIOMAS (http://psc.apl.washington.edu/wordpress/wp-content/uploads/schweiger/ice_volume/BPIOMASIceVolumeAnomalyCurrentV2.png?%3C?php%20echo%20time%28%29%20? ) show that there's about the same volume of ice now as there was last year. Deniers like to point out that there's a greater ice extent this year than last year (which is true - as seen here: http://nsidc.org/arcticseaicenews/files/2012/04/Figure2.png ). What does it mean if you have the same volume of ice, but a greater extent? As you point out, it means the ice is, in general, thinner and will melt faster. It should be an, um, interesting summer.
-
Re:Ocean gun?
"According to the US National Snow and Ice Data Centre in Colorado, Arctic summer sea ice has increased by 409,000 square miles, or 26 per cent, since 2007 â" and even the most committed global warming activists do not dispute this." http://www.dailymail.co.uk/sciencetech/article-1242011/DAVID-ROSE-The-mini-ice-age-starts-here.html
I'm afraid the Daily Mail was mistaken (it's a terrible paper; seriously, it's a celeb gossip rag -- don't quote from it). What the columnist was referring to was this
See in 2007 when there was a record low? The article you link to was written in 2010, so all they had was 2008 and 2009 data. See how those are both higher than 2007?
Now, those are the data that columnist is referring to. Look at it yourself. Do you think that it was honestly interpreted by the Daily Mail? Would *you* have presented those data as a trend of increasing ice?
-
Re:Ocean gun?
Don't get too terribly excited. It's always fun to quote things out of context. Even Glen Beck can do it.
FWIW, that particular phrase has been bounced back and forth via the conservative blogosphere as a mantra of All That Is Wrong with Global Warming. Too bad it's just one little tiny data point that has a variety of alternate hypothesis:
It is not clear why the maximum ice extent would happen later, given that in general, ice extent is decreasing. One possibility is that the lower winter ice extents might make it easier for ice to continue growing later in the season. With lower winter extents, a late cold snap or northerly wind could spread ice southward over ocean that would normally be ice-covered at that point. Researchers do not expect the late maximum ice extent to strongly influence summer melt. The ice that grew late this winter is quite thin, and will melt rapidly as the sun rises higher in the sky and the air and water get warmer.
The resultant climate pattern changes are unlikely to be one simple direction either forwards or backwards (warming or cooling). There will be winners and losers and the big issue is whether or not major, extinction level changes will be forced on the planet by current conditions. My reading of the field is that there is some concern about that, but it's far from certain. What is certain is that the relatively benign and stable climate patterns we've had over the past 500 years will continue. That, coupled with the ecologic pressure of up to 9 billion humans, half of which are who are trying desperately to join the 'use lots of resources' club and half of which are barely surviving, pretty much ensures that the Chinese curse of 'may you live in interesting times' comes true.
Whether or not we can change anything, however, is really open to speculation. I suspect not, but would be happy to entertain more optimistic views.
-
Re:yawn
If you paid attention to the Arctic you'd know that there is lots of open water in the Barents and Kara Sea's north of Europe where it's been extraordinarily warm. That open water and the (relative) warmth it releases forces the jet stream to dip south into Europe carrying frigid Arctic air with it.
-
Re:I am not worried about it
Okay, I stand corrected: hybridized, not "evolved".
But other than that, the article actually supports my point: it asserts that the two species came together at some point in the past, presumably at times that were warm.
Further, and more to the point: the supposition that Polar Bears are endangered by diminishing Arctic ice are just so much BS, as current Arctic ice levels clearly show... seeing as how in fact, Arctic sea ice is right now at above average levels. -
Re:How "An Inconvenient Truth" can it get
Antarctic Sea Ice Extent is above average this year; not sure what land ice is doing, but if sea ice is up, land ice is likely to be up as well. Greenland is pretty well iced in this winter too.
-
Re:Don't panic.
http://science.howstuffworks.com/environmental/earth/geophysics/question473.htm
The main ice covered landmass is Antarctica at the South Pole, with about 90 percent of the world's ice (and 70 percent of its fresh water). Antarctica is covered with ice an average of 2,133 meters (7,000 feet) thick. If all of the Antarctic ice melted, sea levels around the world would rise about 61 meters (200 feet). But the average temperature in Antarctica is -37ÂC, so the ice there is in no danger of melting. In fact in most parts of the continent it never gets above freezing.
At the other end of the world, the North Pole, the ice is not nearly as thick as at the South Pole. The ice floats on the Arctic Ocean. If it melted sea levels would not be affecteÂd.
There is a significant amount of ice covering Greenland, which would add another 7 meters (20 feet) to the oceans if it melted. Because Greenland is closer to the equator than Antarctica, the temperatures there are higher, so the ice is more likely to melt.
The numbers here are likely to be more accurate:
http://www.ipcc.ch/publications_and_data/ar4/wg2/en/spmsspm-c-15-magnitudes-of.htmlThe complete melting of the Greenland ice sheet and the West Antarctic ice sheet would lead to a contribution to sea-level rise of up to 7 m and about 5 m, respectively [Working Group I Fourth Assessment 6.4, 10.7; Working Group II Fourth Assessment 19.3].
Yet another source: http://nsidc.org/cryosphere/sotc/sea_level.html
Antarctica and Greenland, the world's largest ice sheets, make up the vast majority of the Earth's ice. If these ice sheets melted entirely, sea level would rise by more than 70 meters.
Your move. Let's see what asshole you pulled this "not more than a foot" number from.
-
Re:2020
So the cardboard isn't as thick as the paper because if you compare them there is paper (some thickness) where the cardboard doesn't exist (has no thickness)? I'm not sure how you can't understand. The Arctic sea ice is growing smaller both in surface area and thickness. It is melting. The reason it is melting is because of the warming. Playing semantic games isn't going to convince anyone otherwise, except for people who want to be willingly deceived. If you showed some evidence the ice was actually recovering, that would be actual evidence for no warming. Instead, you provide anecdotes from what happened decades ago. Whatever.
-
Re:OH, Goodie!
If you don't like the study, you can trawl through the entire inventory of world glaciers: http://nsidc.org/data/docs/noaa/g01130_glacier_inventory/. Of course, you could then complain that the data is incomplete for many glaciers, that it is tough to compare them all, and keep arguing that that list is "just as bad" as the list expressly designed to just show the ones that are growing. I don't expect you to actually man up and do one of two things: run a statistical analysis on whether the detailed list of 111 glaciers being watched closely is a good indicator of overall glacier behavior across the world, or to go out and study the evolving ice thickness of every glacier in that list.
While you're not as moronic as the guy who I replied to, you still made the mistake of equating one list picked for one criteria with a much larger list picked for completely unrelated criteria.
-
Re:The Alarmism misses a key detail
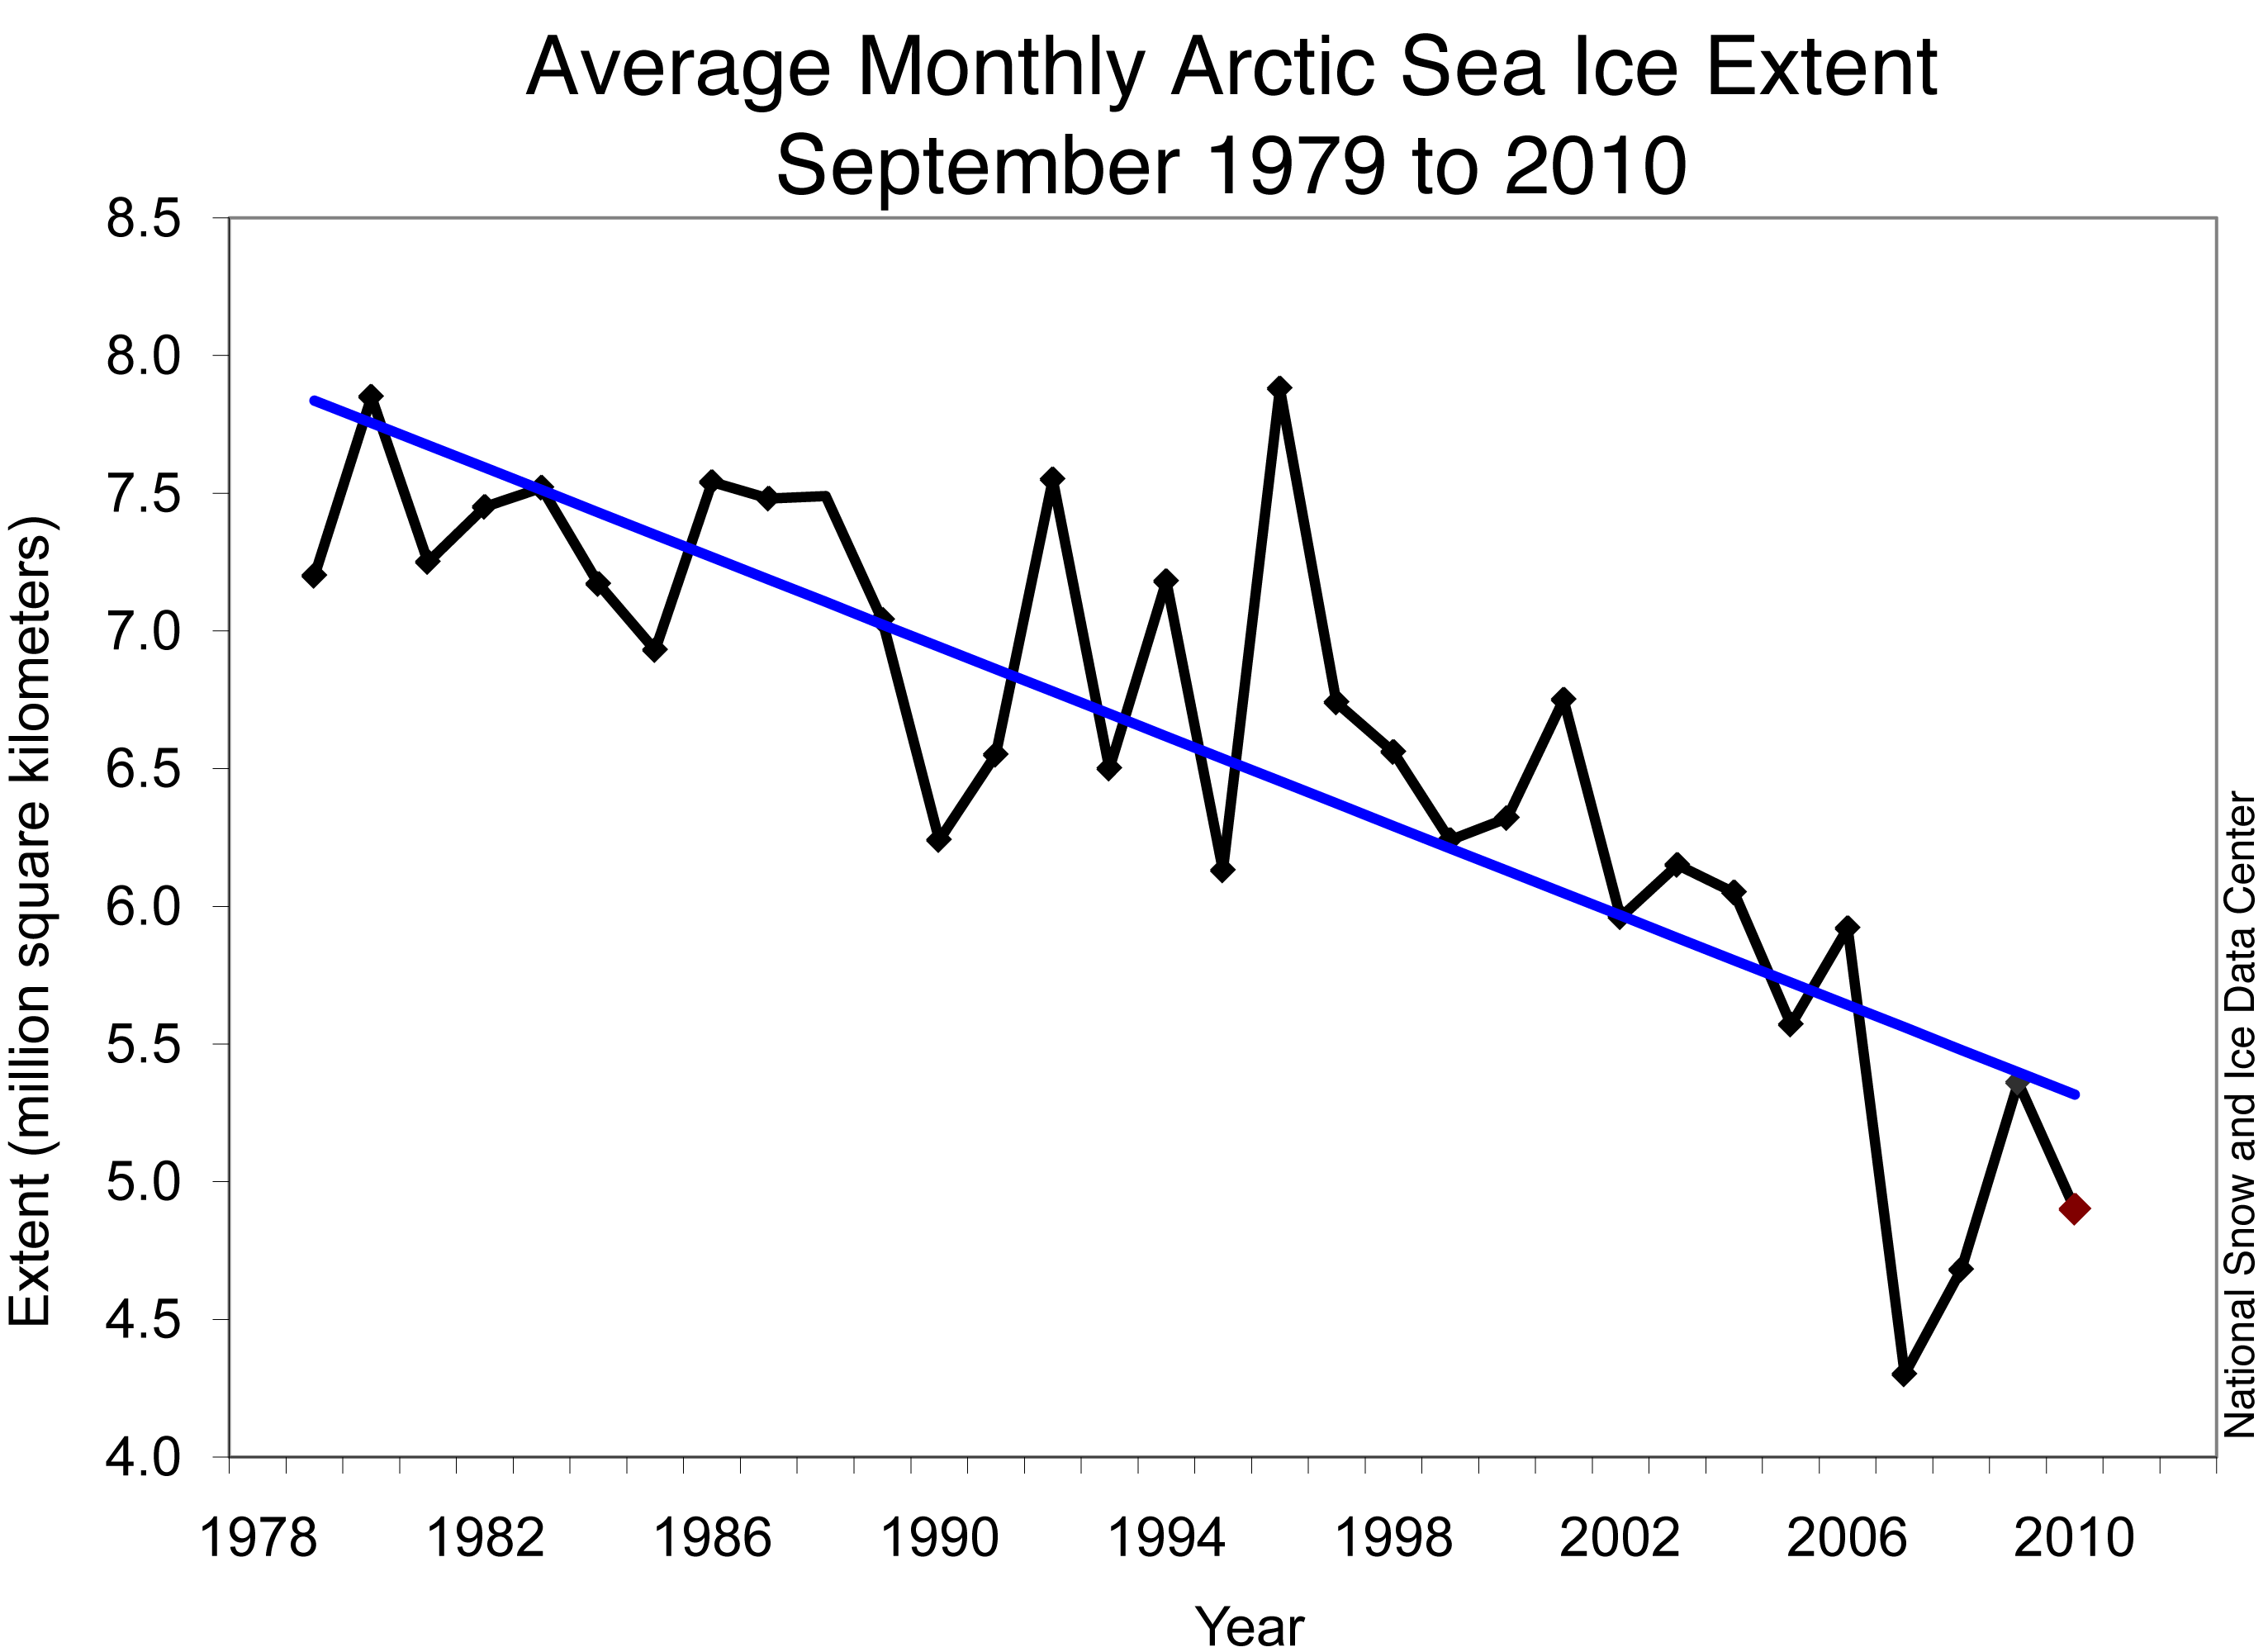
Look at the pictures yourself. They're almost identical measuring from a season to season basis.
The pictures I'm looking at show a HUGE difference in summer arctic sea ice for the last 5 years compared to the last 30. This year sea ice extent dropped to 4.33 million square kilometers. The median minimum since 1979 is appx 6.75. +- 2 std deviations is between 5.75 and 7.75.
4.33 is not even close to any reasonable definition of "very similar".
A scam people sometimes play with those photos is that they'll show one picture from a winter and compare that to another year's summer. So obviously the sea ice will be radically reduced in the summer. Take a couple photos from a given season in 1980 and compare them to a couple photos from the same season in 2010. They're very similar.
The only time sea ice extent looks similar is in the winter - that's because it's cold enough in the winter for most of the arctic to freeze over. But sea ice extent in the winter doesn't tell you anything about the volume of ice that is there.
Global warming has significantly thinned the arctic sea ice. Instead of thick multi-year ice that sticks around through summer, now you've got lots of thin ice that rapidly melts when the sun comes out in the spring and summer.
-
Re:The Alarmism misses a key detail
To counter that, I'd point out that most free floating sea ice is seasonal and reforms and melts throughout the year.
You do realize we're talking about ice shelves which have been around for thousands of years, and not sea ice extent, right?
To counter that, I'd point out that most free floating sea ice is seasonal and reforms and melts throughout the year.
The experts on the subject strongly disagree with you.
From The NSIDC - Arctic Sea Ice News & Analysis:
The last five years (2007 to 2011) have been the five lowest extents in the continuous satellite record, which extends back to 1979. While the record low year of 2007 was marked by a combination of weather conditions that favored ice loss (including clearer skies, favorable wind patterns, and warm temperatures), this year has shown more typical weather patterns but continued warmth over the Arctic. This supports the idea that the Arctic sea ice cover is continuing to thin. Models and remote sensing data also indicate this is the case.
-
Re:Doesn't matter what they report
And has been doing so for the past 12-14,000 years.
No it hasn't. You're probably referring to the last glacial cycle, but for all purposes that basically ended 8,000 years ago. After that, global temperatures have stabilized, or maybe even slightly decreased (until we started messing with it)
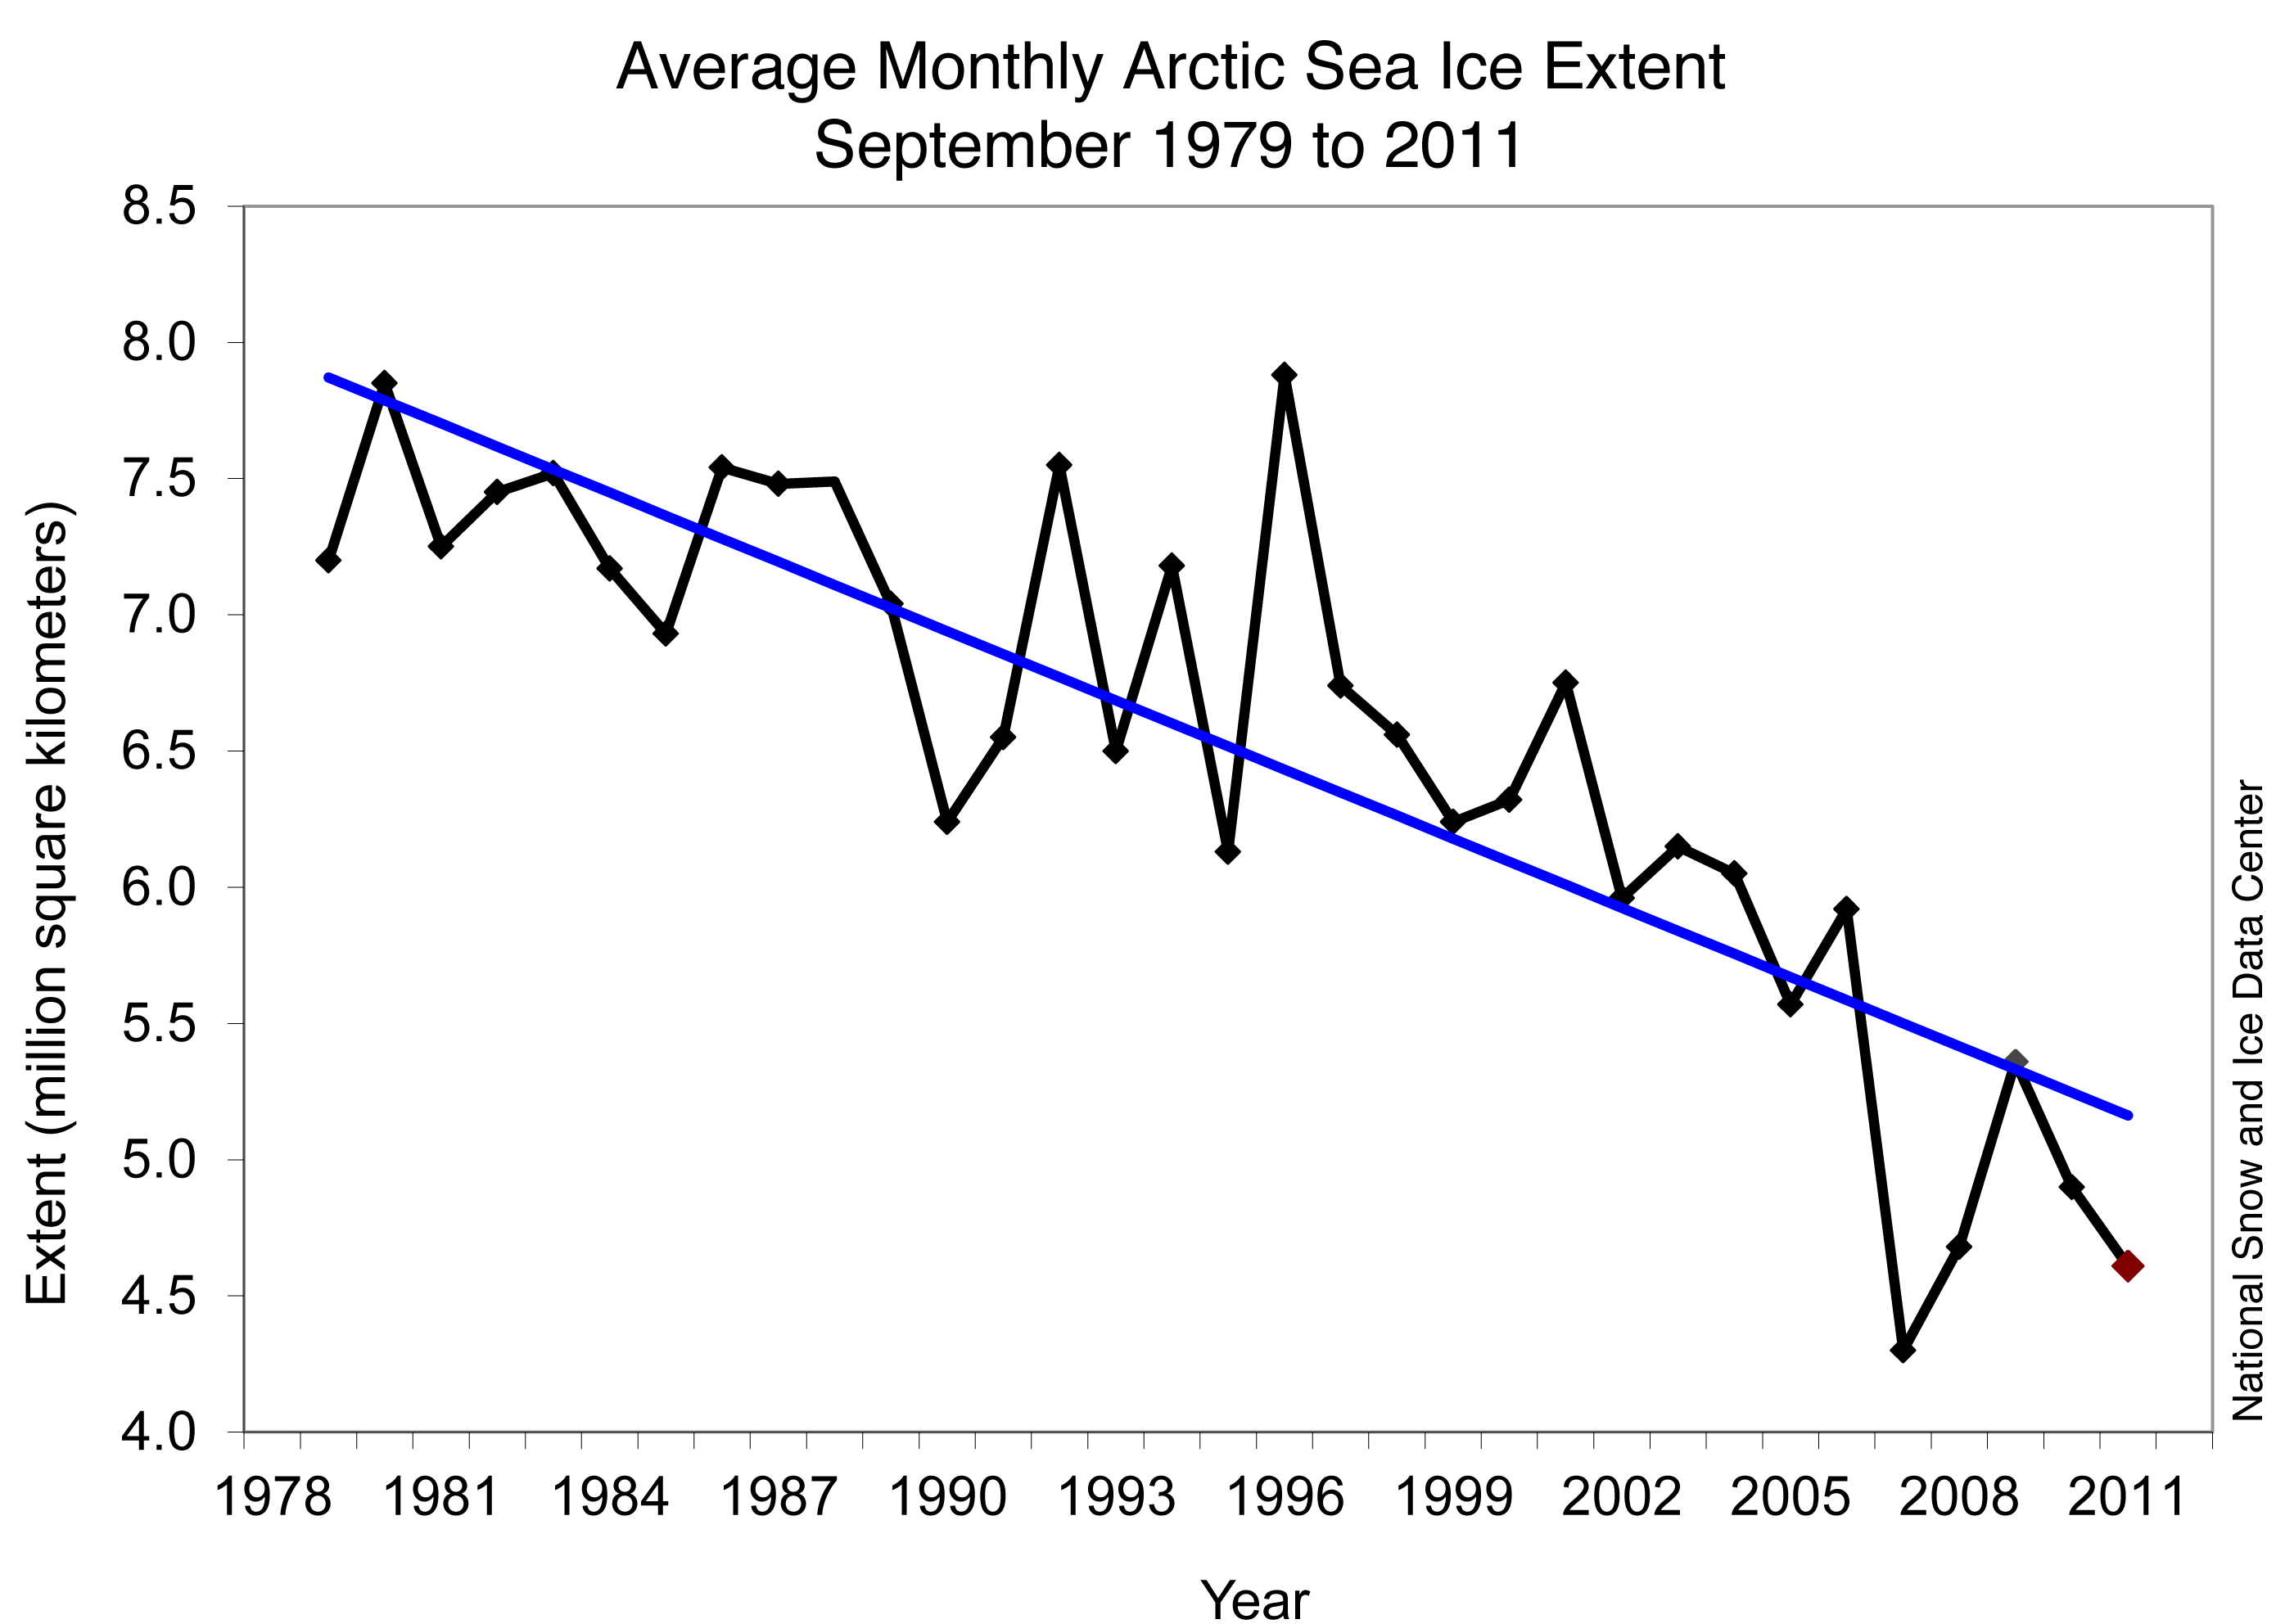
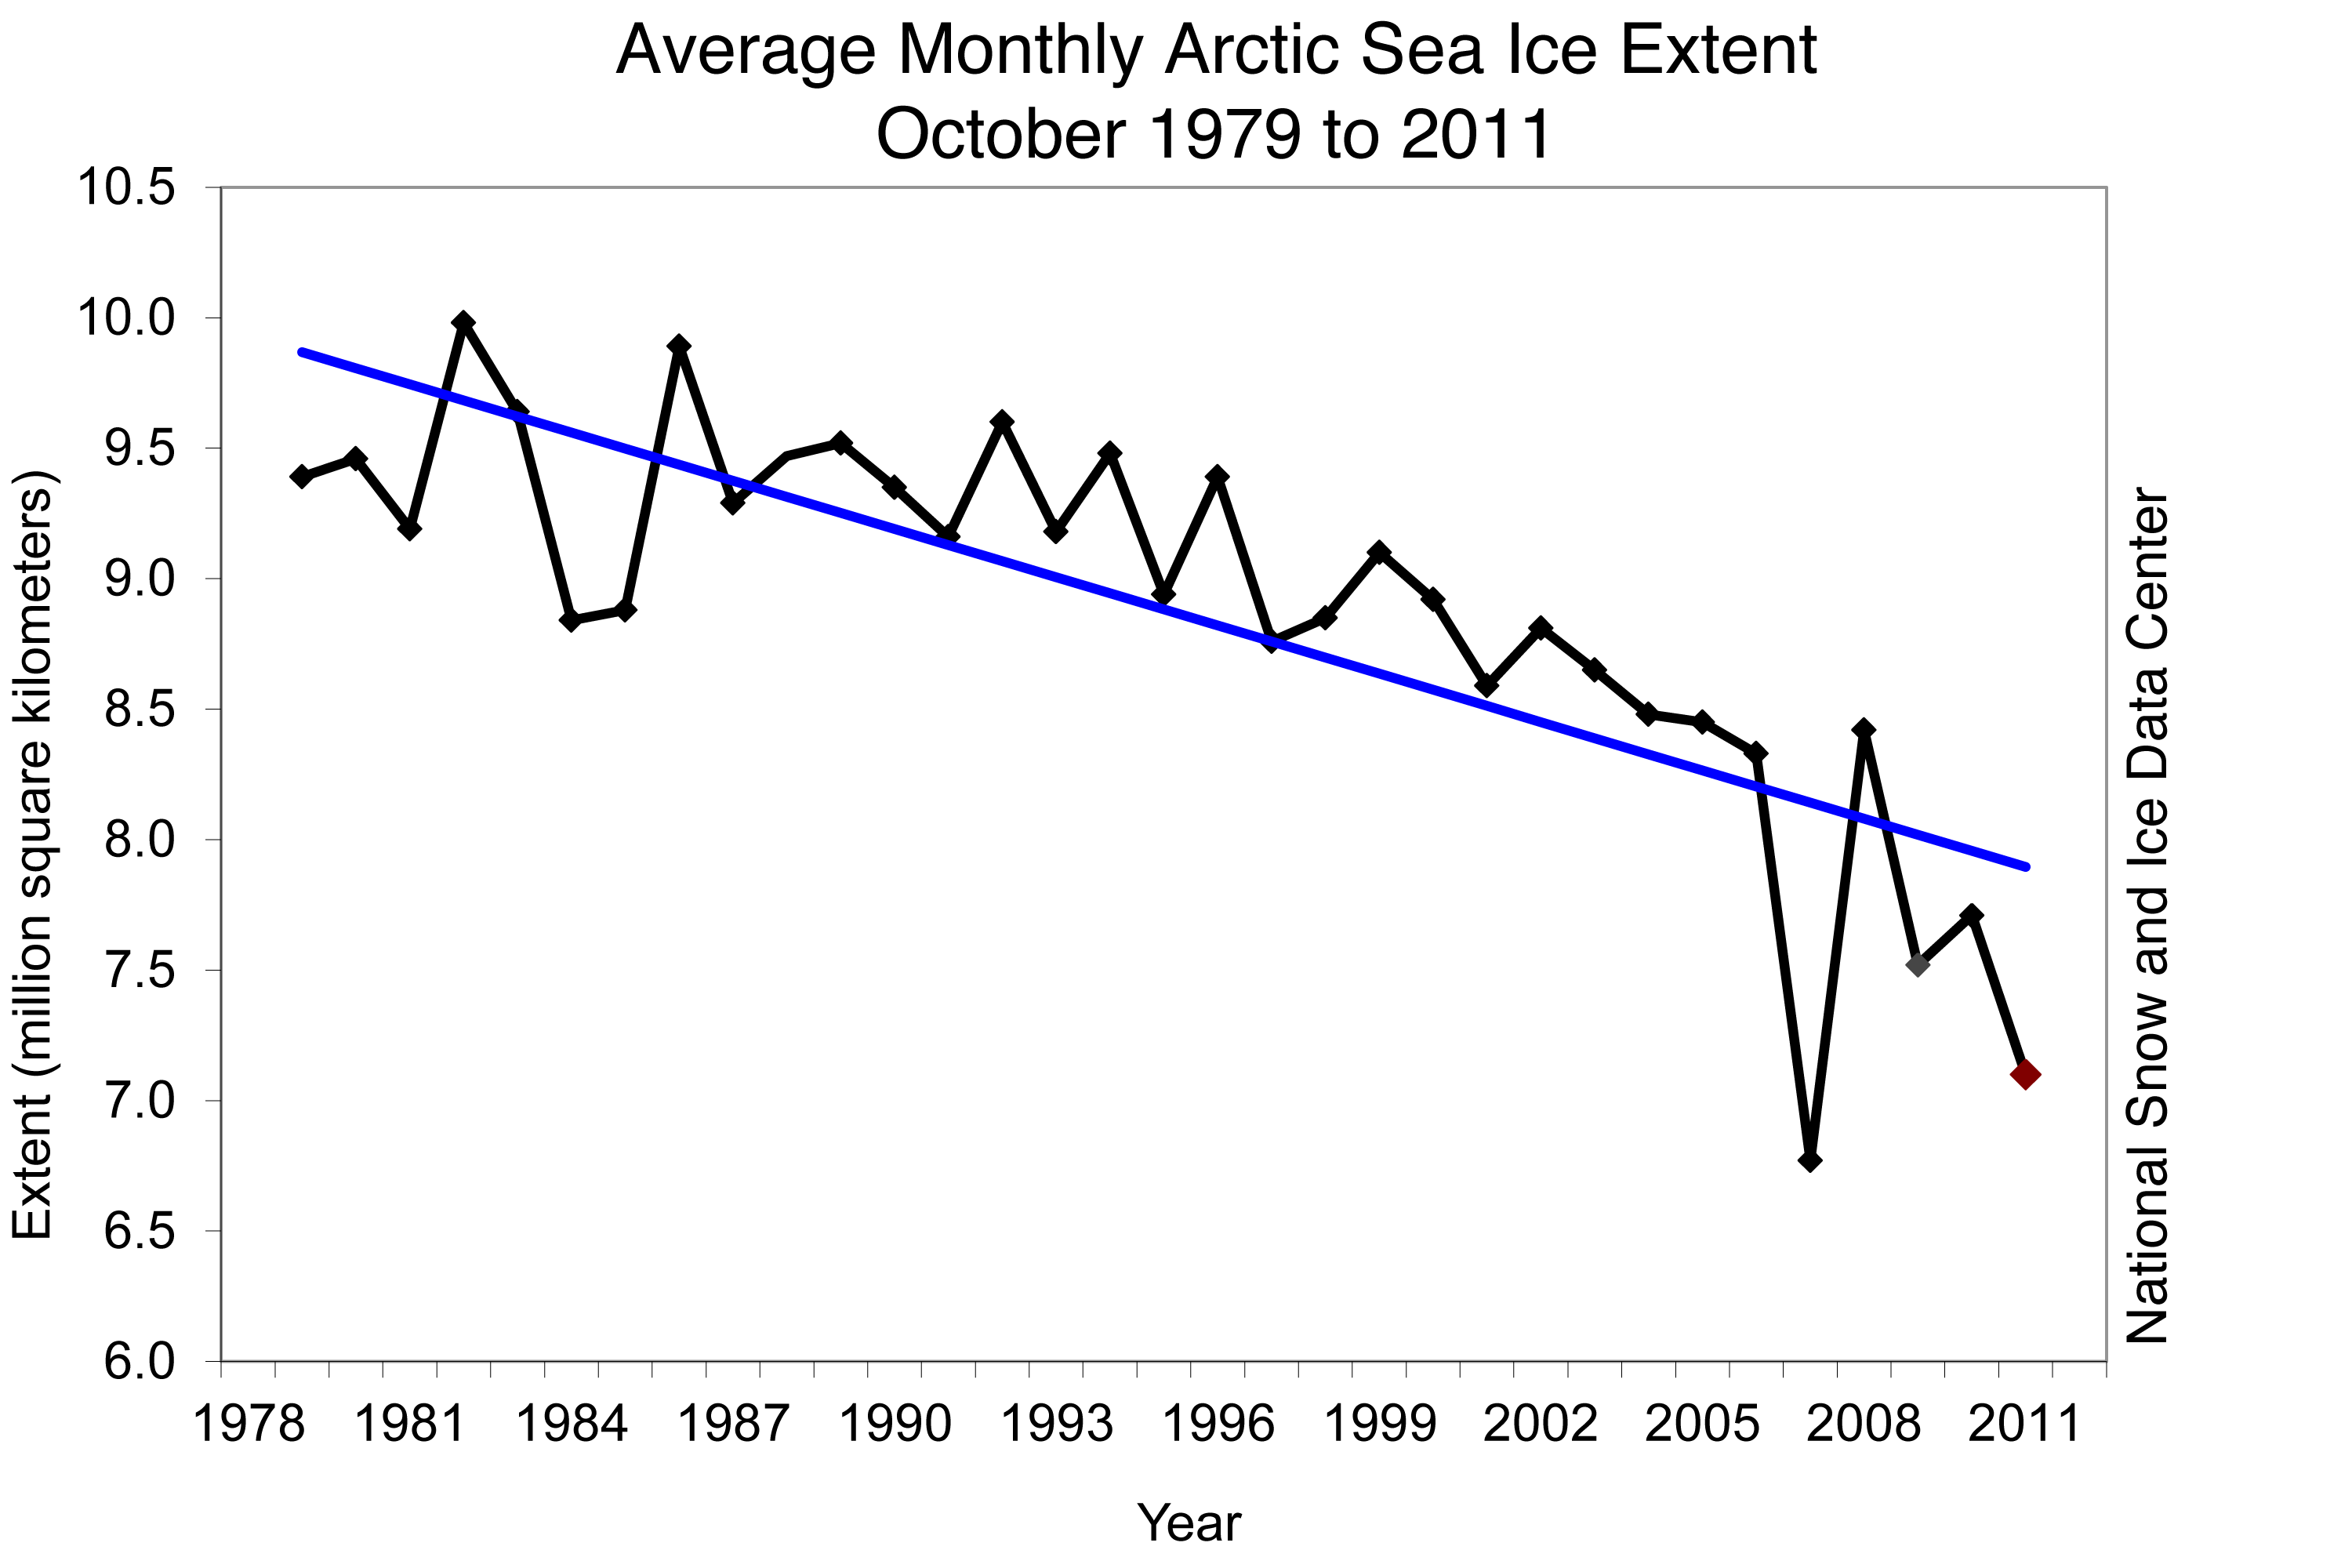
The current downward trend, as shown in the graph, started only a few decades ago:
http://nsidc.org/images/arcticseaicenews/20110803_Figure3.png
-
Re:The best source restricted
I'm looking, but I'm not alarmed: http://nsidc.org/data/seaice_index/images/daily_images/N_stddev_timeseries.png
how about 50 years ago? 75? oh, that's right, we have no way of knowing, do we?
br?
The temperature at the north pole has always been about 0 degree C each summer, knife edge of having or not having ice. -
Re:And many of the "climate" scientists...
I'm not going make a statement one way or the other on fudged data. If his actions were clearly inappropriate there are plenty of scientific bodies whose only reason for existence is managing scientific professional integrity. If he has done something truly inappropriate, he will be dealt with.
What I will respond to is THE VAST body of work pointing to dramatic changes in global climate. I ask those with an ideological position to defend, to stop for just a moment look at the remarkable amount of indisputable evidence that is now available. Its positively mind numbing.
Your comment about temperature is both uninformed and ludicrous. Scientists have taken wood samples from redwoods and bristlecone pines and with that information they can give you precise climatic information for specific areas including annual rainfall, temperature, and occurrence of catastrophic events. By analyzing human dwelling all over the world we can accurately determine climate through fauna and flora for those regions, spores, seeds and pollen. They tell us precisely what grew, and tell what the climatic conditions were there and when. We have antarctic ice cores with trapped atmospheric samples, we have ocean cores with samples of everything from diatoms to volcanic ash, we have fossils and minerals with trapped air and water going back millions of years, we have rock cores which elegantly give us clear records of temperature over centuries. The body of evidence is overwhelming and rich. Thousands of different sources from hundred of different fields of study, all forming a clear and cohesive picture. Whatever you've been reading, its inaccurate, incomplete, and puts ideology before simple fact and truth. You can absolutely criticize one or two individuals for their poor performance, but that doesn't even begin to indict the work of tens of thousands of scientist all over the world who work in vastly different fields but have all come to the same inescapable conclusion.
The models and theories make specific predictions. Many of those predictions have come to pass. Here are just a few recent facts which are completely incontestable:
- The ice caps are melting: If you haven't read about the disappearing artic ice cap in summer try this source. While some would applaud the economic benefit of opening a new shipping lane, the loss of extinction of many vital species including the loss of arctic krill would produce a devastating crash in global fish stocks and the probable extinction of a variety of whales, seals, penguins, and polar bears.
- Glaciers everywhere are vanishing: Look here for a synopsis. The impact of this is that nearly half the worlds population uses glacial melt for drinking water and for agriculture. When they melt the economic cost (not to mention the cost in human suffering or destabilized governments) will be profound.
- The oceans are changing: Rising sea levels, dropping salinity, increased acidity due to CO2, increasing temperature, and changing currents are all occurring as we speak, and all predictable results of global climate change. The impacts will grow and be devastating. Some include loss of coastal land and cities, weather changes, crash in vital fish populations, crash in all marine life, The ocean are the engine behind climate. Disturbing its integrity has far reaching impact. Already, low lying islands in Polynesia are disappearing and their inhabitants are being displaced.
- Animal are migrating away from the heat: Research is now showing us how climate change is impacting animal migration and we are only now beginning to under
-
Re:The data shows...
That's very nice, but it doesn't explain why the Arctic and Antarctic ice is melting. We have temperature observations in the ocean and from satellites also. They all show warming. It's nice to show some pictures of temperature stations in parking lots and pretend that they invalidate all temperature measurements because you find the warming to be inconvenient.
-
Re:Immediately followed by killer tornadoes
-
Re:Climate Change Deniers
A quick glance at a graph of worldwide temperatures assures me that there has been very significant warming over the past 15 years. Not to mention the melting of Arctic and Antarctic ice. So, yes, it seems just as simple as I say.
-
Re:Should we be happy that it didn't happen?
That also shows nothing about the global temperature trend. If you want to focus on small geographic areas, we can look at the trend in Arctic ice, which is clearly melting, and the trend in Antarctic ice, which is also clearly melting. You're showing only two cherry picked images from one specific location, not the overall trend in that location, and certainly not a global trend.
-
Re:Misrepresenting Anthony Watts...
-
Re:Satellite photos please. . ?
Want to learn more about Arctic sea ice, look here.
Ah! Now that site is more what I'm talking about.
And, I note, a comparison of the images doesn't exactly hold up to the AGW claims, do they?
Plug in data from the North and South poles for both the Summer and Winter across the full time spectrum from 1979 to 2010.
The ice seems to morph and breathe. I note that in the Summer in the North, there appears to be a greater degree of melt than in 1979, but that in the Winter today, the ice sheets are actually more extensive in some areas than they were back then. Overall, however, ice sheet in square kilometers is certainly less extensive today.
But on the South pole, and here's where it gets interesting, nothing much seems to have changed.
So, is there climate change? Obviously. That's not in question, but those changes behave oddly. Why would green house gasses only affect the North pole?
Now, there are other theories which fit the observations, are less sound-bite simplistic, which are not politically motivated, which are far more compelling to people who know how to read and think objectively, -and which don't have anything to do with pollution.
And anyway, I still wanted to see some photographs! Graphics are okay, but they're still just graphics.
Should some scientist take the time to patch together multiple photos (assuming they even exist) just for you?
These satellites are flying on public funds, and Yes, of course those photos exist. That's what those satellites DO. They were put in orbit for the express purpose of taking pictures. You make it sound as though organizing those pictures is somehow considered by scientists to be too much trouble. That's silly.
And there are some spectacular images available!
I'd just like to see them organized by date so that I can look at them. That's all. It's not like these satellites don't fly over the same land masses every day as a basic function of their existence.
To be fair, there are some efforts to provide this information, though it is still frustrating to go through, (and that particular collection only documents one year).
-FL
-
Re:Satellite photos please. . ?
Want to learn more about Arctic sea ice, look here. They don't actually use photographs much. To produce a photograph of the whole Arctic would require patching together multiple photos from multiple satellite passes. Instead they use things like microwave sensors to gather the data. Should some scientist take the time to patch together multiple photos (assuming they even exist) just for you?
If you want some comparison photographs of glacial retreat look here.
-
Re:Relax
Everything you just posted is completely normal for a negative AO.
http://nsidc.org/arcticmet/patterns/arctic_oscillation.html
AO history:
http://www.cpc.noaa.gov/products/precip/CWlink/daily_ao_index/month_ao_index.shtmlMaybe you're young enough to believe that mostly-positive is "normal"? That's only since the end of the 70s (see first link) - it seems we're going to back to the climate regime we had in the decades previous to that right now.
-
Re:A linear induction motor is not a railgun.
While you're freezing your ass off there was rain in Barrow, Alaska in mid November and temperatures in Western Greenland have been around 18 F higher than normal for this time of year. Arctic sea ice for November was the 2nd lowest on record after 2006 which preceded the record sea ice minimum of 2007. December isn't doing much better.
Regarding your comment "There hasn't been any statistically significant global warming for 15 years..." here is the exact transcript excerpt of what Phil Jones said that is the source of that denier meme:
BBC: Do you agree that from 1995 to the present there has been no statistically-significant global warming?
Phil Jones: Yes, but only just. I also calculated the trend for the period 1995 to 2009. This trend (0.12C per decade) is positive, but not significant at the 95% significance level. The positive trend is quite close to the significance level. Achieving statistical significance in scientific terms is much more likely for longer periods, and much less likely for shorter periods.
BBC: How confident are you that warming has taken place and that humans are mainly responsible?
Phil Jones: I'm 100% confident that the climate has warmed. As to the second question, I would go along with IPCC Chapter 9 - there's evidence that most of the warming since the 1950s is due to human activity.
The warming trend that Phil Jones calculated may not have reached the 95% confidence level of statistical significance (a somewhat arbitrary distinction) but it was over the 90% confidence level.
And 2010 may still set a new record for global temperature. It's sure to be in the top 3 years of the instrument record.
-
Re:Deniers...
Spoken like someone who gets all his science from "skeptic" blogs — hardly the mark of a true skeptic. (Citing WUWT is a dead giveaway. McIntyre at least knows some statistics, and Pielke Jr. at least knows some policy. Watts knows nothing. His blog is a mass of jumbled nonsense airing every contradictory skeptic theory — all contradicting each other — and shoddy amateur analysis on the web.)
No, Arctic sea ice is not growing. (Well, other than the obvious fact that it grows in the winter and is then lost in the summer.) The trend is strongly downward. Picking out some random day of the year and claiming that sea ice is growing is statistically moronic. (Even Watts sort of admits this in the post you link.)
Equally moronic is the idea that "climate change" was invented to avoid global warming being disproven. You are aware that the Republicans advocated changing terminology to "climate change" because it sounded less scary than "global warming"? As for the scientists, they use the term because there are changes in climate other than temperature which are equally, if not more important (such as changes in precipitation).
And yeah, farming Greenland where nobody lives will be really great.
-
Re:Great news!
Don't get too excited until you see AR5. The IPCC community knew at the time of AR4 that the ice loss estimates were frankly crap, since they didn't include any ice sheet dynamics and were just completely simplified estimates. I attended a meeting recently for the IPCC physical sciences working group on the cryosphere, and there has been major progress since the last AR, so much so that it is getting its own chapter in AR5. Unfortunately, by the time any piece of science makes it into the IPCC it is already a few years old. Fortunately, if you read some of the current research you will have a sneak-peak into what is likely going to be included in AR5. Go to http://nsidc.org/ and look at "Publications" if you are interested in a sampling of the latest research.
-
Re:Great news! (not)
>This year we are going to see a new record low for arctic sea ice --- surpassing even the dramatic 2007 decline. http://arctic.atmos.uiuc.edu/cryosphere/IMAGES/seaice.recent.arctic.png
Another source, the Arctic News, differs with your conclusion. See link here: http://nsidc.org/data/seaice_index/images/daily_images/N_stddev_timeseries.png and the main site at http://nsidc.org/arcticseaicenews/
It is still bad. This year will be the runner-up, not the new record low for arctic sea ice. Perhaps, as before, the moisture in the arctic air will swirl down and result in a good snow year for the northeast US ski areas. -
Re:Clearly a sign of AGW
I guess that this must be a sign the AGW is over then?
-
Re:Clearly a sign of AGW
Sure, 2007 may have been unusual with arctic ice cover well below the trend line (which can be seen halfway down this page). This is hardly evidence of a reversal of the trend. GP is correct in describing the continuing decline in arctic ice cover as "unprecedented".
-
Re:Clearly a sign of AGW
Right, because global warming predicts that all weather will cease to exist, right?
Seriously, what sort of idiot thinks that there will be no randomness from year to year? Climate is about *averages*. And the trends are clear.
-
Re:Great
Are we talking about the same Artic ice here. It's quite understandable that ice melts at summer. There's anything special about this year.
Meanwhile in Antarctic. At the end of June, Southern Hemisphere mid-winter, the sea ice surrounding Antarctica was more than two standard deviations greater than normal.
-
Re:Great
Think of insulation. Insulation can keep heat in, and it can also keep heat out. Insulation will keep your house warm in the winter, and also cool in the summer. It's not that hard to understand, is it?
Although CO2 may be causing cooling high in the troposphere, it's keeping the surface of the Earth warm. So far, 2010 is the warmest year on record, with Arctic and Antarctic ice continuing to melt, despite low solar activity.
-
Re:Lack of Falsifiability
If global temperatures went down significantly over a period of many years, it would certainly be fantastic evidence against anthropogenic global warming. But the fact is that past decade is the warmest on record. Ice in the Arctic, the Antarctic, and Greenland has been melting as a result of this warming.
-
oh the cheek
how dare the plebeians question the science of the people who lost an ice sheet bigger than california.
-
Re: Politicizing science?
On the other hand, the speed of melting has been unprecedented, and it was predicted before it occurred, because increasing greenhouse gasses were predicted to increase temperatures. The melting is also continuing at an accelerating rate, for example, in the Antarctic and Greenland. You may be referring to the Arctic sea ice extent increasing, but the volume is decreasing because the ice is getting thinner. Besides, some years the Arctic sea ice extent will increase due to natural variations. The long-term trend is that the area of Arctic ice is also decreasing.