 Slashdot Mirror
Domain: ucar.edu
Stories and comments across the archive that link to ucar.edu.
Comments · 361
-
That's a snowfield, not a glacier.
Snow usually is melting during spring and early summe
Again, you really need to visit the mountains. Again, you really need to realize that rivers all over the world are fed year-round by snow melt, just as they are in the U.S.
Snow remaining through the winter is not often a glacier, usually it is a snowfield. If a snowfield grows long enough it may eventually (say a thousand years+) become a glacier. In the meantime, again I say to you - go into the rockies in the summer, any time, you will see snow on the high peaks. I have hiked many 14k peaks and all of them have snow at the top at any time of year... partly because even rain will often fall around tall peaks as snow. Partly because it's simply a lot colder up there and even in summer temperatures are not all that high.
-
Storms
Also, Northern Virginia and Long Island are nearly 300 miles apart. They are not both going to be hit by one storm.
Not true. Hurricanes are routinely wide enough to hit both locations at the same time. Average diameter of a hurricane is around 300 miles. And it would be quite possible for a storm to hit DC and then move north to NYC.
-
Re:Shit.
They're probably closer to the truth than whatever you're thinking.
For the record: A storm surge is primarily caused by the relationship between the winds and the ocean’s surface.
There is another source that basically says the same thing. To wit: As winds swirl around a hurricane or tropical storm, seawater is pushed into a mound at the storm’s center. Faster wind is able to pile up more water.
Also, per UCAR, about 5% of the storm surge is due to low pressure within the hurricane; the majority of the effect is from wind.
-
Re: Cannot be climate change
Research can't show us what the proper climate should be.
Actually it can. The problem is funding, time, and the tools needed to do it. All of which can be rectified if desired.
Research cannot even predict next day's weather.
It gets pretty damn close for most places. The issue once again is the same as it was for your last statement. It's not down to the second accuracy yet, but it can be.
Earth is a sandbox. Everything will always be in balance.
AHAHAHAHAHAHA! Oh, you're serious? That's.... misguided at best. Go look at Chernobyl, that's hardly in balance. See also the massive hole in the ozone layer we made with Chlorofluorocarbons. Or the massive amount of gas and oil leaking out into the oceans as sunken ships rust away, killing and destroying the local ecosystem there. Or the acid rains created by heavy industrial pollutants. Humans very much affect their environments in ways that are harmful. Not only to the environment itself, but also us. Not being mindful of that especially over large time scales, is a good way to set ourselves up for failure in the future.
Even if it will become 2 times hotter, the planet will cool down again, eventually and dinosaurs might come back again.
The average earth temperature at that point would be 118.0 Fahrenheit (47.7778 Celsius) For the record, you'll probably die around 111.2 Fahrenheit (44 Celsius). That would make going outside at all a fatal event. Never mind the cost to cool off an indoor location to a safe level. Or the extinction of entire ecosystems that would be caused by it. That's not a concept to just brush off casually as unimportant.
The concern of many is whether we kill ourselves faster or not.
Which is why you and others should pay more attention. You might learn something from that research that can help all of us.
-
Re: A 'tablet' is actually a 'tablet computer'.
A computer is a device that can be instructed to carry out arbitrary sequences of arithmetic or logical operations automatically.
You fail CS100. A computer is a device that has input, output, storage, and processing. An iPad is a computer.
The iPad is not a computer because it is very restricted/limited (apps are restricted to the walled garden of Apple's App Store for example).
So the supercomputers being run by NCAR are not computers because you cannot program them yourself? In case you missed the announcements, Apple runs a Developer Program which allows people who pay the money to program apps for iOS and MacOS. Once you get the license and keys, you can write your own programs to do whatever you want. I've done it, and I find Xcode to be a very nice development platform.
If you don't want to pay for the developer license, you can still use Forth ($0.99), or Python ($9.99), as just two examples of programming languages that run on iOS/iPad. I am sure there are others, but those two are the first two I found.
You can feel free to disagree that iPads are computers, but you are so obviously wrong that you might think about not saying it in public again.
-
Re: Oh, this is going to be great
Read this:
http://clivebest.com/blog/?p=1...
It gave me a fairly good understanding of how the IR absorption with CO2. Some parts of it is speculation, but the basic science of how it works looks to be sound if compared with:
https://scied.ucar.edu/carbon-...
https://www.skepticalscience.c...(With the above, please use more than one source for your data.. Look for multiple sources before just accepting and single one as fact)
It's more complex than testing it in a lab... More studies are needed and that requires us to throw some cash at it... Screaming "climate change denier" does nothing except causes us to ignore valid data, and that may cause us to throw a lot more $$ on the issue that we would need to.
Not saying we are not causing it... i'm saying "we don't know" and we need more research into the issue..
We may need to act like we are the cause before knowing for sure we are the cause to prevent it from getting worse. If it turns out we are not the cause it may have cost us a big of $$ but if it turns out we are the cause without acting it may wipe out a large chunk of earth's population.
-
How to graph models
I see claims for this on both sides of the argument. Where can I find temperature data output from a model in the past in comparison to actual temperature data as recorded since that model was run?
I've been graphing it myself. What you need is the climate sensitivity out of the model-- this will be in units of degrees C per doubling. The prediction is that the delta-T equals the sensitivity times the Log_(base2) of the carbon dioxide currently divided by the carbon dioxide at the reference year. You can find carbon dioxide levels in the Mauna Loa dataset, here: http://www.esrl.noaa.gov/gmd/c... and you can find temperatures in whichever source you like, such as Berkeley Earth Surface Temperature (BEST), or the NASA GISS data. This site has list of different sources of data, with a link to the BEST: https://climatedataguide.ucar....
The older the prediction, the longer a run of years you can compare predictions to reality, of course. The 1979 National Academy of Sciences report "Carbon Dioxide and Climate: A Scientific Assessment" is a good place one; it has error bars on the prediction: 3 C, plus or minus 1.5 C (per doubling): https://www.nap.edu/catalog/12... The prediction hasn't actually changed much since then though, so that's a good one to pick in that it's representative of pretty much all the later models
-
Re:This is what happens when you have
let me help. rate of sea level rise increasing. tinyurl.com/gqx9hgy [Peter Sinclair]
Nerem et al. 2011 [Lonny Eachus, 2016-02-10]
Why did Lonny Eachus link to a graph showing a 3.1 mm/year global sea level trend? Since that's higher than Lonny's claimed "1.1 mm/year", doesn't that simple comparison show the rate of sea level rise is increasing (i.e. accelerating) over the long term? And since Lonny's accused scientists of being "liars" if they acknowledge the global sea level rise of ~3 mm/year, why did Lonny cite a graph containing what he called a lie from a scientist he's previously called a "liar"?
Furthermore, that's not a peer-reviewed paper. It's a slide from a 2011 presentation which hasn't been turned into a peer-reviewed paper. A real skeptic might wonder why it hasn't. Hint: in 2011 Jane/Lonny briefly stopped denying satellite measurements of sea level because they showed a short term drop. Of course, scientists told Jane that this was because the 2011 La Nina caused such massive flooding that global sea level fell temporarily. See Boening et al. 2012 (PDF).
So is it really surprising that calculating sea level acceleration from 1993-2011 gave an unrepresentative answer? Especially because that's a short timespan, and detecting acceleration requires a longer timespan than just detecting a trend. Maybe we could learn why that 2011 presentation hasn't become a peer-reviewed paper by looking at that same data up to 2016.
Let's analyze that raw data (backup) from sealevel.colorado.edu (backup). Here are accelerations and uncertainties for timespans that all end at 2016.1 but start at 1993, 1994, etc. Notice the similarities between the satellite acceleration graph and the older global tide gauge acceleration graph I've shown Jane/Lonny. All the black best-fit accelerations are positive. More recent accelerations tend to be larger. (The most recent accelerations and even their red lower 95% confidence intervals are off the scale even though the upper vertical limit is twice as high as in the older graph.) This tends to suggest that not only is global sea level accelerating, it's even "jerking" up.
(Technical note: those 95% confidence intervals were calculated using a ARMA(1,1) noise model. I also tested AR(1), MA(1), ARMA(1,2), and ARMA(2,1), but ARMA(1,1) minimized both the AIC and BIC.)
let me help. rate of sea level rise increasing.
-
Re:Puhleeze
Stop peddling your bullshit anon:
They can't explain the mechanism
Bullshit: http://scied.ucar.edu/carbon-d...
nor can they explain why Earth was so much colder during times when CO2 concentration was 10 times what it is today.
Bullshit: https://www.skepticalscience.c...
They talk out of both sides of their mouths and are bullshitting for money, lots and lots of taxpayer money. Why do they need taxpayer money?
Bullshit: Fossil fuels recieve considerably more taxpayer money than renewables, and they only reason climate science needs funding is that fossil fuel interests insist on continuously pushing back on scientists recommendations.
You think there would need to be reports like this if, in the 70s, governments had simply agreed that yes, they do need to reduce and stabilise CO2 production? The only reason climate scientists continually need to prove themselves is because of big oil shills and IDIOTS LIKE YOU who are drinking their koolaid.
I mean hell you're not even honest enough to use your account.
-
Re:Polar ice caps melting faster than expected
Go ahead. Doesn't change the fact that the minimum ice cover has roughly halved since the late 1970s. The reality of global climate change doesn't stand or fall based on comparison to whatever Al Gore said.
The ice is indeed going faster than the median of the models predicted for the 2007 IPCC (e.g., see here for article in 2007). Look at that chart. There's more recent data. 2012 was the lowest September ice extent at only ~3.4 million km^2, so it's still well ahead of the trend predicted in 2007. It's irrelevant that this still isn't as bad as the worst case possibility that Gore quoted. He said it *could* be as bad as that. That was possible. Unsurprisingly the worst-case scenario didn't happen. But we are significantly worse than the IPCC 2007 predictions. We're decades ahead of those predictions for sea ice at the north pole.
-
Re:Fuck the rest of the world.
The 200 million Africans of 1950 will shoot up to 2bn in around 30 years. Asia and now Africa dwarf Europe and the US. We here have irresponsibly high per-capita carbon footprints; Asia and Africa have irresponsibly high population growth. The latter is the way bigger problem because economic growth is on course in Asia, consequently their carbon footprint per capita converges, i.e. their overall carbon growth is quadratic. In Africa, if their level of procreation, and other factors don't lead to productivity, prosperity and thus more carbon intensive living, then there's gonna be hell and Africans will swarm the rest of the Earth, especially developed parts which are characterized with high per capita carbon use.
European population size is actually decreasing. I wouldn't worry about Europe and US because plain technological advance, electric cars and the ever growing popularity of eco-oriented thinking etc. ensure that these economies are decarbonized. However there's little regulation and enforcement in Asia, South America and Africa. Worry about these.
-
Re:Predictions, so far, have been accurateThanks for actually quoting real data! Nice to see a discussion based on the actual science.
Go to IPCC 5th Assessment report, chapter 9, page 28, graph (a) Observed and CHIMP5 Simulated Global Mean Surface Air Temperature, you'll see that there is at least a
I have problems excepting a 30% errors as predictive value
Wow, first I have to say, your catachresis is absolutely brilliant. "I can't accept the error, because it would except the error."
The quoted error bars on the climate prediction are plus or minus 50 percent. So, you are just saying that the quoted error bars mimic the difference in models.
Yep. The graph you refer to compares the results of 40 cases from 23 different models. The overall trend is clear-- up-- but different models vary on how much.
When people agree with the science of global warming, that is not excepted: the error bars are part of the science.
-
Re:Predictions, so far, have been accurate
Go to IPCC 5th Assessment report, chapter 9, page 28, graph (a) Observed and CHIMP5 Simulated Global Mean Surface Air Temperature, you'll see that there is at least a
I have problems excepting a 30% errors as predictive value
-
Re:James Hanson
There is the NASA/GISS ModelE, one of the leading GCMs that the IPCC reports are based on. You can download the source code (in FORTRAN I think), the documentation and other information at the link.
As far as altered data, there is very little "data" input in to climate models. The major ones like ModelE are physical models and in theory you could start them anywhere and they would evolve to a realistic climate rather quickly. As far as what's input into climate models they are obviously given a starting point. Then if you want to look at how changes in greenhouse gases affect the climate you would input various scenarios of changes in those gases over time (in the IPCC AR5 they are called RCPs or Representative Concentration Pathways). Some things in climate occur on a scale that's too small for grid sizes* that are practical so they can't be calculated in the model and they have to be parameterized. Clouds are an example of this. You could input a simulation of solar variation I suppose but it's varies so little and averages out over the longer time periods that models model that it's not necessary. Things like temperature, humidity, precipitation and wind are not input into the models but are emergent properties of them.
* Grid sizes are determined by how much computing power you have and how long you want a particular run to be. Here's a page that discusses resolution (both spatial and temporal) of climate models and how it's changed over time as more computing power was brought to bear.
-
Re:Nonsensical Title
There are several different ways of measuring it, but they all are trending upward.
-
Re:How to end all arguments
Easy. See here https://www2.ucar.edu/news/how...
Laughable. The techniques, methods, and protocols as well as the areas covered have all changed vastly over the 100 years. The amount of "normalization", "tuning", "calibration" and "adjustment" gone into it was immense — all perfectly justifiable. Or almost all. For the 0.6F rise it would've been enough — for an overzealous individual (or group) — to skew the "calibration" just a tiny bit.
0.6F — what, I wonder, is the observational error of even today's measuring devices?
So now that the question of successful predictions is settled
What? You are yet to provide the "list of pairs of links: one link in each pair leading to a prediction, the other — to its confirmation a 3 or 50 years later..." You've given me a chart claiming to show half-a-degree rise — did anyone predict it in 1880? What model did they use back then — and how does that model explain temperatures going down in the first half of the chart? Why have they stopped growing at the end of period covered?
surely a confirmed prediction is enough to convince you
One would not be enough — not to validate a scientific theory. Recall, how I am always asking for a list of prediction-confirmation pairs. Certainly, the list ought to have more than one element. Even more than 3... And we are yet to see even 1.
-
Re:How to end all arguments
Easy. See here: https://www2.ucar.edu/news/how...
So now that the question of successful predictions is settled, are you going to start campaigning for clean energy? Since you're such a believer in science then surely a confirmed prediction is enough to convince you? -
Check your sources [Re:Water vapor]
Sorry, but here's an important lesson for you. Memorize this simple rule:
Never get your science information from the opinion/editorial pages of Forbes magazine.Forbes is a business magazine. It's not a science magazine. It doesn't even pretend to be a science magazine. It's a bad source for science information, because they are editorializing to make a point, not to understand how climate works.
Track down original sources. Don't rely on editorials in Forbes.
Since you get your data from business magazines and blogs, here's a blog post you might look at: http://variable-variability.bl... But, let's look at that Forbes link. The particular editorial you linked has two links... one to a graph with no source listed, and the second to a long paper... with no information on where this paper was published (or if it was) or who it was reviewed by. But-- paydirt!-- that paper does list where the data comes from: the NASA Water Vapor Project. So let's look at the data from the source.Here's the data: https://eosweb.larc.nasa.gov/p...
here's the data graphed: https://climatedataguide.ucar....
here's the data analyzed: https://www.cira.colostate.edu...
here's the conclusion of the analysis: "at this point we are unable to prove or disprove a robust global trend in total precipatible water."So the answer is... inconclusive.
-
Re:Open source weather
Open source weather prediction involves obtaining the data and running a numerical model.
There are a lot of acronyms for weather models in the comments such as the HWRF, HRRR, RAP, and NAM. All of the those models are actually various configurations of the Weather Research & Forecasting (WRF) model. Other models like the GFS, UkMet, and ECMWF are different and aren't based on the WRF. You can download WRF and compile it yourself. It's actually not that hard. The site is http://www2.mmm.ucar.edu/wrf/users/. WRF is in the public domain and so are the tools that you're most likely to need in order to run WRF.
WRF isn't usually a global model, so you'll need something to provide the initial and lateral boundary conditions for the model. That's usually data from another model. The data from the HRRR, HWRF, RAP, NAM, and GFS are all also in the public domain. The appropriate choice here depends on what you're planning to do with the model, but there's no shortage of public domain data.
The real limiting factor is the availability of computing resources. Current numerical models in their typical configurations can require hundreds of cores to run and each core needs several GB of RAM. High-quality numerical modeling is computationally expensive, which limits who is practically able to do this. But licensing, availability of software, and access to data aren't issues at all.
-
Re:Actually there is a 34% CHANCE...
You are correct that the temperature observations in the four datasets are not all statistically independent. There are a finite number of weather observation stations in the world, so of course there will be overlap in the raw data used to generate the datasets. That's why I described them as "methodologically independent datasets, all derived from raw temperature data from land and ocean surface temperature observations." The State of the Climate report uses similar language. In other words, they might share input data, but the methods used to generate the final datasets (e.g., how to perform data quality control, how to interpolate missing data, etc.) are independent. That was all I meant. So yes, you are correct that the data themselves are not all independent. The semantics are messy and annoying, so I am sorry if what I meant wasn't clear.
ALL the datasets they use in this study are directly controlled by the NOAA. They are each adjusted and calibrated... by the NOAA...
But that's objectively not true. Look at the methods used to generate the datasets. Yes, all four datasets use GHCN, but some of them use other data sources in addition to GHCN, and they don't all use ERSST. They take very different approaches to deciding which stations to include, how to correct for missing data, and so on. So yes, there is overlap in source data, which is probably inevitable if you are trying to compile a global dataset, but the final products certainly do not "come from the NOAA" or even rely exclusively on NOAA data. (Caveat: This is based on my non-expert readings of dataset summaries and descriptions.)
Look, I definitely see your point about the datasets not being statistically independent. That is absolutely correct. But claiming that they are all "directly controlled by the NOAA" and "adjusted and calibrated by the NOAA" comes across as disingenuous. It's probably best just to say that they're not statistically independent and leave it at that.
my bias corrects from 35 to 30. The figures based on the math alone were showing something around 35 to 38 percent. But given that we've had corrections to the models and the figures going on for years and they always correct them DOWN... I personally decide to read the numbers as being slightly lower than cited if only in anticipation of the next correction.
Whatever works for you, I guess, but applying an arbitrary 5% downward adjustment because your gut tells you the numbers might be biased is not very defensible. Unless you have actual evidence that the station readings are biased upwards, or that the datasets are fudging the anomalies upwards, you really have no idea whether a correction is needed, let alone how large of a correction to apply. You could be right -- I don't know, and neither do you. Arbitrarily changing the study results because of a hunch is sketchy, at best. Consider the opposite: Some have argued that the JMA dataset underestimates the true extent of climate warming, but I doubt you'd accept an arbitrary 5% upward correction as a result, and neither would I.
Regardless, I suspect we can both agree that, in the end, the precise probability that 2014 was actually the warmest year isn't all that important. The general trend probably matters more, and no one is disputing that 2014 was one of the hottest five or ten years on record.
Anyway, thanks for the interesting (and civil) discussion.
-
Relevant scientific links at NCAR
The National Center for Atmospheric Research in Boulder, CO has this to say about a new Maunder Minimum: https://www.google.com/url?q=h... or, for the more scientifically literate: http://opensky.library.ucar.ed... The original hype would, therefore, appear to be pseudo-science.
-
Re: Difference between Warmists and Rapturists
Those claims would be more interesting if some references were provided. For example, I seem to remember some people who are often referred to as statisticians (actually a minerals prospector and an economist) doing something similar, but it turns out instead of "proving" that the hockey stick wasn't real, they proved that they couldn't follow the documented procedures.
McIntyre & McKitrick aren't statisticians at all, so no argument there. Science shouldn't be about credentials, but if it is...
McShane and Wyner ARE statisticians and they published this paper in The Annals of Applied Statistics regarding Mann's statistic uasge for proxy reconstruction methods. The abstract follows, mostly because it pretty much speaks for itself:
Predicting historic temperatures based on tree rings, ice cores, and other natural proxies is a difficult endeavor. The relationship between proxies and temperature is weak and the number of proxies is far larger than the number of target data points. Furthermore, the data contain complex spatial and temporal dependence structures which are not easily captured with simple models.In this paper, we assess the reliability of such reconstructions and their statistical significance against various null models. We find that the proxies do not predict temperature significantly better than random series generated independently of temperature. Furthermore, various model specifications that perform similarly at predicting temperature produce extremely different historical backcasts. Finally, the proxies seem unable to forecast the high levels of and sharp run-up in temperature in the 1990s either in-sample or from contiguous holdout blocks, thus casting doubt on their ability to predict such phenomena if in fact they occurred several hundred years ago.
We propose our own reconstruction of Northern Hemisphere average annual land temperature over the last millennium, assess its reliability, and compare it to those from the climate science literature. Our model provides a similar reconstruction but has much wider standard errors, reflecting the weak signal and large uncertainty encountered in this setting.
Mann et al. of course filed a rebuttal, which more or less amounts to declaring that statisticians know nothing about handling climate data, and furthermore that McShane and Wyner used completely inappropriate statistical methods.
I've read the rebuttals and McShane and crew seem to be the most on the ball in the exchange from my reading, with Mann et al's arguments seeming to be tangential to the central meat of the article and concerns identified, but go read it yourself.
-
Re: Difference between Warmists and Rapturists
Those claims would be more interesting if some references were provided. For example, I seem to remember some people who are often referred to as statisticians (actually a minerals prospector and an economist) doing something similar, but it turns out instead of "proving" that the hockey stick wasn't real, they proved that they couldn't follow the documented procedures.
-
Re:-dafuq, Slashdot?
You go to the article, and of all the links they have, only *two* point to anything that comes even close to scientific
It would be nice if they provided sources, but there is nothing really controversial in the article. The article from 2007 noted that arctic sea ice was diminishing faster than any models had predicted. That has not changed since 2007: http://www.arctic.noaa.gov/rep... .
-
-dafuq, Slashdot?
I'm usually not one to ad hominem by source, but seriously... slate.com? The whole site is a political screed. But, it gets worse...
You go to the article, and of all the links they have, only *two* point to anything that comes even close to scientific -or- academic.
The one academic link points to a summary on UCAR, from 2007(!?), that contains exactly one pretty chart, but *no data* to back it up (or even a link to said data.) If someone finds a link to hard data in any of this mess, please let me know. Meanwhile, it should be noted that one of UCAR's missions is literally "Engaging in effective advocacy."
The one scientific link, to a NASA project site, tells the actual story. the TL;DR is that most of what they saw was routine, but two small areas got their attention... and they didn't measure those areas with anything useful, but instead literally used:
These images were not produced with the lasers, radar, and other instruments flying on the aircraft. (Check out the mission page for content like that.) Rather, IceBridge scientist John Sonntag captured these scenes with a handheld digital camera while looking out the aircraft window.
If you're going to link to something as backup for a story, how about you make it an article that contains some fact, and not an alarmist screed which supports its premise with a series of blind alley links, only one of which eventually leads to something useful... and that useful thing isn't even all that scientific?
Seriously - if you want less skeptics on the subject, it would help if you provided something more than blind assertion by a university-affiliated advocacy group, and what one guy did with his little handycam...
-
Re: WTF
It isnt because your bias makes you refuse to read sceptical scientific discussions that they dont exist.
Projection isn't a river in Egypt.
Stop reading media crap or rebuttals by propaganda sites and, just for your educational purposes, read some scientific sceptical sites and make up your own mind.
Or maybe read some original papers on the issue! Of course, if it doesn't agree with Anthony Watts, then you'll probably consider it propaganda. Bet you never read these.
-
Re:Ah, yes, the hockey stick
Here are two peer reviewed papers that dispute M&M:
"Comment on "Hockey sticks, principal components, and spurious significance" by S. McIntyre and R. McKitrick", Huybers, P. (21 October 2005)
"Robustness of the Mann, Bradley, Hughes reconstruction of Northern Hemisphere surface temperatures: Examination of criticisms based on the nature and processing of proxy climate evidence", Wahl, Eugene R.; Ammann, Caspar M. (31 August 2007)
-
Re:hm...
Nevada is a tectonically active area undergoing substantial amounts of stretching (purple dots = historical quakes). It's the whole reason for the "basin-and-range" topography that typifies the region. But, no, it sounds like hydraulic fracturing?
-
Some technical info for slashdotters
I wanted to give some info on the technical aspect of getting this to work that might be appreciated by slashdotters.
You can read about the Blue Waters hardware profile here. Our simulation "only" utilized 20,000 of the approximately 700,000 processing cores on the machine. Blue Waters, like all major supercomputers, runs a Linux kernel tuned for HPC.
The cloud model, CM1, is a hybrid MPI/OpenMP model. Blue Waters has 16 cores (or 32 depending on how you look at it) per node. We have 16 MPI processes going and each MPI rank can access two OpenMP threads. Our decomposition is nothing special, and it works well enough at the scales we are running at.
The simulation produced on the order of 100 TB of raw data. It is easy to produce a lot of data with these simulations - data is saved as 3D floating point arrays and only compresses roughly 2:1 in aggregate form (some types of data compress better than others). I/O is a significant bottleneck for these types of simulations when you save data very frequently, which is necessary for these detailed simulations, and I've spent years working on getting I/O to work sufficiently well so that this kind of simulation and visualization was possible.
The CM1 model is written in Fortran 90/95. The code I wrote to get all the I/O and visualization stuff to work is a combination of C, C++, and Python. The model's raw output format is HDF5, and files are scattered about in a logical way, and I've written a set of tools to interface with the data in a way that greatly simplifies things through an API that accesses the data at a low level but does not require the user to do anything but request data bounded by Cartesian coordinates.
I would have to say the biggest challenge wasn't technical (and the technical challenges are significant), but was physical: Getting a storm to produce one of these types of tornadoes. They are very rare in nature, and this behavior is mirrored in the numerical world. We hope to model more of these so we can draw more general conclusions; a single simulation is compelling, but with sensitivity studies etc. you can really start to do some neat things.
We are now working on publishing the work, which seems to have "passed the sniff test" at the Severe Local Storms conference. It's exciting, and we look forward to really teasing apart some of these interesting processes that show up in the visualizations.
-
Re:Just coming to that realization now?
Dear, I don't have a source, that the sky is blue. Are you going to deny it until I find one?
No, I find it quite plausible that the sky is blue, so I'm prepared to take that on your word, and my impression of its prior plausibility.
The problem is that you claimed that "Since "climate scientists" produce nothing tangibly useful," which despite your attempt to cast this as plausible as "the sky is blue", sets off my bullshit detector. So I wonder if you dreamed it up yourself, or if you have some plausible basis, or data.There are no privately-owned employers for "climate scientists" studying "global warming"
What about Remote Sensing Systems.?
Florida is a very large portion of the Atlantic coast, that gets hurricanes at all.
The Atlantic has two sides, and stretches two hemispheres. Florida is not that large.
That link of yours is remarkably lacking in actual data (as in numbers, rather than words). If that's the best you could find, you should start asking yourself some questions...
Okay, that statement is from the AR4, but if you're big into actual data, you're claim is that the data shows that "Ten years ago it was in-vogue to predict nor just the sea-water rising by an inch, but also increased hurricane activity [...] — but real life demonstrated the exact opposite [weather.com] to the prediction.
As sea level is rising , I assume that you mean that hurricane activity has been demonstrated to be decreasing. However, I can't find any confidence calculations in your link. What statistical significance do you claim can be attributed to this decrease in activity?The people, who — 10 years ago — predicted the rise of hurricane activity need to be fired from their tax-funded jobs. They failed us and we don't want to keep paying them.
Okay, show me the proof that they were wrong, and to what confidence. And give me the names of these researchers that you want fired. And show me who was doing better at the time that we can replace them with.
Plants love CO2.
Yes, but not equally. Poison ivy loves it more than woody plants. And coral reefs, and so ocean productivity hate it.
Maybe, the problem — if it is a problem — is not in burning too much fuel, but in not having enough forests to process it?
Carbon in the biosphere is a cycle dear. How are you going to keep animals from eating the plants, and how are you going to keep the plants from rotting once they die?
It is even better "proven", that by jumping, I push the rest of Earth in the opposite direction. Is there any danger in our planet changing its orbit from humanity's jumping up and down?
No. Momentum is conserved during the jump.
The CO2 did keep increasing for the last 10 years.
Yes. It accelerated.
Yet, no growth in hurricanes materialized and the entire "global warming" is now considered "on hold"
Show me the statistical signficance of the first claim.
The second claim is one that you're happy to hang your hat on? How was it received in the scientific literature?
For instance, SB11 [8] fail to provide any meaningful error analysis in their recent paper and fail to explore even rudimentary questions regarding the robustness of their derived ENSO-regression in the context of natural variability.
Addressing these questions in even a cursory manner would have avoided some of the study’s major mistakes. Moreover, the -
Its nonsense
His website proves itself false. He claims it was founded in 1988; however Whois records for the domain only go back to 2000, and the web address doesnt appear in the Wayback Machine until 2003.
Looks like the guy has tried to mix his own marketing material into google results, but you can see where his highly touted ScenGen actually comes from here:
http://www.cgd.ucar.edu/cas/wi...This version of MAGICC/SCENGEN was developed primarily with funding from the U.S. Environmental Protection Agency, but it rests on developments carried out over the past 20 years that were funded by a number of organizations.
So the "ScenGen" you keep seeing in all the results is not the same as the one this O'brien dude keeps blathering about. In fact, hes apparently the only one who cares about it; he did do one talk at IEEE in 2010 (though strangely theres no mention of it anywhere except the bog-standard event page), but there doesnt appear to have been any chatter on the internet about it whatsoever.
So, to the AC who posted this: hopefully this is a useful lesson. Anyone can say anything on the internet, and even make it look passingly believable. But if it sounds "too perfect", its probably rubbish.
-
Re:It's about time
When exactly did China and Russia tell you they want to ensure our mutual assured destruction? Ever heard of The Kyoto treaty? I dont think it was China or Russia that caused that to fail.
China agreed to it because they were exempted from everything, and they are now the largest producer of CO2 on the planet. Besides, it was actually the Kyoto protocol itself that failed, regardless of who did and didn't sign up for it.
-
Re: Climate change is for pussies.
In this graph from NOAA you can see there's been far more than 0.2 degrees warming since 1940. It looks to be about 0.5 degrees Celsius since 1940. In fact, it's warmed 0.6 degrees Celsius since 1970.
-
Re:Translation...
You mean like the overall long-term increase in Antarctic ice mass, despite breakups in the Western sheet?
False. Antarctic land ice mass is decreasing, and reliable estimates of Antarctic sea ice volume (or mass) aren't available.
Even if you meant to refer to Antarctic sea ice extent (not mass), you already ignored me when I told you that this is consistent with Manabe et al. 1991 page 811: " sea surface temperature hardly changes and sea ice slightly increases near the Antarctic Continent in response to the increase of atmospheric carbon dioxide."
But maybe you'll listen to the National Academy of Sciences, if you honestly don't think the National Academy of Sciences is "alarmist". Again, their recent report is educational. They address Antarctic sea ice in question 12.
The gradual, long-term non-warming that has occurred over the last 15-17 years, depending on who you ask?
Jane and Lonny Eacus have repeatedly ignored me whenever I've told you that there's been no statistically significant change in the surface warming rate. But if you honestly doesn't think the NAS is alarmist, you might learn something from their answers to questions 9 and 10. This point is particularly relevant: "More than 90% of the heat added to Earth is absorbed by the oceans and penetrates only slowly into deep water. A faster rate of heat penetration into the deeper ocean will slow the warming seen at the surface and in the atmosphere, but by itself will not change the long-term warming that will occur from a given amount of CO2."
I agree: science is a wonderful thing. You can appear to "prove" almost anything you want if you restrict your study to relatively isolated phenomena, and ignore the bigger picture.
No, that's not science the way it's practiced by the National Academy of Sciences, the National Center for Atmospheric Research, the American Geophysical Union, the American Institute of Physics, the American Physical Society, the American Meteorological Society, the American Statistical Association, the American Association for the Advancement of Science, the Federation of American Scientists, the American Quaternary Association, the American Society of Agronomy, the
-
Re:Why do these people always have something to hi
That was his point, don't you think?
Wasting 30 seconds searching would have given you http://simplex.giss.nasa.gov/s..., or http://www.cesm.ucar.edu/model... or http://www.mi.uni-hamburg.de/S...
Funny thing, the code, the data, the explanations, everything has been avalable for years, and yet so many of the public believe they're not. I wonder why that is?
It's like there was this massive political campaign against science. Of which you just became part of. Congratulations! -
Re:Projections
"They make a point now of not sharing the details of the models with people. That would concern you if you had any intellectual curiosity."
Well, that is bullshit of incredible intensity. Just for curiosity, who exactly told you that? You presumably won't have any injection to sharing that data with us.
In return, I will share with you this thing called Google, with which I was able quite rapidly to find:
http://www.gfdl.noaa.gov/fms
http://mitgcm.org/public/sourc...
http://www.giss.nasa.gov/tools...
http://www.nemo-ocean.eu/About...
http://www.metoffice.gov.uk/re...
http://forge.ipsl.jussieu.fr/i...
http://www.giss.nasa.gov/tools...
http://www.cesm.ucar.edu/model...
http://www.cesm.ucar.edu/model...
http://www.cesm.ucar.edu/model...
http://edgcm.columbia.edu/
http://www.mi.uni-hamburg.de/f...
http://www.mi.uni-hamburg.de/H...
There's more but I'm tired of cut and pasting. You would be able to find these also if you have any intellectual curiosity, but them you might have to doubt the sources of your info on how bad the climatology people are, and how they're hiding the code to conceal that out doesn't work, and that maybe the models do run and give outputs, ave before you know it the foundations of you whole world view are shaken. -
Re:Projections
http://www.epic.noaa.gov/epic/...
http://www.giss.nasa.gov/tools...
http://edgcm.columbia.edu/
http://nomads.gfdl.noaa.gov/CM...Some data: http://www2.cesm.ucar.edu/
Some background info:
http://www.ec.gc.ca/ccmac-cccm...
http://www.climateprediction.n...
http://www.climate.uvic.ca/
https://www.ipcc.ch/pdf/techni...This one has videos: http://vimeo.com/user12523377/...
In this age of information, ignorance is a choice.
-
Re:Big Models
Well, except for the warming climate https://www2.ucar.edu/climate/...
-
Re:There are no comments
Cherries? Dude RealClimate.com is one of the top Warmist sites, it was/is ran by
Dr. Gavin Schimdta climatologist and climate modeler at the NASA Goddard Institute for Space Studies (GISS) in New York. He works on the variability of the ocean circulation and climate, using general circulation models (GCMs). He has also worked on ways to reconcile paleo-data with models. He helped develop the GISS ocean and coupled GCMs to improve the representation of the present day climate, while investigating their response to climate forcing. The latest GISS GCM is called ModelE.
an American climatologist and geophysicist,[3] currently director of the Earth System Science Center at Pennsylvania State University, who has contributed to the scientific understanding of climate change over the last two thousand years. He has pioneered techniques to find patterns in past climate change, and to isolate climate signals from noisy data.
an isotope geochemist at the University of Washington in Seattle. His primary research interest is use of ice core records to document climate variability in the past. He also works on the geological history of ice sheets, on ice sheet dynamics, on statistical climate analysis, and on atmospheric chemistry.
a German oceanographer and climatologist. Since 2000, he has been a Professor of Physics of the Oceans at Potsdam University. He received his Ph.D. in oceanography from Victoria University of Wellington (1990). His work focuses on the role of ocean currents in climate change.[1] He was one of the lead authors of the IPCC Fourth Assessment Report.[1]
enestad er Bachelor of Science (Hons) (1992) i fysikk og elektronikk fra University of Manchester Institute of Science and Technology (tidligere UMIST, nå University of Manchester) i Storbritannia og Master of Science (1994) i fysikk fra New Mexico Institute of Mining and Technology i USA (hovedoppgave i skyfysikk). Han har doktorgrad (Doctor of Philosophy (D.Phil), 1997) i fysikk fra Universitetet i Oxford (Storbritannia). Emnet for avhandlinga var havmodellering, Kelvinbølger i Stillehavet og El Niño-fenomenet.
David Archer (who wrote the article)
a computational ocean chemist,[1] and has been a Professor at the Department of The Geophysical Sciences at the University of Chicago since 1993.[2] He has published research on the carbon cycle of the ocean and the sea floor. He has worked on the history of atmospheric CO2 concentration, the fate of fossil fuel CO2 over geologic time scales in the future, and the impact of CO2 on future ice age cycles, ocean methane hydrate decomposition, and coral reefs
A paleoclimatologist, Caspar Ammann studies climates of the past centuries and millennia, including the Little Ice Age and the Medieval Warm Period. His goal is to understand what caused climatic changes in the past in order to learn more about potential global warming in the future. He uses computer models to simulate climate history and compares the results to historical markers such as tree rings and ice cores to reconstruct the past. His research also looks at changes in the Sun's output, the influence of volcanoes on climate, and the extent to which 20th century warming is unprecedented in the recent geologic timescale. He is a researcher in NCAR's Research Appli
-
Re:Show me a climate model for the past 16 years
-
Re:Models vs models
The study assumes that the models that show lower amounts of warming are the "less accurate" ones, and the models with higher warming are going to be "more accurate.
The study "assumes" nothing of the sort. It compared the differences in the way different climate models handle water vapor and cloud formation and found the ones that dry out the lower atmosphere more quickly do a better job of modeling real world observations.
As far as all climate models being wrong that probably has more to do with your misunderstanding of what climate models are designed to do than it does with the climate models themselves. As George Box said "All models are wrong but some are useful." Climate models are at best crude representations of the atmosphere, partly because it's impossible* at this point to model things on a small enough scale to capture everything, but they're still better than any other method we have.
*Impossible because of limitations in computing horsepower. Current models use grid scales of around 100 km x 100 km x 1 km vertical x 30 minutes per step.
-
Everything Old Is New Again
The picture of the MacPro reminded me of the Cray-1 Computer, except that you could sit beside the Cray-1, while sitting on the MacPro seems like it would rather uncomfortable.
-
Re:In the USA
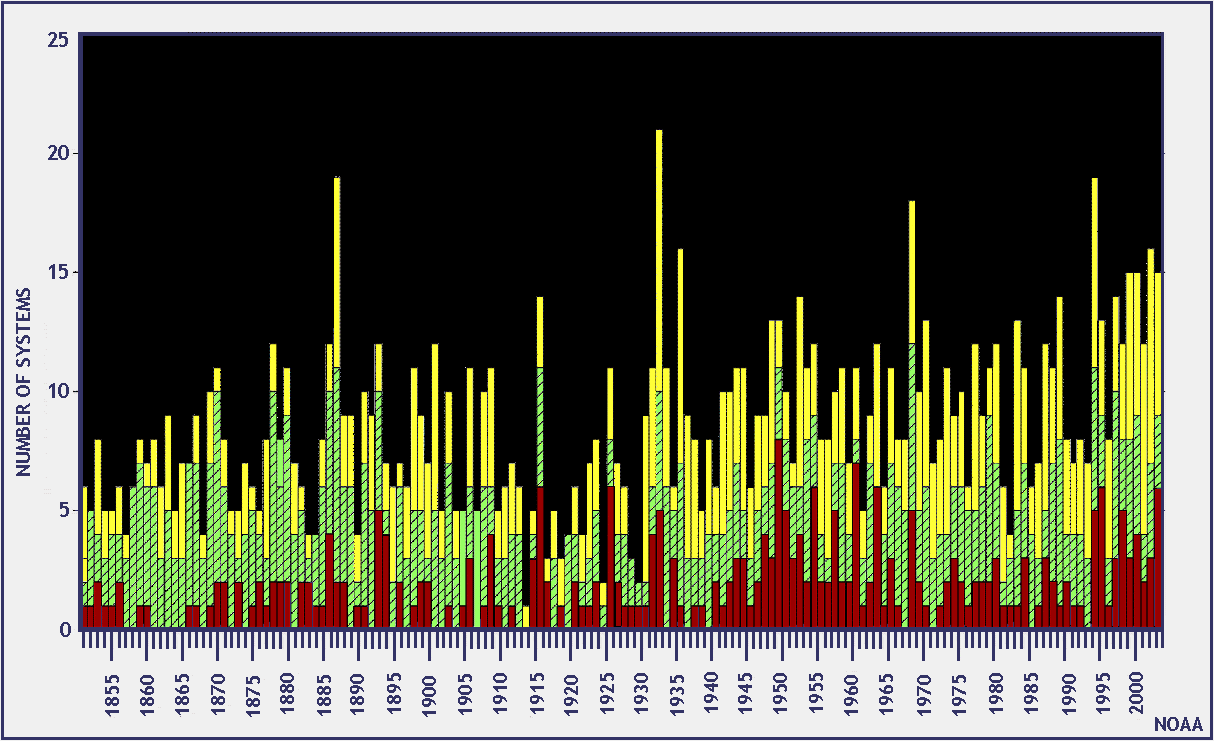
The climate isn't a consistent thing, there will be outliers - the period in the 1880's is one of them. The issue is the average is going up, while the standard deviation is going down, so we're getting a higher number of storms, but we're getting them every year, not just once every 25/50 years. Note the density in recent years compared to historic in the graph of hurricanes per year.
NOAA recently released a report detailing 12 major weather events we've been having (droughts, floods, storms) and their link to climate. There's yet to be a "debunking" of this that uses science instead of conspiracy theories.
The great thing about science is that it corrects itself when it's wrong - hence why the global cooling theories were overturned and replaced with the more accurate global warming. Now, while global warming is happening , it confuses some because it causes more shifts in climate often resulting in colder temperatures (or more snow), so even though the global temperature on average is rising, there are pockets of cold. The models also show this to produce more extreme weather events as shown in the NOAA report above.
The labels may vary, but the proposed action is the same - citizens are urged to change to cleaner energy sources. The libertarians should love this idea, because renewables mean they can be completely independent from utilities or governments and provide their own sources of power with solar or wind. The ones that get hurt are the poor little guy strip-mining a mountain or running a factory.
It's not about control, it's about moving to better energy sources. The first step is education, but there have always been greedy people that don't care what they're doing to everyone else - the same type that output poison into the river killing everything. Then the big government has to come in and tell them that it's not OK to be killing everything. -
Re:What about the last couple decades?
-
Re:What about the last couple decades?
No, see the graph here.
-
Re:Its been obvious for years
Yep, I did.
https://www2.ucar.edu/climate/faq/how-much-has-global-temperature-risen-last-100-years
You just heard someone say 'ice age' and assume it was true. It wasn't. It was just a small decrease in average temperature that someone extrapolated to 'ice age'.
-
Denial is easier than Change
People don't want to change so they deny the credibility of the evidence staring them in the face. Are you really that dense that you cannot see the effects of global climate change around you now? Bleaching of Coral reefs[0], Hurricane frequency[1], Shrinking of one of the largest glaciers on earth[2] not to mention the rate of change in global temps[3] for the past century. Yes it's been warm in the past, but the RATE at which warming occurred has never been seen before. These are the facts and they are happening now. I guess for a lot of people it's more comforting to glue their noses to the manufactured reality of Fox News and the like rather than accept what is happening and that change is needed.
[0] - http://oceanservice.noaa.gov/facts/coral_bleach.html
[1] - http://www.ucar.edu/news/releases/2007/hurricanefrequency.shtml
[2] - http://www.dispatch.com/content/stories/science/2013/04/21/tracking-greenlands-fast-melting-ice-sheets.html
[3] - http://www.npr.org/2013/03/08/173739884/since-end-of-last-ice-age-rates-of-global-warming-amazing-and-atypical
[3] - -
Re:... and yet no global warming in the last 16 ye