 Slashdot Mirror
Domain: bls.gov
Stories and comments across the archive that link to bls.gov.
Comments · 1,395
-
Re:Too good to be true
Wrong
Median income for White Males is HIGHER than in 2001
As always, the facts get in the way -
Re:Doomed to failure due to Teacher Unions
The main problem is the teacher's union, is it?
Bureau of Labor statistics show that 60 percent of families with children have both parents working. Children are less supervised at home, and parents are less likely to take an active role in their child's education because they are busy being serfs in a society where
In effect we have too many parents who thrust their special snowflakes unto the education system and expect it to raise their children for them. We have a culture that puts greater value on having multimillion dollar sports arenas than special programs. We have No Child Left Behind, which in the tradition of government named programs does the opposite of its namesake, and turns schools into just an assembly line of standardized testing.
But most of the blame falls to the teacher's unions. Yeah, right.
-
Banks have been automating since the ATM
ATMs started coming out in the 1970s. People back them wondered what would become of all the teller jobs these machines would replace.
In the 90s it was automatic deposit of payroll that kept people from having to talk to a human at a bank.
Nowadays, it's been months since I set foot in a bank. I'd guess that's true for many slashdot readers. Still, the banking industry is employing more people, not less!
According to BLS, there are 8.4 million people employed in the US financial sector, and this is expected to go up by half a million in the next 10 years.
It seems the robot apocalypse isn't all it's cracked up to be.
-
But don't forget
There's a shortage of STEM employees, the universities told me so! And the universities are just here to teach us to think, they would never try to extract a profit from naive kids.
Oh, wait.
https://www.bls.gov/ooh/archit...
Oh yeah, it's a dead end.
-
Re:I already have a career in "Tech"
https://www.bls.gov/ooh/archit...
EE is dead. Who would want to be an engineer in the US?
-
Re:Low inflation is bogus; only electronics droppi
Meanwhile. a lot of ordinary people, especially those in minimum wage jobs, have extreme difficulty paying for basic necessities. Is there an inflation index for necessities, i.e. food/shelter/clothing and transportation?
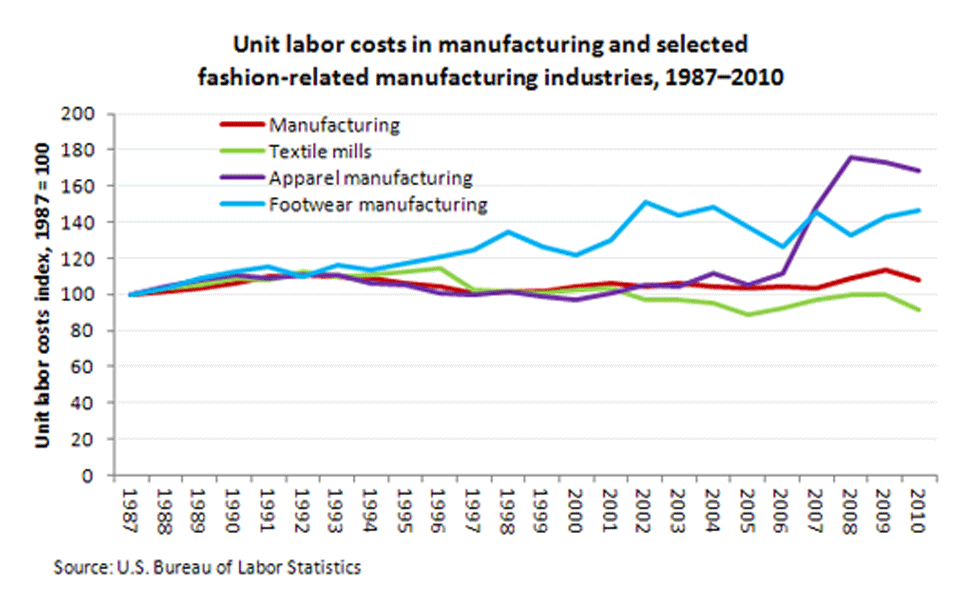
Sounds like a difficult figure to calculate, but you can look at percentage of spending. The lowest quartile spend ~35% of their income on food and that's relatively stable. In 1992 the AAA's driving cost gave a composite index of 38.8 cents/mile for 15k miles, which put into an inflation calculator is 67.9 cents in 2017 dollars while for 2017 it's 56.6 cents. Basic clothing I didn't really find any great statistics for and is hard to separate from design and fashion clothes but labor costs have been pretty flat from the 80s to 2010 which indicates prices on basic clothing wouldn't really get much better either. Price per square feet for a new home is also pretty flat in real dollars, even though the number of square feet per home and per person is growing.
In summary, living on minimum wage wasn't easy a few decades ago, it's still not easy now. It's hard to find some figure that's significantly worse though, though increasing disparity may in itself be a problem if you feel "everybody else" can afford to drink their coffee at Starbucks except you. That's what drives most people into financial disaster, if you accept the social stigma of being poor and just blatantly say you can't afford it you'll probably do okay. It's those who have to try pretending they have money when they don't who bury themselves in credit card debt and end up in a quagmire they never get out of. I have one buddy that is like that, he's made some life choices which has left him quite far behind us financially. And nobody's pushing him to spend, but he's constantly overextending himself.
-
Re:Storms?
The Unemployment Rate this year since January has been 4.8%, 4.7%, 4.5%, 4.4%, 4.3%, 4.4%, 4.3%, 4.4%, 4.2%. Jobs dropped by 33,000 but unemployment went down...? FAKE NEWS!!!
Seriously though, what? Labor force participation rate went up from 62.9% in August to 63.1% in September. Labor force went from 160,571,000 to 161,146,000. Number of employed went from 153,439,000 to 154,345,000. Where do you see 33,000 jobs reduced?
-
Re:Compared to inflation
Netflix introduced the unlimited streaming plan at $7.99 in July 2011. (Their current $7.99 plan doesn't stream in HD, so the $9.99 soon to be $10.99 plan corresponds to their original $7.99 plan.)
$7.99 in July 2011 is equivalent to $8.68 today.
So bumping it up to $10.99 means it's increased by 1.27x the rate of inflation. Or an average annual increase of 5.5% vs the actual annual CPI inflation rate of 1.4% over the last 6 years.
Right, but how much content have they actually lost access to since 2011?
I would argue quite a bit since they let the Starz and other popular content deals expire.
They have backfilled with less popular content and some of their own making, but as a subscriber, I would argue that their content is less appealing than it was 2011.
Also, they have completely destroyed the usability of their website to accommodate this loss of content. Their "ranking" system doesn't actually show you others' ratings anymore, it shows you what THEY want you to watch. You can't easily sort out the available content by year or popularity. It's really hard to even get to the review section of each show. And while you do all this, there are 4000 animated trailers playing in the background, which attempt to induce a seizure so that you will stop trying to find good content and just watch what they tell you to watch.
It wasn't like they accidentally lost this functionality either. They did it to force their less appealing content on you and try to hide the loss of their more popular content deals.
I still think they provide a valuable service, but it is nowhere near as valuable as it used to be. This is due in part to mismanagement on their part but mostly to the greed of their content suppliers. The end effect to the user is still the same though. Lower quality content for more money, which will indeed drive many back to pirating.
-
Compared to inflation
Netflix introduced the unlimited streaming plan at $7.99 in July 2011. (Their current $7.99 plan doesn't stream in HD, so the $9.99 soon to be $10.99 plan corresponds to their original $7.99 plan.)
$7.99 in July 2011 is equivalent to $8.68 today.
So bumping it up to $10.99 means it's increased by 1.27x the rate of inflation. Or an average annual increase of 5.5% vs the actual annual CPI inflation rate of 1.4% over the last 6 years. -
Re:Better jobs?
Looking at history, the new jobs have been better.
A hundred years ago, most people worked in hard labor jobs (farm jobs, factory jobs, meat packing, etc.) from sunup to sundown, seven days a week. Today, we typically work five days a week, 8-10 hours a day. I'd call that improvement.
Sure, some jobs might be worse, such as retail and fast food workers who don't have a predictable schedule. But those jobs account for only 18% of the US work force, far less than the percentage of farm and factory workers 100 years ago.
-
Re:No more business as usual
Theft is now terrorism?
Trade secrets aside, manufacturing relocation and trade deficits don't work the way most people think.
There's this thing but I think the numbers are slightly-off. 18% is a lowball figure for payroll costs (usually taxes and benefits are more like 40%-60% of payroll; wages make up the rest).
The tl;dr is that cutting off Chinese manufacture and producing (in this example) trousers in the United States would create few net jobs if wages were very low in the factories; loses more jobs as wages go up (quickly causes a net-loss of American jobs); and, in any case, permanently makes Americans poorer.
That's because Americans will have to buy the locally-manufactured good at a price representing more of their working-hours. It's the same proportional difference at any income level for the consumer; higher-income consumers are looking at a smaller absolute increase in hours worked to purchase thing. Because this exchanges for labor-hours at the factory and the number of factory workers at maximum would represent some 0.1% of the employed labor force (178k / 158,000k), most consumers get poorer, which is why you so-quickly go from a small net-gain of jobs to a net-loss.
Further, the labor force expands in abundance and stagnates or contracts in scarcity. You can see the response in the civilian labor force on the BLS, although that's a result of many factors and not a strong argument. During the height of the recession, there was news of people retiring earlier and of college students going to grad school to avoid entering a bad employment market; during recovery, more college students dropped out early to get jobs, and more people worked later into retirement (bigger Social Security pension). The rate of immigrant labor also changes.
That means that a gain or loss of jobs is a temporary thing, and quickly buffed out; while a gain or loss of poverty is just
The United States's biggest threat from China is that China will stop exporting to us, thus forcing us to make stuff here, destroying our buying power and decimating the retail and shipping industries by making the average American far too poor to afford all the things we used to buy (meaning jobs go away).
China's biggest threat from the US is that we'll learn to build great big automated factories with very few humans before they can offer us lower prices using the same technology paired with greater manufacture expertise and lower wages. In such a situation, China's economy would lose the capacity to sell its labor, and would collapse under the pressure of extreme poverty. In theory, Chinese wages will rise with technology, e.g. the tech makes stuff for half as much and they pay workers just under twice as much and so the price still goes down. Even if so, losing a big chunk of their export market will collapse their economy.
Both sides benefit from trade. Exports are great for the economy; so are imports. It's not a balance, where one hurts us and the other helps us.
-
Re:Aaaaand .. they're already pissing people off
Well Amazon's trying to do it too. So I guess the VCs are trying to beat Amazon to market?
Although regardless as to who wins, unless Walmart backs you, you'll still loose in the long run.
Actually we loose anyway, who's going to hire all of the Walmart employees that get sacked over this? They make minimum wage because that's all they are worth currently, and lack the funds and support to retool / re-educate themselves for a different job. Nevermind what happens when you realize retail makes up about 15 million jobs, and replacing most of these with automated booths would kill about half of those jobs. (No need to man the booths means no security guards, cashiers, cleaning staff, or shelf stockers, in addition to a drastic reduction in warehouse, delivery (assuming they don't go the UPS / Fedex route), maintenance, and yes even management staff.) If you thought that Walmart's jobs being subsidized by taxpayers and SNAP was bad, wait until this takes hold.
-
Re:Automation = productivity
They aren't.
-
Re:That's not how productivity gains work
If you don't like U-3, think in terms of U-6 as a statistic. I am hard pressed to come up with statistically significant number of people that are not included in U-6 that should be counted as the workforce.
-
Re:Unemployment low...right...
The gov't has not changed the definitions. All the detail is available from the BLS. Go look: https://www.bls.gov/news.relea...
-
Re:"Chamberlain says that with unemployment so low
He's referring to U-3. And based on that he is correct. Perhaps you don't understand unemployment rates.
-
Re:"Chamberlain says that with unemployment so low
He's referring to U-3. And based on that he is correct. Perhaps you don't understand unemployment rates.
-
Re:Pay More Money
320M people total. 200M workforce participation rate. https://data.bls.gov/timeserie...
48M people over 65. https://www.census.gov/newsroo... 74M people under 18. https://www.childstats.gov/ame...
So you want retired people and children to work?
There are a couple of problems with using those numbers as-is.
First, merely having a job (workforce participation) tells you nothing about whether you are underemployed, whereas unemployment takes that into account.
Second, workforce participation tells you nothing about how many people were forced into retiring earlier than originally planned, but concluded that they wouldn't be able to find work, so they didn't bother. The question isn't whether anyone over 65 is working, but rather whether the number of people over 65 who are working has decreased, and whether that decrease was caused by a lack of opportunity to keep working or by having so much money that they didn't feel the need to keep working.
-
Re:Pay More Money
320M people total. 200M workforce participation rate. https://data.bls.gov/timeserie...
48M people over 65. https://www.census.gov/newsroo...
74M people under 18. https://www.childstats.gov/ame...So you want retired people and children to work?
-
but don't forget kids!
Electrical Engineering is a very lucrative career!
https://www.bls.gov/ooh/archit...
Now fork over all that cash to the cult, I mean university and you'll get a piece of paper worth marginally more than toilet paper.
-
Re:$92k?
Your physician? Almost certainly. But for your plumber, probably not unless he's in the 90th percentile. Just posting these for interest. I think you have a great point.
-
Re:$92k?
Your physician? Almost certainly. But for your plumber, probably not unless he's in the 90th percentile. Just posting these for interest. I think you have a great point.
-
Re:Unions also love min wage
You're right. https://www.bls.gov/opub/repor...
The percentage of hourly paid workers earning the prevailing federal minimum wage or less declined from 3.3 percent in 2015 to 2.7 percent in 2016. This remains well below the percentage of 13.4 recorded in 1979, when data were first collected on a regular basis.
I am surprised to learn that it is so low.
-
Re:I had posted this elsewhere. My op
Well, you might have asked where I was living! And...I was paid 30K less than my peers with more experience. That being said, why do you find it necessary to put me down? Couldn't you say you're sorry that I felt that way and that I must have been a junior at the time. Which I was. No, you had to infer that I must have been bad at my job to be making so little. "I know I couldn't have hired anyone competent for that price at that time". Really? In THIS post, that is asking for women to relay their experiences, you felt it necessary to do that? Wow. Here is the DOL figures for 2016. 21 years later than the dates I was referring to. Scroll on down. I'm sure a lot of people around the country that would stumble upon your comment are going to look at you as pretty entitled. And well, I'll refrain from saying what I really think for now. https://www.bls.gov/oes/curren...
-
Re:Better question:
Similarly, female unemployment is higher than male.
Fake news: unemployment rates: adult men, 4.0 percent; adult women, 4.0 percent.
https://www.bls.gov/web/empsit...
Like most fake news, people often start by try to slip it into otherwise logical arguments, to create a certain narrative, or get some pile-on sympathy but it doesn't make it any less fake (e.g, okay that wasn't true, but the rest of it was)...
Why make fake shit up when the real shit is bad enough that we should concentrate on that first?
Women are underrepresented in certain professions and because the pay rates in those professions, it skews their average pay rates down. Women work, they work hard, and anecdotally they might take lower-paying positions at a higher rate than men. (Maybe to help pay the bills? if they aren't a primary breadwinner) .
Why make up shit like their unemployment rate is higher to fit some crappy narrative spoon fed to the uninformed masses by a manipulative media? What's the point?
Stop with the victim mindset and concentrate on fixing the problem. It's like going to the doctor and complaining that in addition to my cancer symptoms, everyone is laughing at me (which they of course are not, but fits the universe-is-against-me narrative).
-
Re: Common Sense
Raising minimum wages has the effect of raising actual wages for a significant portion of the population.
I guess you missed the post upthread from grimjester, citing the statistics from the Bureau of Labor Statistics: "Together, these 2.2 million workers with wages at or below the federal minimum made up 2.7 percent of all hourly paid workers." Also, the the latest statistics on average hourly wages by sector showed no sector with an average hourly wage below $15/hr.
So no, not a significant portion of the population.
-
Federal minimum, 2,2 million
According to the bureau of labor statistics,
Together, these 2.2 million workers with wages at or below the federal minimum made up 2.7 percent of all hourly paid workers.
So, around 1% would lose their jobs and the rest will have have a 15% rise in pay. Spending that should create some jobs, obv. -
Re: Good Job
But unlike Nazi Germany, our economy is actually doing quite well.
No, and also no, and have I mentioned no?
Our economy is doing quite shit. And the information is right there if you want the truth, not the comforting lies like the "unemployment rate", which has been a blatant out and out lie as long as I can remember.
-
Re:Average wage?
The average wage for people in Wisconsin generally (not just manufacturing) is around $67k. $54k doesn't sound ridiculous.
$67k? The page said otherwise.
Also, the AC GP makes sense because it is the current business model nowadays. Sad isn't it?
-
Re: Electric cars going the way of 3D TV and RoR
Dueling government statistics!
At the bottom of https://www.bls.gov/regions/west/news-release/averageenergyprices_losangeles.htmTable 1. Average prices for gasoline, electricity, and utility (piped) gas, Los Angeles-Riverside-Orange County and the United States, June 2016-June 2017, not seasonally adjusted
In June 2017, the "Electricity per kWh" cost for "United States" was $0.142.
-
Re:Really stressful
For the line of work I'm doing, I get paid quite well.
Yes, that's true. Mean hourly wage for janitors & cleaning staff was $12.99 per hour, which translates to a mean salary of $27,030 per year. Median is around $25k per year.
So for janitorial work, you're right - you're paid quite well.
Of course, for Computer Support Specialists, who have a median pay rate of $23.74 per hour ($49,390 per year), your pay is pretty much middle of the road. Especially given your years of experience, that you're only making the median, is a pretty sad commentary on your ambition and drive. 90th percentile makes $39.50 per hour ($82,160 per year). 75th percentile makes $30.64/hr or $63,740 per year. So what you mean to say is:
"I get paid right in the middle of my pay band, because even with all my 'experience,' I am an unremarkable, unaccomplished support tech who spends more time shitposting on Slashdot than I do actually getting actual work done. I call myself a miracle worker, mostly because I manage to stay employed as a computer support specialist when I'm actually doing the work of the janitorial staff."
I think that's more accurate - don't you?
-
Re:VP of Diversity, Integrity & Governance...
Sourced?
It isn't just this field, and my source is the US federal government's BLS, here.
Many fields are dominated by a specific gender. In software it is about an 80/20 split, buy software is mild compared to other fields. There are many documentaries, books, and reports decrying how this is biased and unfair.
Firefighters, bricklayers, road construction, these are 99.9% male. Somehow there is no social plea for women to be pipelayers, or for more women to hang drywall.
On the flip side, women make up about 90%-95% of various nursing occupations, 97% of dental hygienists, 97% of preschool and kindergarten teachers, 95% of childcare workers, 90% of diatitians and nutritionists. I've heard a few cries for men to enter some of these fields, but generally these are socially accepted as well. When men express an interest in childcare or teaching young children they're socially accused of being pedophiles or creeps.
The gender balance in software development is in line with the variation across most fields. People who say they want the fields to be balanced 50/50 should consider why they aren't going after other fields that are far more imbalanced.
In that regard, I thing the person with the original manifesto has some points, the writeup against the manifesto also has some points, but both need to realize that the distribution is still well within bounds that are typical for many fields. People have preferences, including gender preferences brought on both by nature and society.
-
Re:Television...Radio...Books...
In this case, the data appears to say nothing. TFA is just conjecture, opinion, and a few correlations, which as we all know, are not the same as causation.
Yes, maybe it's the smart phones. But smart phones aren't then only bad things to happen in the last ten years. Rather notably, it's been a rough ten years in terms of trying to find a decent job.
Did smart phones also cause Trump to get elected? Are smart phones causing white working class people in the middle states to kill themselves with drug overdoses? Are smart phone responsible for the rise of ISIS in the Middle East?
In a time when it's so hard for ordinary people just to have basic necessities, correlation is a long way from causation when it comes to smart phones.
-
Re:Anyone care to post Tesla's side of the story?
Nope employment is at an all time high not seen since late 90s
Sigh. Unemployment statistics are intentional lies, yes, even the U-6. You need to follow the inverse of the labor participation rate, which has been falling since the late 90s, the peak of the dot-com bubble... if you want to make any sense, that is. Of course, as an anonymous coward, you don't have to care. But then, since you are an anonymous coward, the assumption is that you're full of shit until proven otherwise, which you failed to do.
-
Re:US parent here
Budget cuts for universities... For the last 20 years, tuition at universities has greatly outstripped the inflation rate. Assuming costs of running the university don't grow more than 1.4 times inflation, then there should be plenty of money to serve students. Of course, the growth in the cost of a college degree has doubled that of inflation, so...
-
Re:Some people don't have to work
Just because 20% of people don't work
Labor Force Participation rate, which is a better measure of real employment, is at 62.8% thus 37.2% of people don't work.
-
Re:It's politically motivated
Hide it by making the statistics to the public.
In the US, you can go to BLS's web site, and it'll show you all 6 unemployment statistics (the number in newspaper headlines in U3). They'll also show the employment-population ratio, which the OP is insanely considering the "real" number, as if all working-age adults are supposed to have an employer.
I presume the UK has something similar.
-
Re: Hmmm.
How about Canada, the UK, South Korea, Australia, and New Zealand? They all have [taxfoundation.org] a lower tax burden on workers
Be honest. That is not what the data in your link shows. It shows the tax burden on the *average* worker. Countries with progressive taxation have higher taxes on wealthier citizens so that *average* workers pay less. Canada, the UK, South Korea, Australia, and New Zealand do NOT have lower overall government spending (as the link I previously provided shows), they just shift the tax burden differently than the US (which is what your tax foundation link shows).
Meaning taxes are up about 2.5 times per capita, versus the 50s. Is our quality of life that much better?
That is an unequivocal YES LIFE IS BETTER NOW. Life expectancy is higher. Educational attainment is higher. Workplaces are safer. The environment is cleaner. Food is cheaper. Travel is cheaper.
our labor force participation rate is low, poverty is up, and crime is much higher
Are you allergic to citing sources? Because none of that is true. labor force participation rate is higher now than in the 1950s https://data.bls.gov/timeserie... Poverty rates plummeted from 1959 to 1973 https://www.washingtonpost.com... Crime rate is trending down. Its still higher than 1960, but not much. Murder rate, in particular, is the roughly the same as 1960. Certainly, no correlation with government spending : http://www.factcheck.org/2016/...
-
Re:Yes, except you forgot some really important on
I see Hungary, Germany, Malta, and the Czech Republic beating the US 4.4% unemployment rate. The official EU wide rate is nearly twice the US rate, and 24 of the 28 countries have a higher unemployment rate than the US. Is that really what you wanted to highlight?
-
Re:1.48 billion is chicken feed
I haven't been predicting the next recession on the horizon since 2009; the Zero Hedge guy is a raving lunatic.
Take a look at month-to-month unemployment, go back a while, like 1970.
There are a few wars in there, so this gets messy. In general, if you take a look at the non-reentrant spikes in unemployment, you'll see the outline of recessions. (They're all recessions, but not useful for pattern-matching.) That's great and all, but we need to identify a few things, like when is a new recession coming?
You'll notice that the less-chaotic of these (the ones that didn't have crashes or wars in the middle) spike up after what looks like a level trough (horizontal movement). It looks like something you might want to call "flat" there even though it's curved because there's an inflection point: the slope changes.
Get a straight edge.
On the downslope of, say, the dot-com bust, follow its regression. You'll see a point where it stops following your straight-edge, veering off to the right. Two years after that, the housing market shit itself, and the 2008 recession started.
You can see that in the mid-90s, and the mid-80s, and 1978. You can see the abortion around 1995, where something strange happened as a new recession looked like it might shoot out of nowhere, and then didn't.
So here's the trick: generally, you bottom out on unemployment when a recession ends. You have a recovery period where unemployment steadily goes away, and then it stops going away as fast (inflection point). Two years later, unemployment starts creeping back up. You need to identify the inflection point coming out of a recession, then identify the inflection point entering a new one.
Unemployment isn't a straight line. It'll wobble a bit. It may take 3-4 months to see if you inflected. So you can go up
We're coming up on about the right time. Unemployment just ticked up--that might be the flag, but I need to see if it goes back down 0.1%, then comes back up 0.1%, or if it otherwise shows that it's done falling and is ready to start climbing again. I had predicted September to be about the right time, and figured on a recession kicking in between September 2017 and April 2018. Note that you can't make this prediction until a few months after April 2015; and even then it's a shot in the dark. The marker should be just about here, and the recession itself should be 6-12 months further out.
Some people are actually pretty good at this shit. They're mostly using stock market reads and economic factors like GDP from various sectors. I'm using blunt tools. To the uninitiated, it all looks like voodoo, because there's always a lot of people screaming that the sky is about to fall in just a few more days and we all need to take cover; somehow the weatherman actually knows when a storm is coming, or at least he knows one's actually out there headed this way right now, even if he can't say precisely what time it's gonna get here. Yes, there's always a storm in the future; there isn't always a storm physically formed right over there, making its way over here, to arrive some time depending on how fast the wind blows.
-
Re:Headline: A majority of busniess fail!
While it's true that given enough time all businesses fail, we're talking about startups here, not speculating about the heat death of the universe.
Actually, about 80% of new businesses survive their first year; 69%, their second year; 61%, their third year. After 5 years it's down to just under 50%, and after 20 years it's around 20%. Of course, that's ALL new businesses, not just the Silicon Valley unicorn-hunter variety. More info here.
-
Re:Statstics can lie, data omitted in these number
Unemployment rate numbers are based on the Bureau of Labor Statistics Household Survey Data, not Census.
Unemployment rates of various kinds of collected. For example, the BLS collects the labor force participation rate (62.8%), the employment-population ratio (60.1%), persons marginally attached to the labor force (1.6 million), the number of persons employed part time for economic reasons (sometimes referred to as involuntary part-time workers, 5.3 million) and discouraged workers not currently looking for work because they believe no jobs are available for them (514,000).
The total number of jobs is from the Bureau of Labor Statistics Establishment Survey Data of employers.
See the Employment Situation Summary.
-
Re:unemployment numbers
Thanks for the info; the alternative unemployment numbers are all available here. The classic non-participation rate (if I understand correctly) is U6, or 8.6% seasonally adjusted, down from 9.6% a year ago.
-
Re:Curious...
False. The labor force participation rate fell for the first 7 years of the Obama Administration, and has held steady since then. If people would re-enter the workforce the labor force participation rate would increase. It has not.
-
Labor force participation rate
All the U- numbers have certain guesses, models, and biases involved. For raw data just go for the labor force participation rate which is the least-political measure.
It's slightly improved, but there was clearly no "Obama Recovery" and the US economy hasn't gotten back to pre-crash levels.
"It's the jobs, stupid" as a politician once said.
-
Re:Curious...
Obama moved millions to permanently out of the workforce . The biggest way was via moving 2 million unemployed to permanent disability, which resulted in a nice shaving of unemployment by 3% or so.
-
Re:unemployment numbers
U definitions; U6 is most of the people who want to work but cannot find a job, cannot find a full time job (underemployment) and thus still need assistance, or who have given up.
ShadowStats also factors in those who have permanently left the work force but are still in the 19-64 age range. It's no secret that permanent disability and permanent Medicaid status have both exploded since 2008. ShadowStats factors those people into their own unemployment rate, as it appears the Federal Government moved a permanent segment of society from the unemployment rolls (U3 and U6) to "out of workforce" in an effort to lower the unemployment rate. Perhaps that's why the Labor Force Participation Rate is the lowest it's been in 40 years (note: labor force participation rate only includes those who are of working age, who are physically able to work, but are not actively working - it does not include retirees).
-
Or it could be because of high unemployment
The unemployment rates for 20-25 year olds is twice that of the other age groups. Males being the worst off group.
Source:
https://www.bls.gov/web/empsit... -
Re:Investigative study "smells"
Yes. It's called a living wage. And yes, even summer jobs should pay a living wage. (BTW, most minimum wage jobs are held by adults struggling to support their families, not teens on summer break.)
False. Most minimum wage jobs are held by those under the age of 25. That demographic tends to NOT have families. And of course, you ignore the FACT that many who are paid less than minimum wage are waiters/waitresses, and the wage study/data does NOT include tips and gratuities (it's not uncommon for a waiter at a 4 star restaurant to make $25+ per hour, even though he is "earning" just $2.85 per hour).